
Trade The World
Crypto Today: Bitcoin, Ethereum, XRP hold near support amid continued capitulation, deleveraging
作者 John Isige
發布日期: 17 Nov 2025 | 修改日期: 17 Nov 2025


POPULAR ARTICLES

Bitcoin (BTC) offers subtle signs of recovery, trading above $95,000 at the time of writing on Monday. Altcoins, including Ethereum (ETH) and Ripple (XRP), are making recovery attempts, following in BTC's footsteps, with ETH hovering below $3,200 and XRP trading around $2.27.
- Bitcoin advances toward $96,000 after last week's sell-off, driven by continued deleveraging and ETF outflows.
- Ethereum eyes short-term recovery, but persistent ETF outflows suggest a sticky risk-off sentiment.
- XRP bulls battle to shape the outlook despite low retail demand.
Bitcoin (BTC) offers subtle signs of recovery, trading above $95,000 at the time of writing on Monday. Altcoins, including Ethereum (ETH) and Ripple (XRP), are making recovery attempts, following in BTC's footsteps, with ETH hovering below $3,200 and XRP trading around $2.27.
Data spotlight: Bitcoin, Ethereum, XRP signal recovery despite low investor interest
Since the October 10 deleveraging event, which liquidated over $19 billion in crypto assets in a single day, Bitcoin has recorded a major exodus of institutional investment flows.
US-listed Exchange Traded Funds (ETFs) extended the bearish streak with approximately $492 million in outflows on Friday. According to SoSoValue data, BTC ETFs' cumulative inflow volume averages $58.85 billion on Monday, with net assets of $125.34 billion.
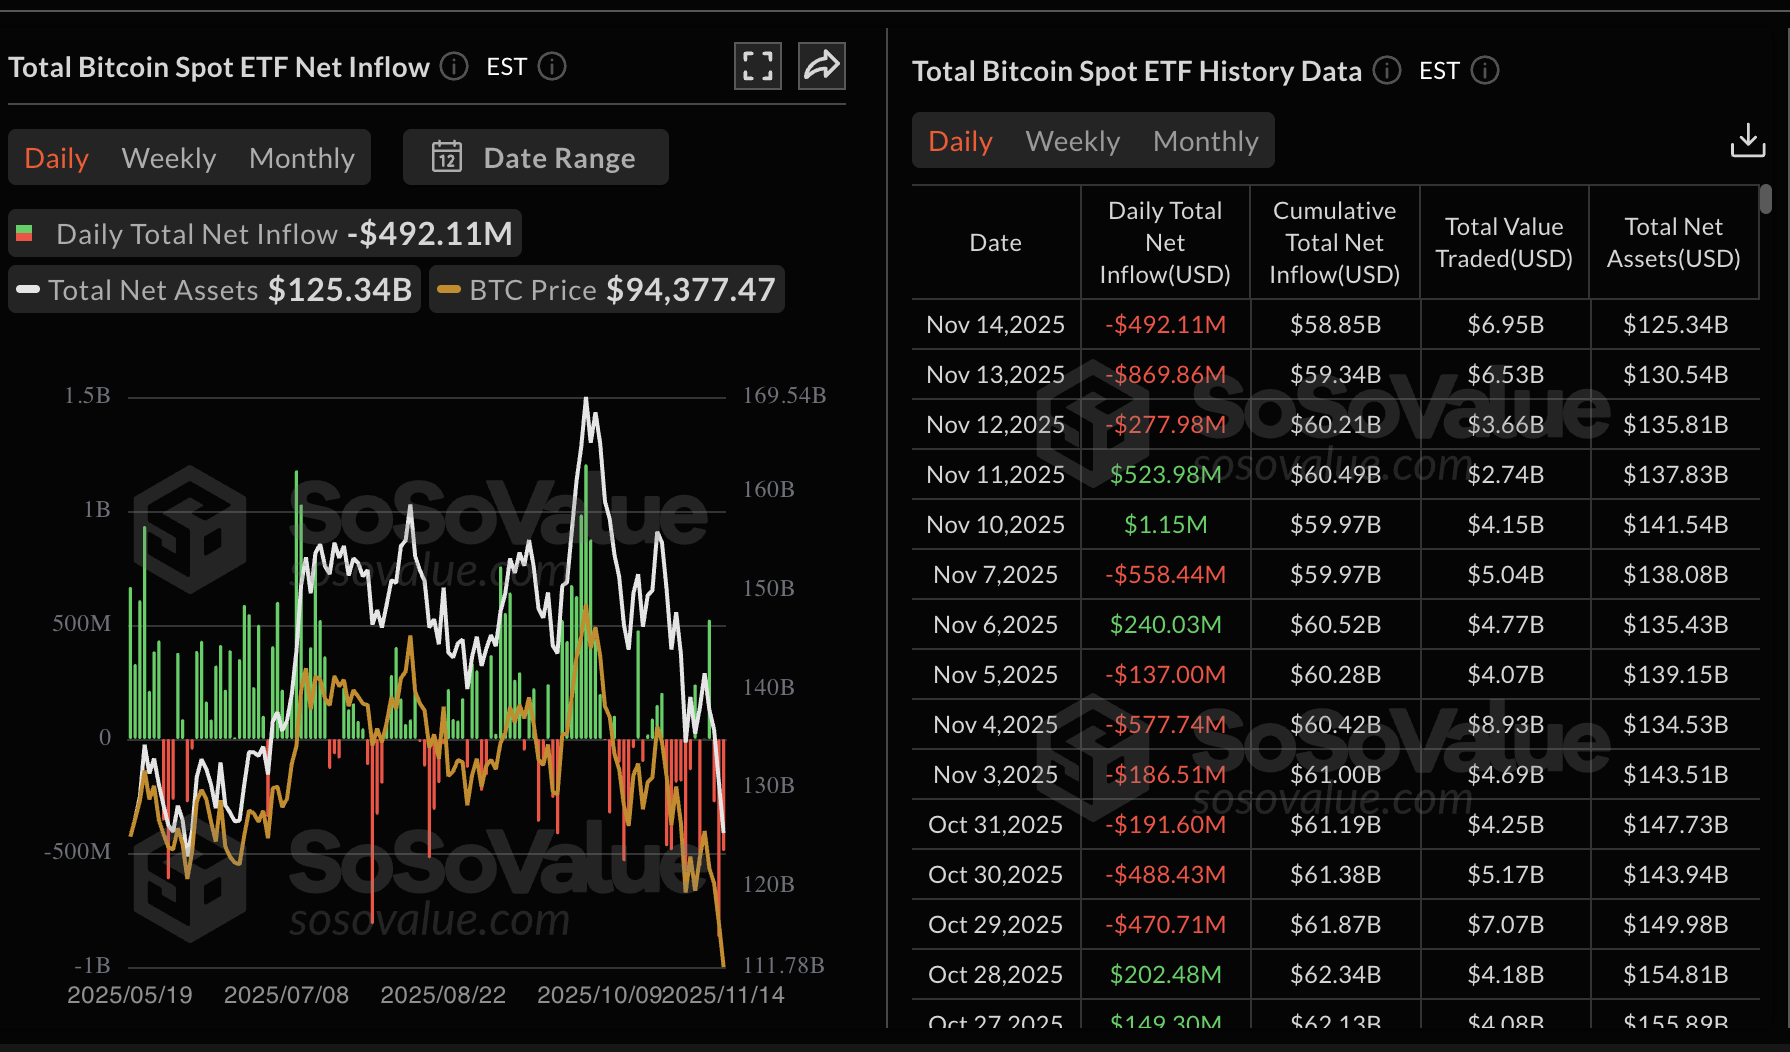
ETFs have become a key measure of interest in Bitcoin and the broader cryptocurrency market. Hence, the steady outflows, particularly in the fourth quarter, paint a grim picture for investors even asthe fourth quarter has historically been bullish for crypto assets.
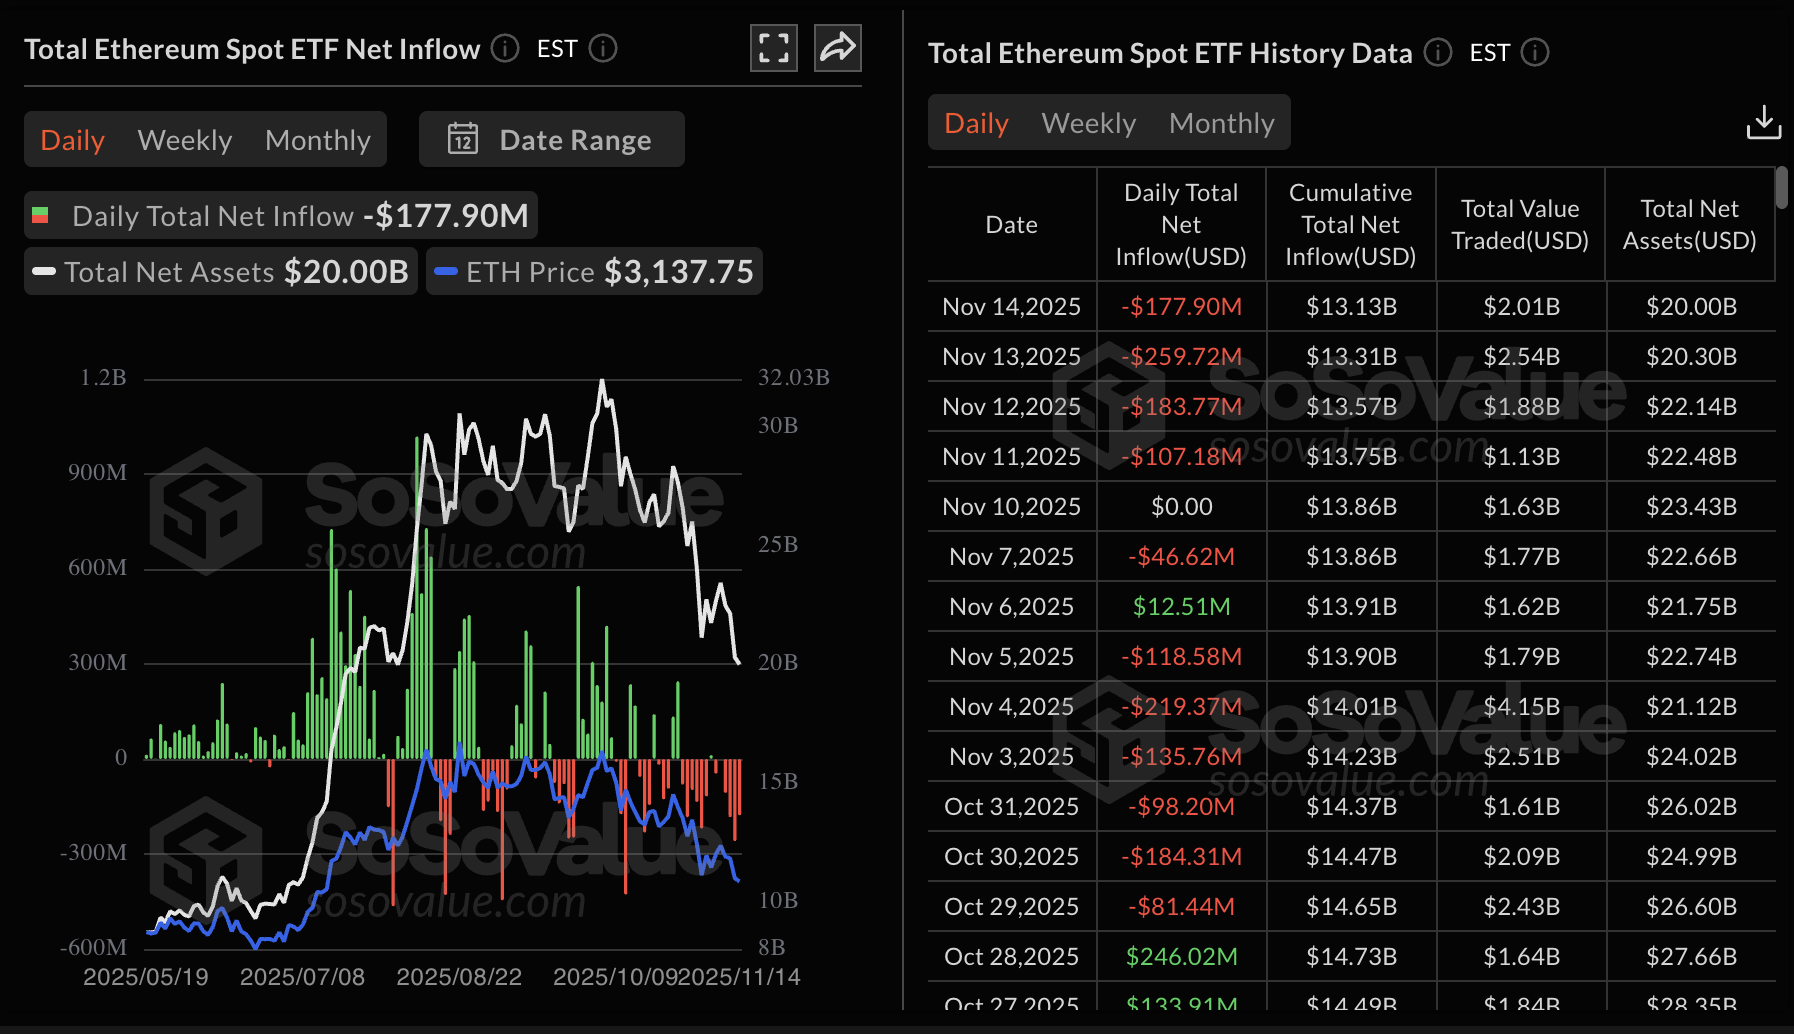
Similarly, Ethereum ETFs listed in the US are posting consistent outflows, with nearly $178 million recorded on Friday. The last time ETH ETFs experienced inflows was on November 6, with $12.51 million.
SoSoValue data shows a cumulative inflow volume of $13.13 billion and net assets of $20 billion. If ETF outflows persist, sentiment will likely remain on the back foot, making it difficult for Ethereum to sustain recovery in the short to medium term.
On the other hand, retail demand for XRP has not recovered since mid-October, characterised by a weak derivatives market. CoinGlass data shows the futures Open Interest (OI) averaging $3.61 billion on Monday, a minor pullback from $3.63 billion the previous day, but significantly down from record highs of $10.94 billion posted on July 22.
The sharp decline in XRP futures OI underscores a weak derivatives market with low retail interest. In other words, traders are not convinced that prevailing market conditions can usher in a short-term bullish trend.
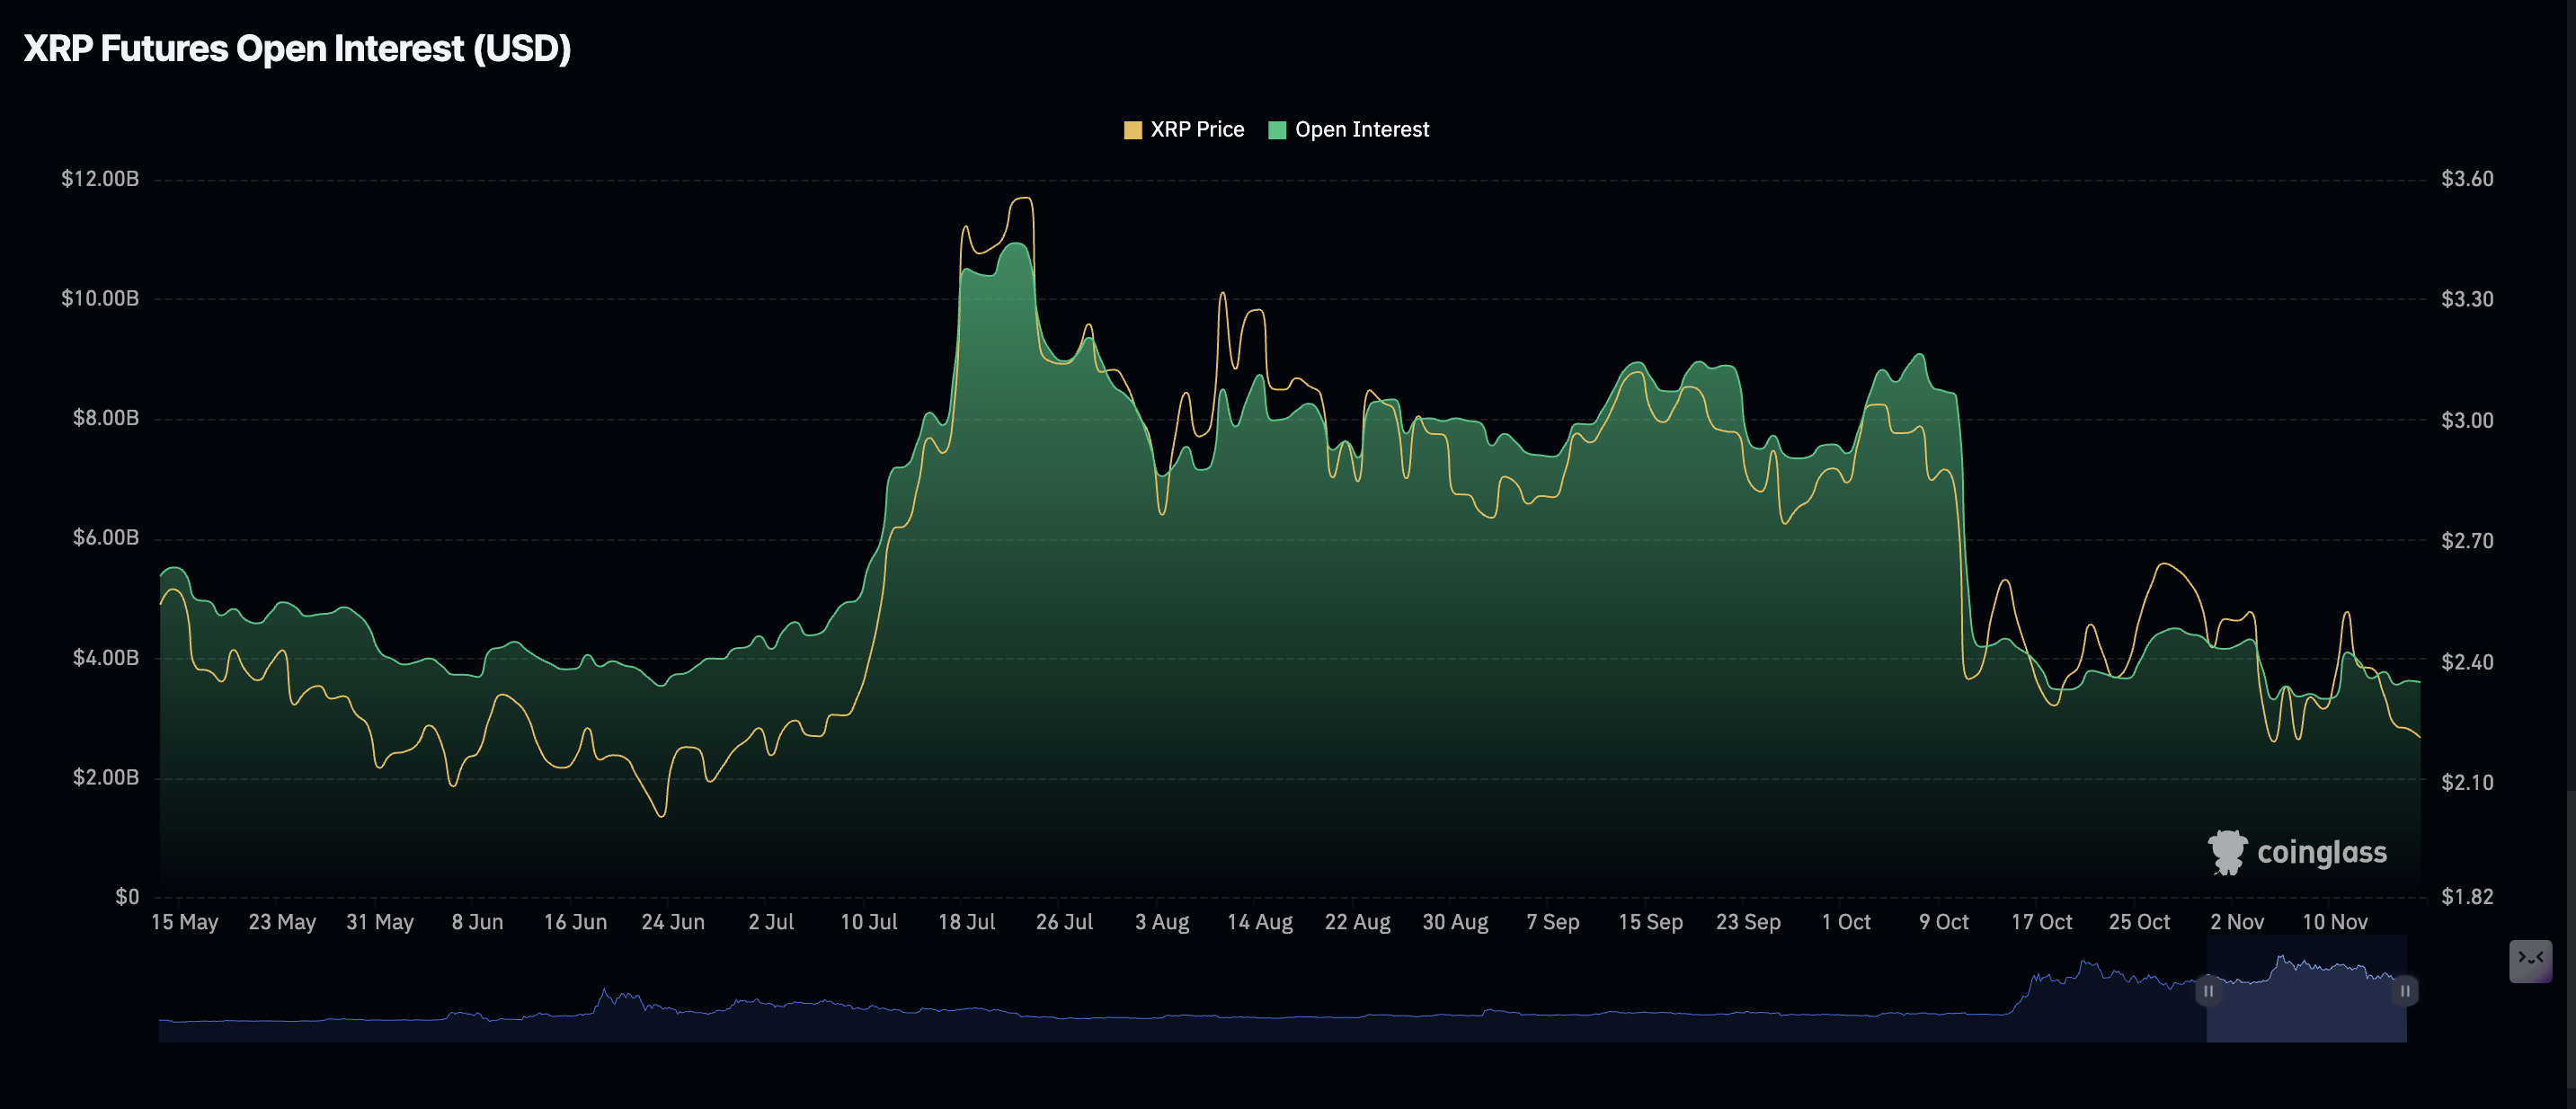
Chart of the day: Short-term holder capitulation drives Bitcoin's sell-off
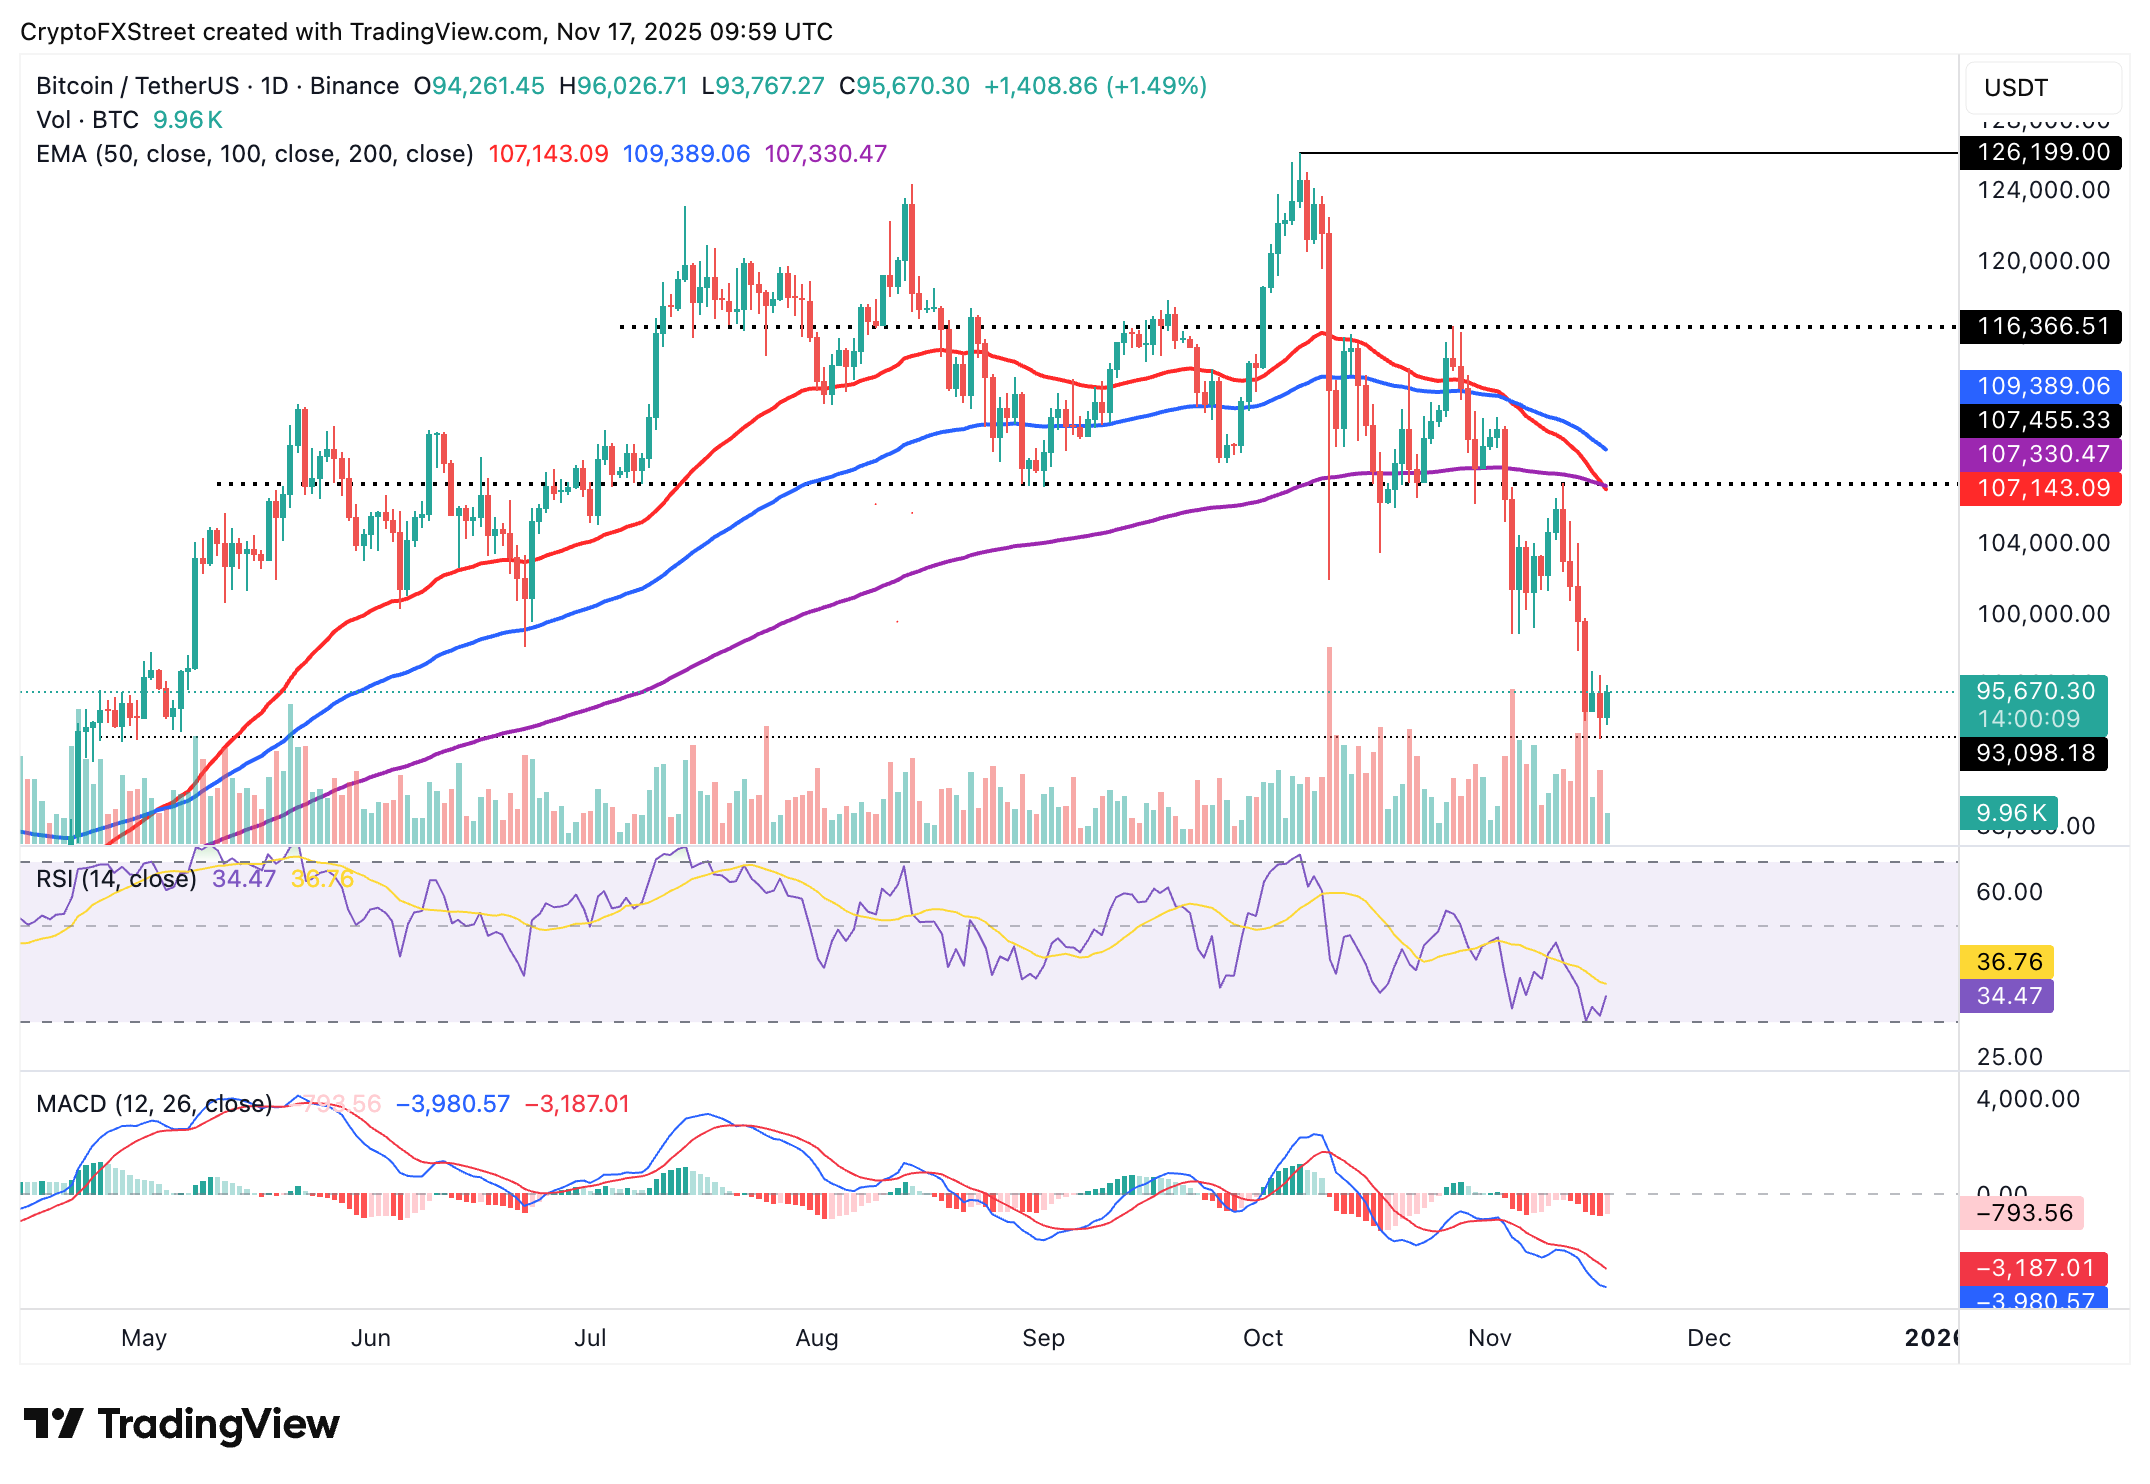
Bitcoin is trading between $95,000 and $96,000 at the time of writing on Monday, buoyed by a mild bullish sentiment in the broader cryptocurrency market. The Relative Strength Index (RSI) has recovered to 34 on the daily chart after flirting with oversold conditions in the past few days.
A steady uptrend above $96,000 may solidify risk-on sentiment, attracting investors to buy Bitcoin as they anticipate a break above $100,000.
However, the Moving Average Convergence Divergence (MACD) indicator maintains the sell signal triggered on November 3. The blue MACD line remains below the red signal line, encouraging investors to reduce their risk exposure and contributing to the selling pressure.
Altcoins update: Ethereum, XRP hold key support
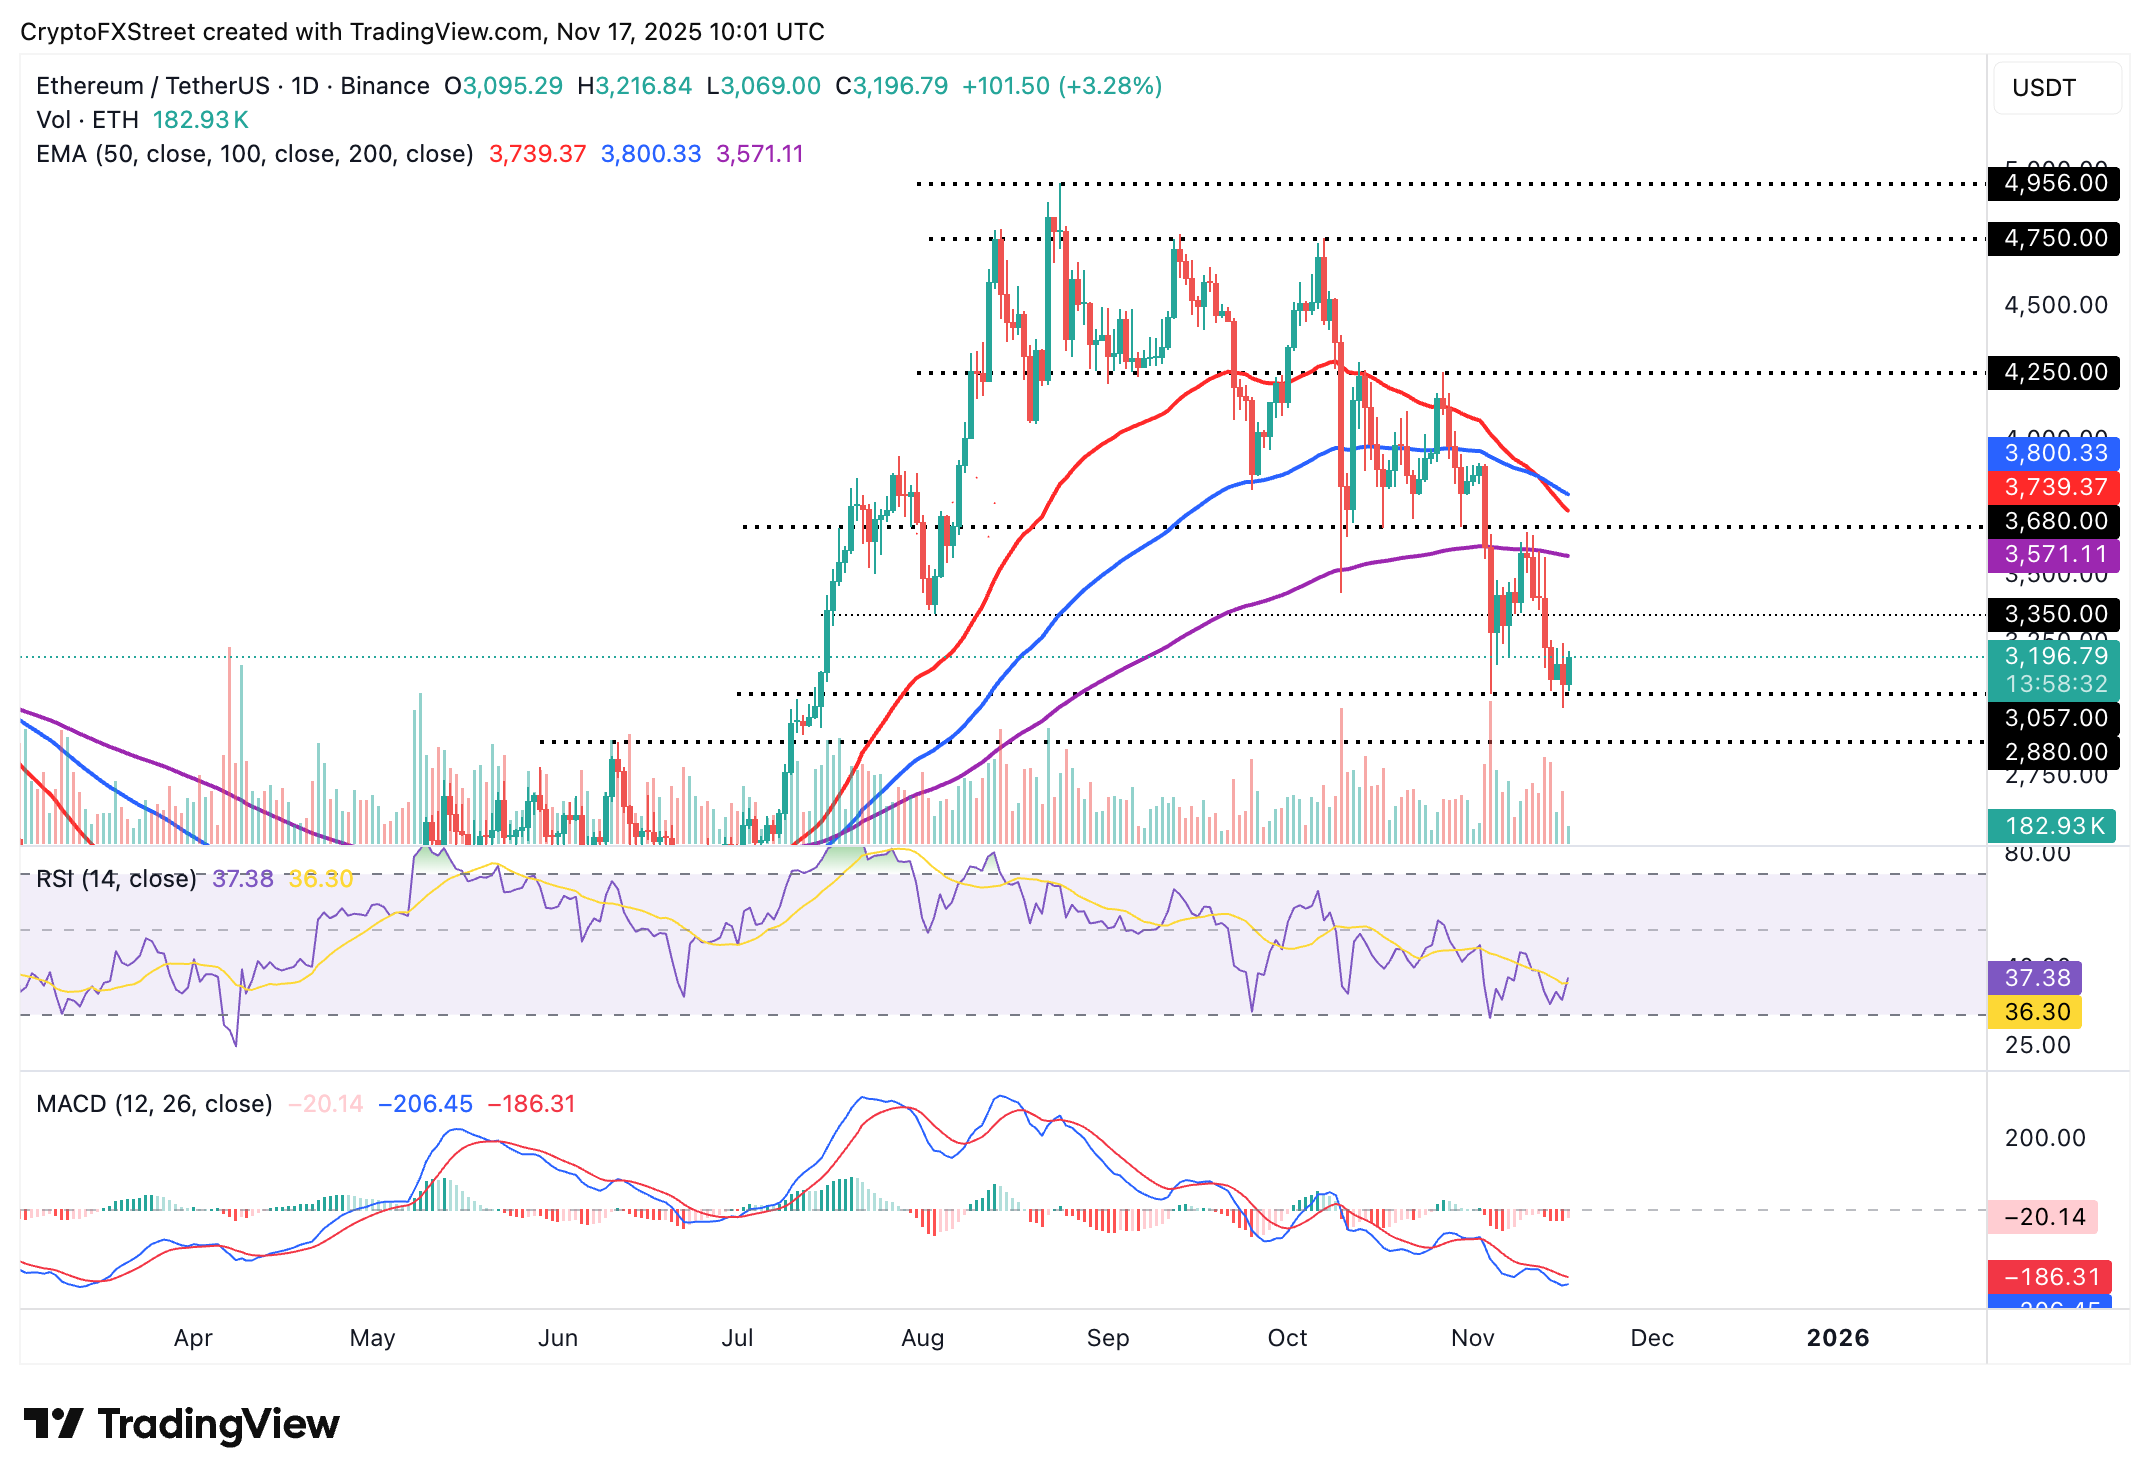
Ethereum is trading slightly below $3,200 at the time of writing, supported by a bullish RSI crossover on the daily chart. The RSI is at 37 after crossing above the signal line, suggesting that bullish momentum is increasing.
A daily close above $3,200 would confirm the bullish grip. Traders will also look out for a potential buy signal from the MACD indicator. This signal would manifest with the blue line crossing and settling above the red signal line while the indicator generally rises.
Still, traders should be cautiously optimistic, particularly after the 50-day Exponential Moving Average (EMA) at $3,739 crossed below the 100-day EMA, which is currently at $3,800, confirming a Death Cross pattern. A Death Cross is a bearish pattern that reinforces risk-off sentiment, hence the need to prepare for further downside, with support at $3,000 and $2,880 in line to absorb selling pressure.
XRP is gaining momentum after testing an intraday support at $2.15 on Monday, driven by investor confidence and low retail demand last week. The RSI at 43 is heading toward the bullish region, which, if achieved, would increase the odds of a short-term recovery.
Key milestones to look forward to include a break above $2.40, a resistance level tested on November 6, the 50-day EMA at $2.49, the 200-day EMA at $2.56, and the 100-day EMA at $2.60.
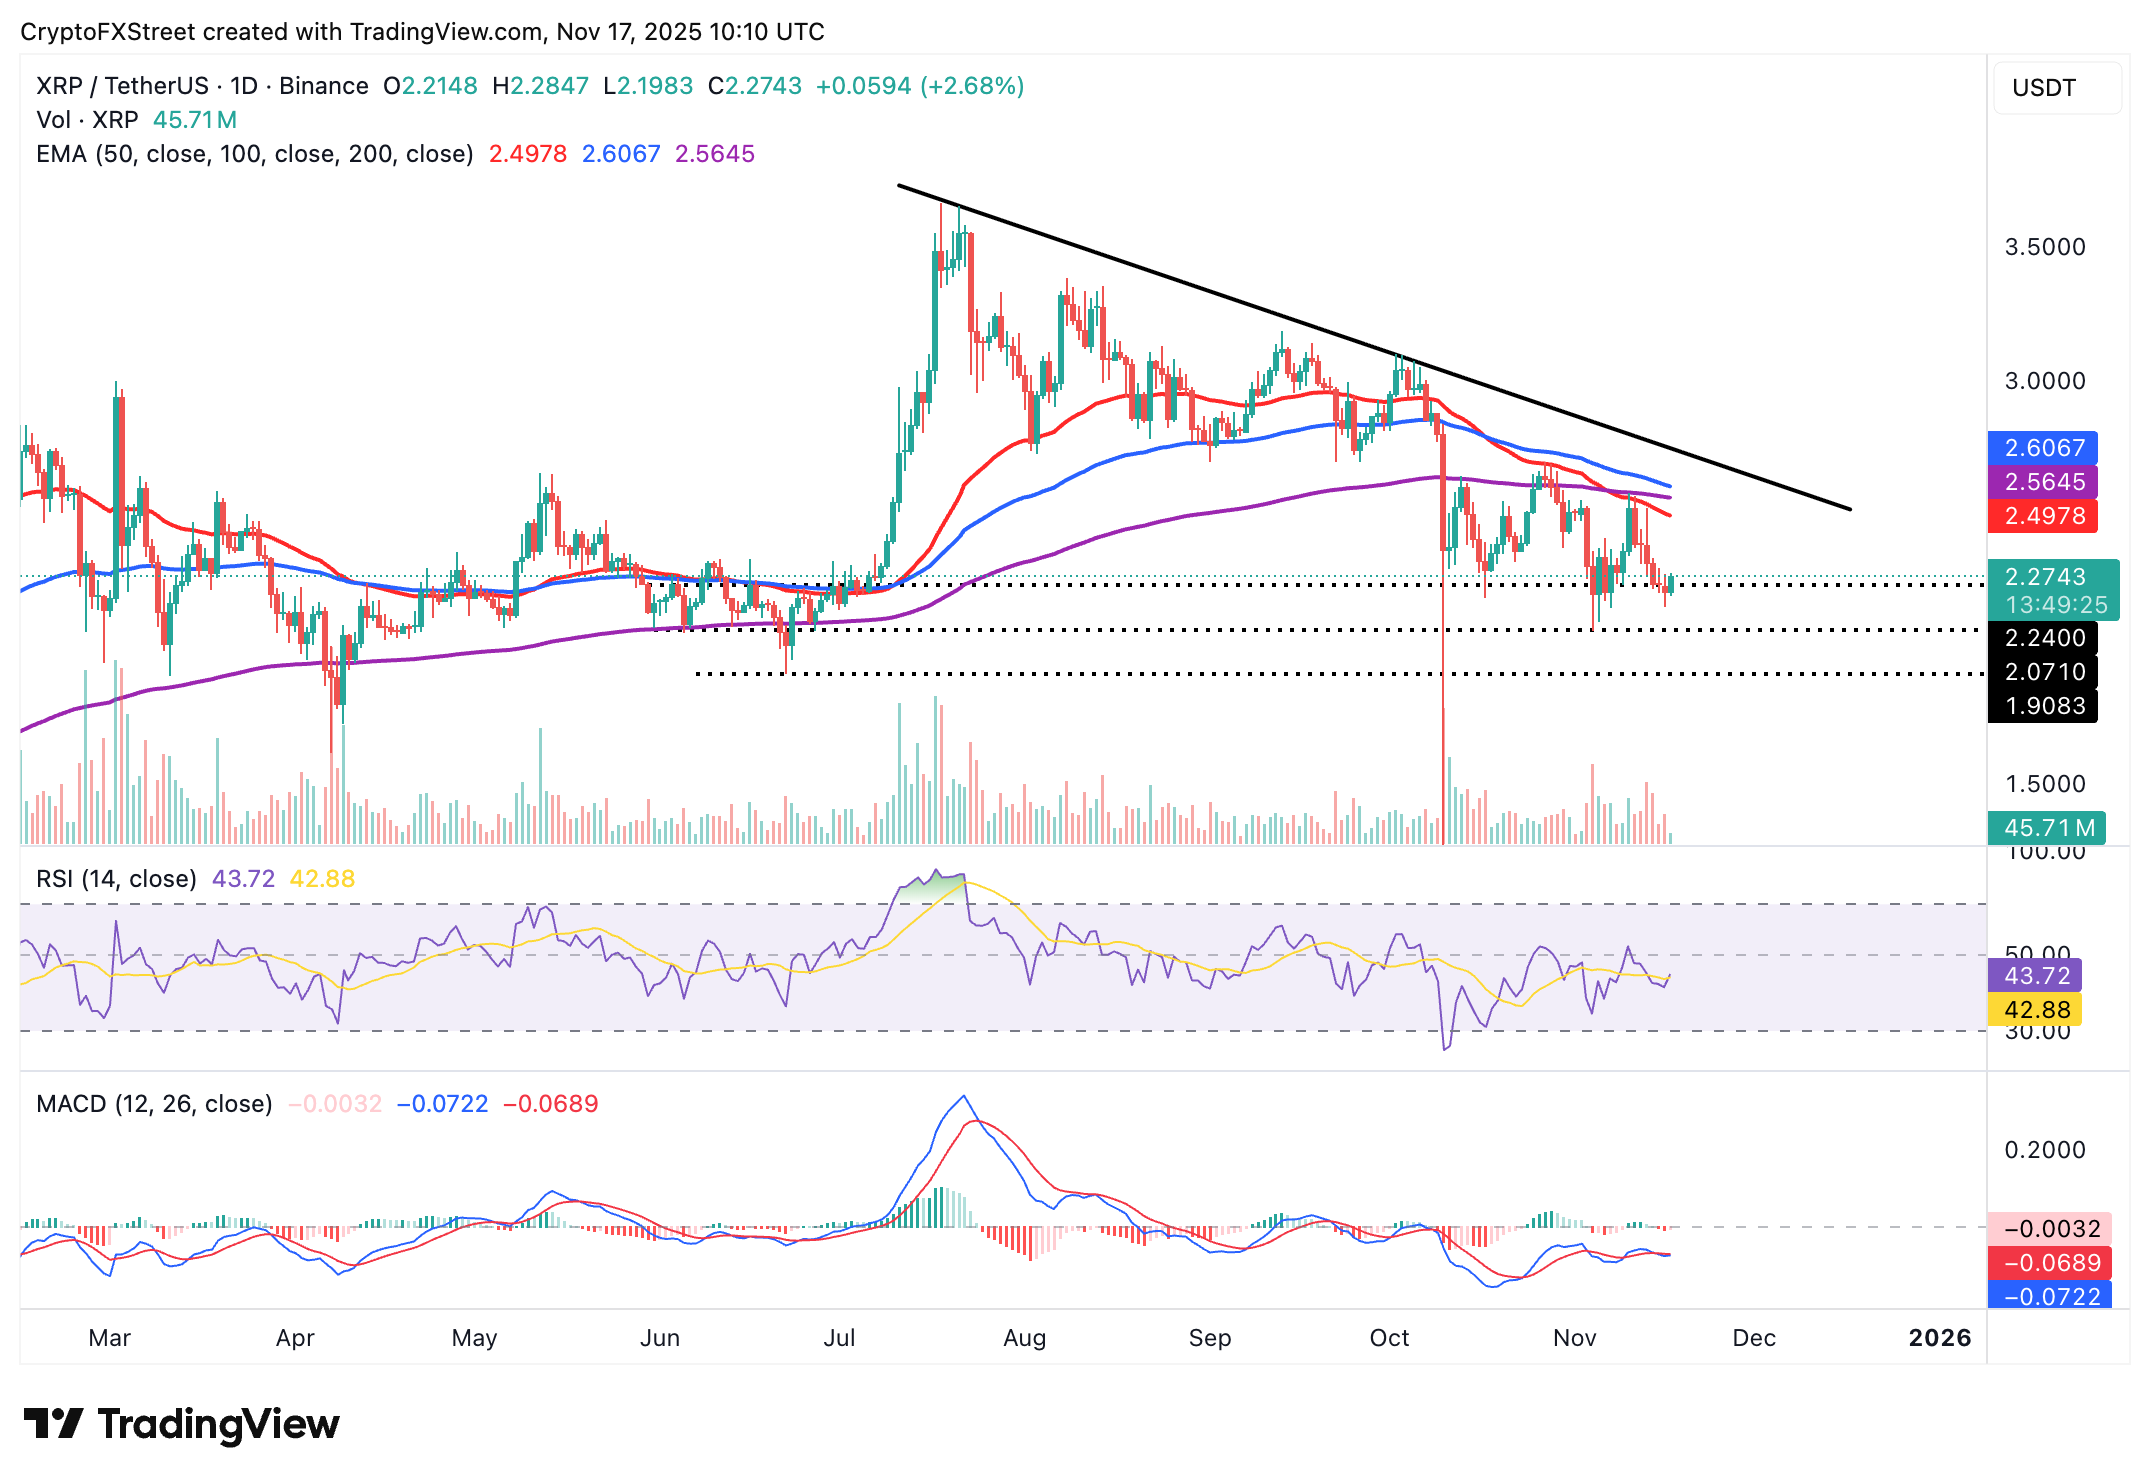
If traders book profits, the recovery would likely run out of steam, paving the way for a reversal targeting lows around $2.07, a support level tested on November 4.
Open Interest, funding rate FAQs
Higher Open Interest is associated with higher liquidity and new capital inflow to the market. This is considered the equivalent of increase in efficiency and the ongoing trend continues. When Open Interest decreases, it is considered a sign of liquidation in the market, investors are leaving and the overall demand for an asset is on a decline, fueling a bearish sentiment among investors.
Funding fees bridge the difference between spot prices and prices of futures contracts of an asset by increasing liquidation risks faced by traders. A consistently high and positive funding rate implies there is a bullish sentiment among market participants and there is an expectation of a price hike. A consistently negative funding rate for an asset implies a bearish sentiment, indicating that traders expect the cryptocurrency’s price to fall and a bearish trend reversal is likely to occur.

FXStreet
超過一百萬用戶依賴 FXStreet 獲取即時市場數據、圖表工具、專家洞見與外匯新聞。其全面的經濟日曆與教育網路研討會協助交易者保持資訊領先、做出審慎決策。FXStreet 擁有約 60 人的團隊,分布於巴塞隆納總部及全球各地。
Read More


