
Trade The World
EUR/JPY Price Forecast: Falls to near 173.00 after pulling back from 14-month highs
作者 Akhtar Faruqui
發布日期: 8 Sep 2025 | 修改日期: 8 Sep 2025


POPULAR ARTICLES

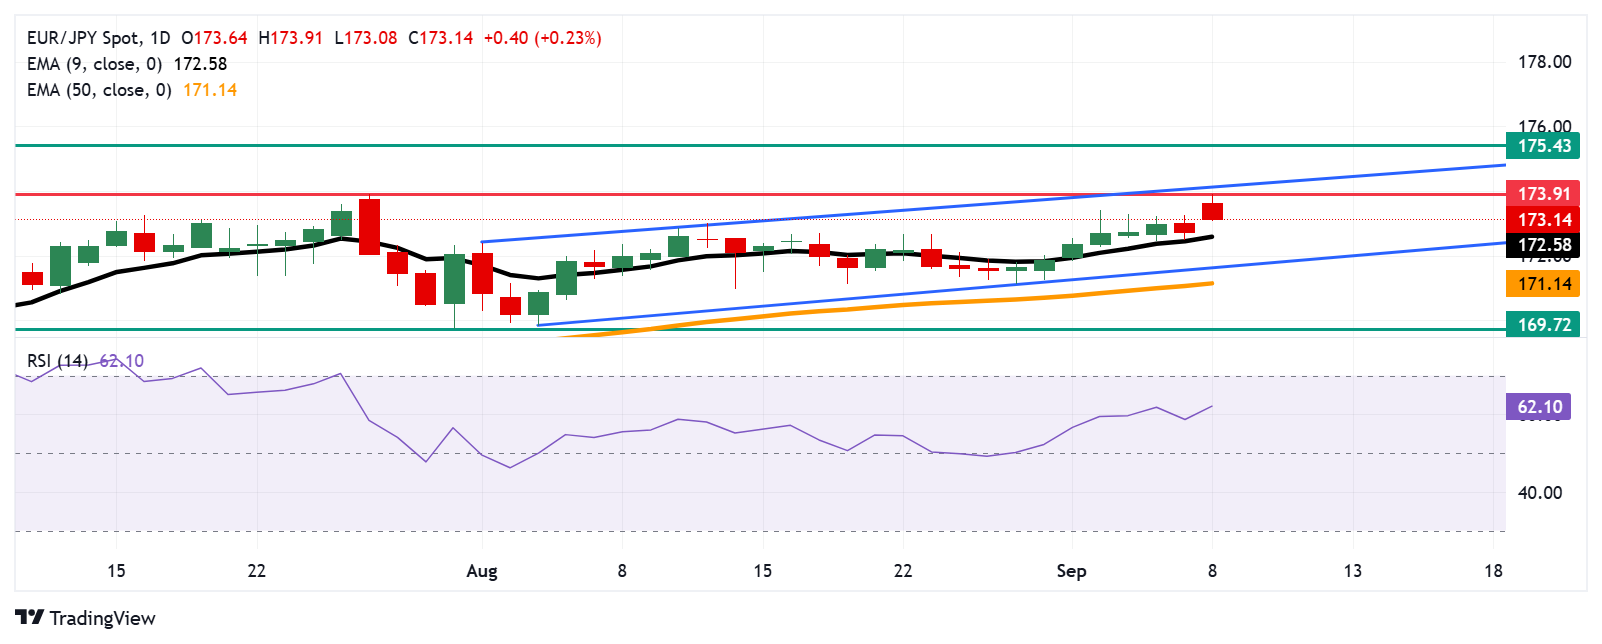
EUR/JPY loses ground after opening from a gap up, trading around 173.10 during the European hours on Monday. The technical analysis of the daily chart suggests a persistent bullish bias as the currency cross is moving upwards within the ascending channel pattern.
- EUR/JPY retreats after reaching 173.91, the highest since July 2024, on Monday.
- Bullish bias continues to strengthen as the 14-day Relative Strength Index remains above the 50 mark.
- The currency cross may find its immediate support at the psychological level of 173.00.
EUR/JPY loses ground after opening from a gap up, trading around 173.10 during the European hours on Monday. The technical analysis of the daily chart suggests a persistent bullish bias as the currency cross is moving upwards within the ascending channel pattern.
The 14-day Relative Strength Index (RSI) remains above the 50 mark, strengthening the bullish bias. Additionally, the short-term price momentum is stronger as the EUR/JPY cross rises above the nine-day Exponential Moving Average (EMA).
On the upside, the EUR/JPY cross may approach the 173.91, the highest since July 2024, recorded on September 8, followed by the upper boundary of the ascending channel around the 174.10. A break above this crucial resistance zone would strengthen the bullish bias and support the currency cross to approach the all-time high of 175.43, reached in July 2024.
The immediate support appears at the psychological level of 173.00, followed by the nine-day EMA at 172.58. A break below this level could weaken the short-term price momentum and prompt the EUR/JPY cross to test the ascending channel’s lower boundary around 171.70, followed by the 50-day EMA of 171.14.
Further declines below the confluence support zone would undermine medium-term price momentum and push the EUR/JPY cross toward the 10-week low of 169.72, last seen on July 31.
(The story was corrected on September 8 at 08:15 GMT, to say in the title, "pulling back from 14-month highs," not lows.)
EUR/JPY: Daily Chart
Euro Price Today
The table below shows the percentage change of Euro (EUR) against listed major currencies today. Euro was the weakest against the New Zealand Dollar.
| USD | EUR | GBP | JPY | CAD | AUD | NZD | CHF | |
|---|---|---|---|---|---|---|---|---|
| USD | -0.16% | -0.07% | -0.46% | -0.12% | -0.48% | -0.52% | -0.33% | |
| EUR | 0.16% | 0.09% | -0.23% | 0.04% | -0.30% | -0.31% | -0.17% | |
| GBP | 0.07% | -0.09% | -0.40% | -0.05% | -0.39% | -0.40% | -0.26% | |
| JPY | 0.46% | 0.23% | 0.40% | 0.27% | -0.04% | -0.21% | 0.16% | |
| CAD | 0.12% | -0.04% | 0.05% | -0.27% | -0.26% | -0.35% | -0.21% | |
| AUD | 0.48% | 0.30% | 0.39% | 0.04% | 0.26% | -0.01% | 0.14% | |
| NZD | 0.52% | 0.31% | 0.40% | 0.21% | 0.35% | 0.01% | 0.14% | |
| CHF | 0.33% | 0.17% | 0.26% | -0.16% | 0.21% | -0.14% | -0.14% |
The heat map shows percentage changes of major currencies against each other. The base currency is picked from the left column, while the quote currency is picked from the top row. For example, if you pick the Euro from the left column and move along the horizontal line to the US Dollar, the percentage change displayed in the box will represent EUR (base)/USD (quote).

FXStreet
超過一百萬用戶依賴 FXStreet 獲取即時市場數據、圖表工具、專家洞見與外匯新聞。其全面的經濟日曆與教育網路研討會協助交易者保持資訊領先、做出審慎決策。FXStreet 擁有約 60 人的團隊,分布於巴塞隆納總部及全球各地。
Read More


