
Trade The World
GBP/JPY Price Analysis: Pulls back below 211, momentum shifts bearish
作者 Christian Borjon Valencia
發布日期: 8 Jan 2026 | 修改日期: 8 Jan 2026


POPULAR ARTICLES

The GBP/JPY retreated for the second consecutive day on Wednesday after hitting a yearly high of 212.16 on Tuesday, dives below 211.00 and posted losses of 0.27%. As Thursday’s Asian session begins, the pair trades unchanged at 210.85.
- GBP/JPY slips for a second day after peaking at 212.16, pressured by weaker global equity markets.
- RSI rolls over toward 60, signaling fading bullish momentum and raising retracement risks.
- A break below 210.00 targets 208.95 and the 50-day SMA, while 211.00 caps near-term upside.
The GBP/JPY retreated for the second consecutive day on Wednesday after hitting a yearly high of 212.16 on Tuesday, dives below 211.00 and posted losses of 0.27%. As Thursday’s Asian session begins, the pair trades unchanged at 210.85.
A scarce economic docket in Japan and the UK, leaves traders adrift to geopolitical developments and risk appetite. A fall in global equity markets on Wednesday undermined the GBP/JPY, which is so far down 0.12% in the year.
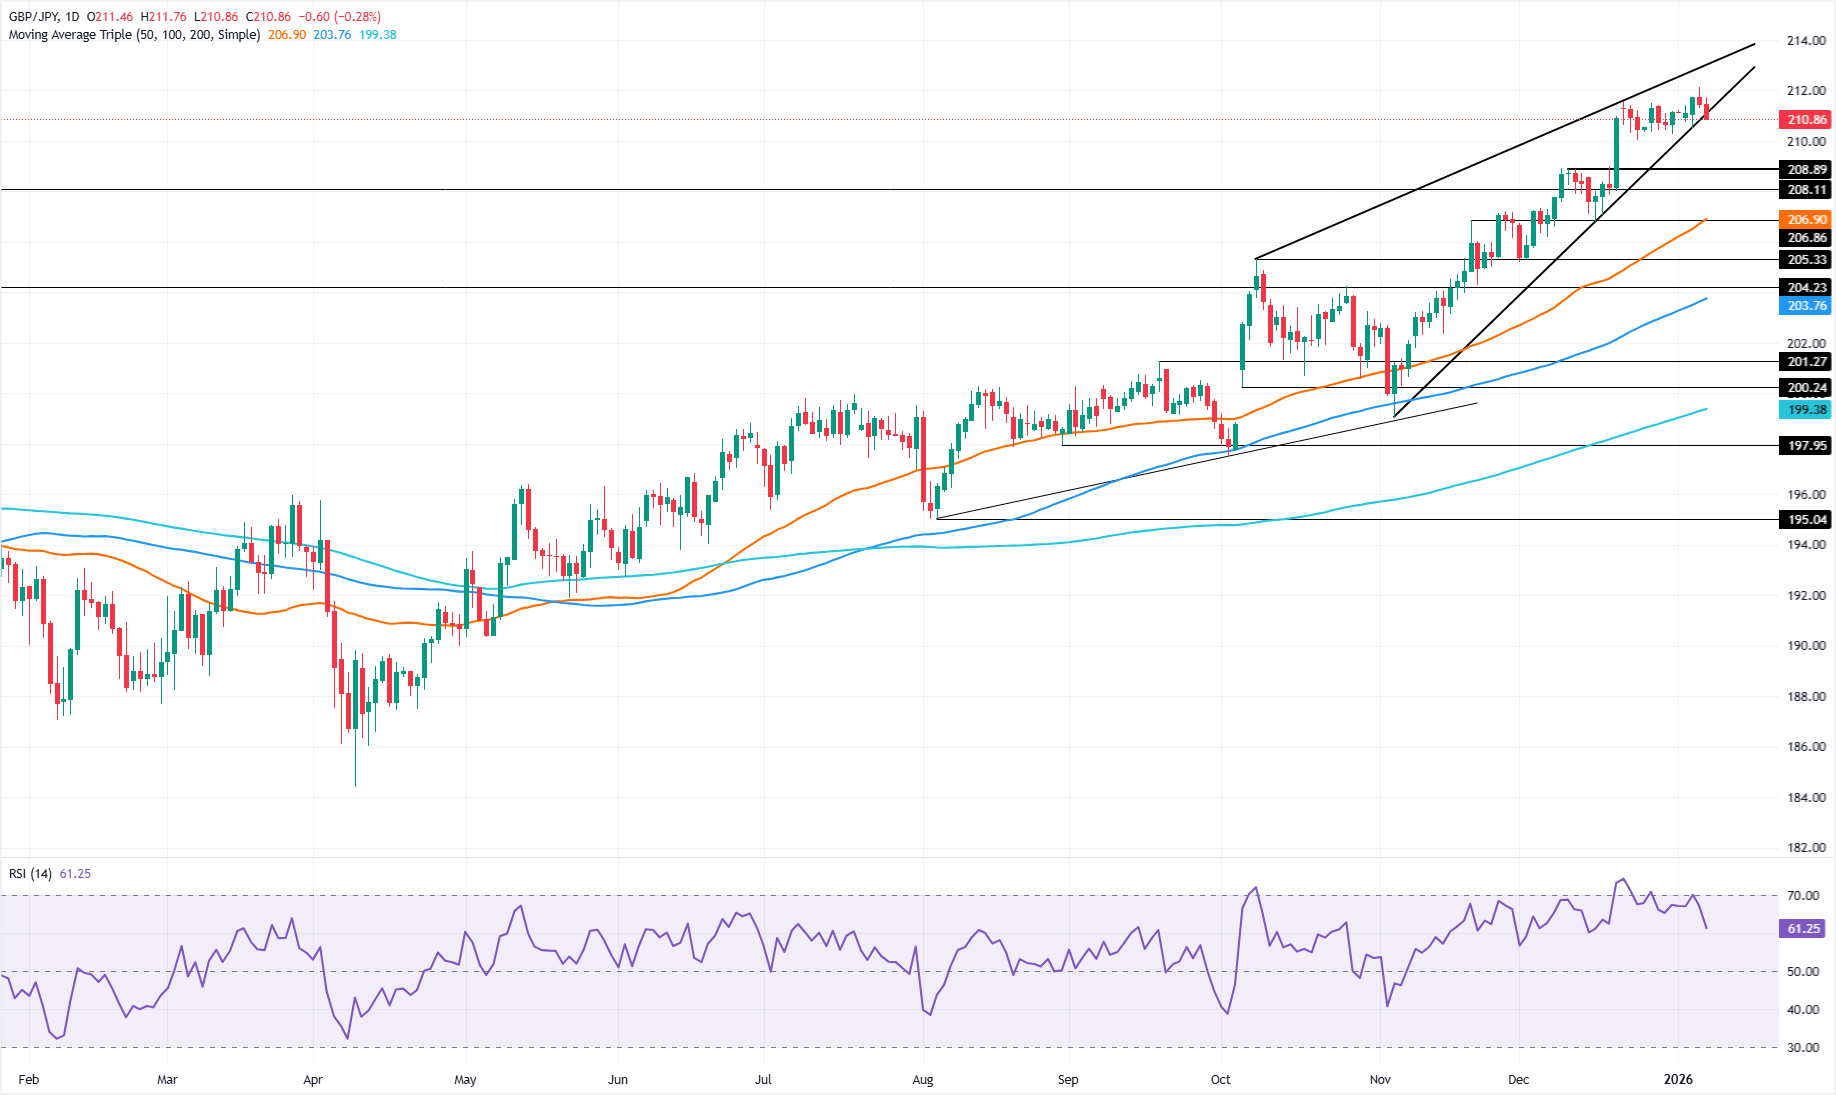
GBP/JPY Price Analysis: technical outlook
The GBP/JPY technical picture remains constructive, but a sudden momentum shifts as depicted by the Relative Strength Index (RSI) suggests that a retracement is on the cards.
The RSI from being around 70 it is closing to 60, an indication of bulls losing strength.
With that said, if GBP/JPY clears the December 24 low of 210.06, a drop below 210.00 is likely and would exacerbate a test of December 9 swing high turned support at 208.95. A breach of the latter will expose the 50-day SMA at 206.74.
On the bullish front, if the cross-pair aims above 211.00, bulls could push the exchange rate towards the 212.00 mark.S
GBP/JPY Price Chart – Daily
Japanese Yen Price This week
The table below shows the percentage change of Japanese Yen (JPY) against listed major currencies this week. Japanese Yen was the strongest against the Canadian Dollar.
| USD | EUR | GBP | JPY | CAD | AUD | NZD | CHF | |
|---|---|---|---|---|---|---|---|---|
| USD | 0.41% | 0.06% | -0.11% | 0.84% | -0.66% | -0.22% | 0.67% | |
| EUR | -0.41% | -0.36% | -0.44% | 0.41% | -1.09% | -0.63% | 0.25% | |
| GBP | -0.06% | 0.36% | -0.17% | 0.79% | -0.74% | -0.28% | 0.61% | |
| JPY | 0.11% | 0.44% | 0.17% | 0.90% | -0.60% | -0.16% | 0.78% | |
| CAD | -0.84% | -0.41% | -0.79% | -0.90% | -1.33% | -1.05% | -0.17% | |
| AUD | 0.66% | 1.09% | 0.74% | 0.60% | 1.33% | 0.43% | 1.34% | |
| NZD | 0.22% | 0.63% | 0.28% | 0.16% | 1.05% | -0.43% | 0.90% | |
| CHF | -0.67% | -0.25% | -0.61% | -0.78% | 0.17% | -1.34% | -0.90% |
The heat map shows percentage changes of major currencies against each other. The base currency is picked from the left column, while the quote currency is picked from the top row. For example, if you pick the Japanese Yen from the left column and move along the horizontal line to the US Dollar, the percentage change displayed in the box will represent JPY (base)/USD (quote).

FXStreet
超過一百萬用戶依賴 FXStreet 獲取即時市場數據、圖表工具、專家洞見與外匯新聞。其全面的經濟日曆與教育網路研討會協助交易者保持資訊領先、做出審慎決策。FXStreet 擁有約 60 人的團隊,分布於巴塞隆納總部及全球各地。
Read More


