
Trade The World
Litecoin Price Forecast: LTC eyes $135 as spot ETF launch on Nasdaq boosts bullish momentum
作者 Manish Chhetri
發布日期: 28 Oct 2025 | 修改日期: 28 Oct 2025


POPULAR ARTICLES

Litecoin (LTC) price hovers around $99 at the time of writing on Tuesday, after rallying 7% in the previous week. LTC’s spot Exchange Traded Fund (ETF) is set to debut on Nasdaq on Tuesday, sparking renewed investor interest and fueling bullish momentum.
- Litecoin price hovers around $99 on Tuesday, nearing a key psychological level.
- Bullish sentiment builds ahead of the spot Litecoin ETF launch on Nasdaq, set for Tuesday under the ticker LTCC.
- On-chain data paints a positive outlook, with transaction volume hitting its highest level since June 2023 and social dominance on the rise.
Litecoin (LTC) price hovers around $99 at the time of writing on Tuesday, after rallying 7% in the previous week. LTC’s spot Exchange Traded Fund (ETF) is set to debut on Nasdaq on Tuesday, sparking renewed investor interest and fueling bullish momentum. Moreover, on-chain data support a bullish outlook, as transaction volumes are at their highest levels since mid-2023 and social engagement around Litecoin is surging.
Litecoin Spot ETF sets to debut on Tuesday
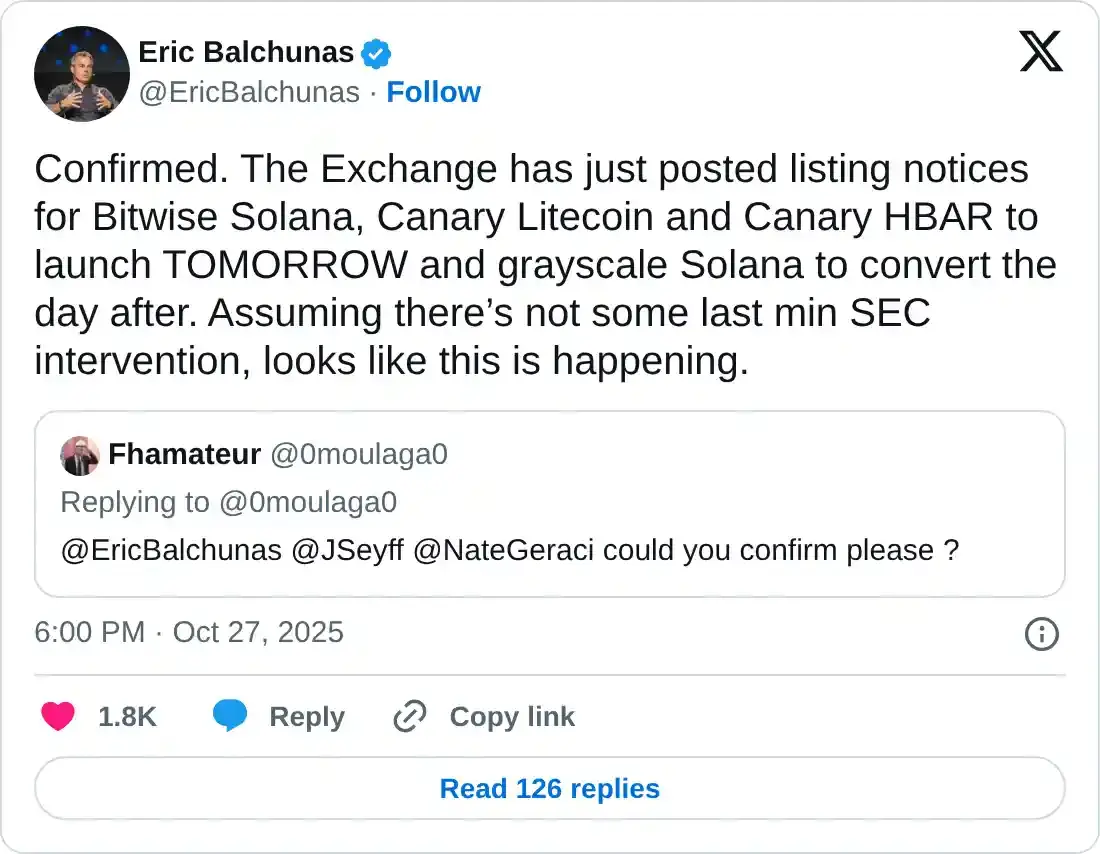
Eric Balchunas, Senior ETF Analyst for Bloomberg, confirmed on his X post on Monday that the exchange has just posted listing notices for Bitwise Solana, Canary Litecoin, and Canary HBAR, all set to launch on Tuesday.
Balchunas continued, “Assuming there’s not some last-minute SEC intervention, it looks like this is happening.”
If approved on Tuesday, this ETF would mark a significant milestone for Litecoin. Moreover, it is bullish on its native token, LTC, in the long term, as it allows investors to gain exposure without directly holding LTC while also enhancing liquidity, legitimacy, and overall adoption.
Litecoin’s on-chain data shows bullish bias
Santiment data shows that Litecoin’s transaction volume rose from $127.31 million on October 18 to $157.94 million on Monday, the highest since June 2023. This rising transaction volume indicates a recent surge in traders’ interest and liquidity in the LTC chain, which bodes well for its price.
 [08-1761623057930-1761623057933.54.37, 28 Oct, 2025].png)
LTC transaction volume chart. Source: Santiment
Another factor bolstering the platform’s bullish outlook is surging social engagement around Litecoin, signaling growing market enthusiasm.
 [07-1761623074160-1761623074162.45.04, 28 Oct, 2025].png)
Litecoin Price Forecast: LTC could rally if it closes above $104 mark
Litecoin price broke above the weekly resistance level at $96.30 on Saturday and rose 3.15% the next day. However, on Monday, LTC faced a slight rejection from the 200-day Exponential Moving Average (EMA) at $103.13. At the time of writing on Tuesday, it hovers at around $99.78.
If LTC breaks above the 200-day EMA and closes above $104 level, it could extend the rally towards the October 10 high of $135.99.
The Relative Strength Index (RSI) on the daily chart is 48, near its neutral level of 50, suggesting fading bearish momentum. For the bullish momentum to be sustained, the RSI must move above the neutral level. Moreover, the Moving Average Convergence Divergence (MACD) indicator showed a bullish crossover on Saturday, providing a buy signal and supporting a bullish view.
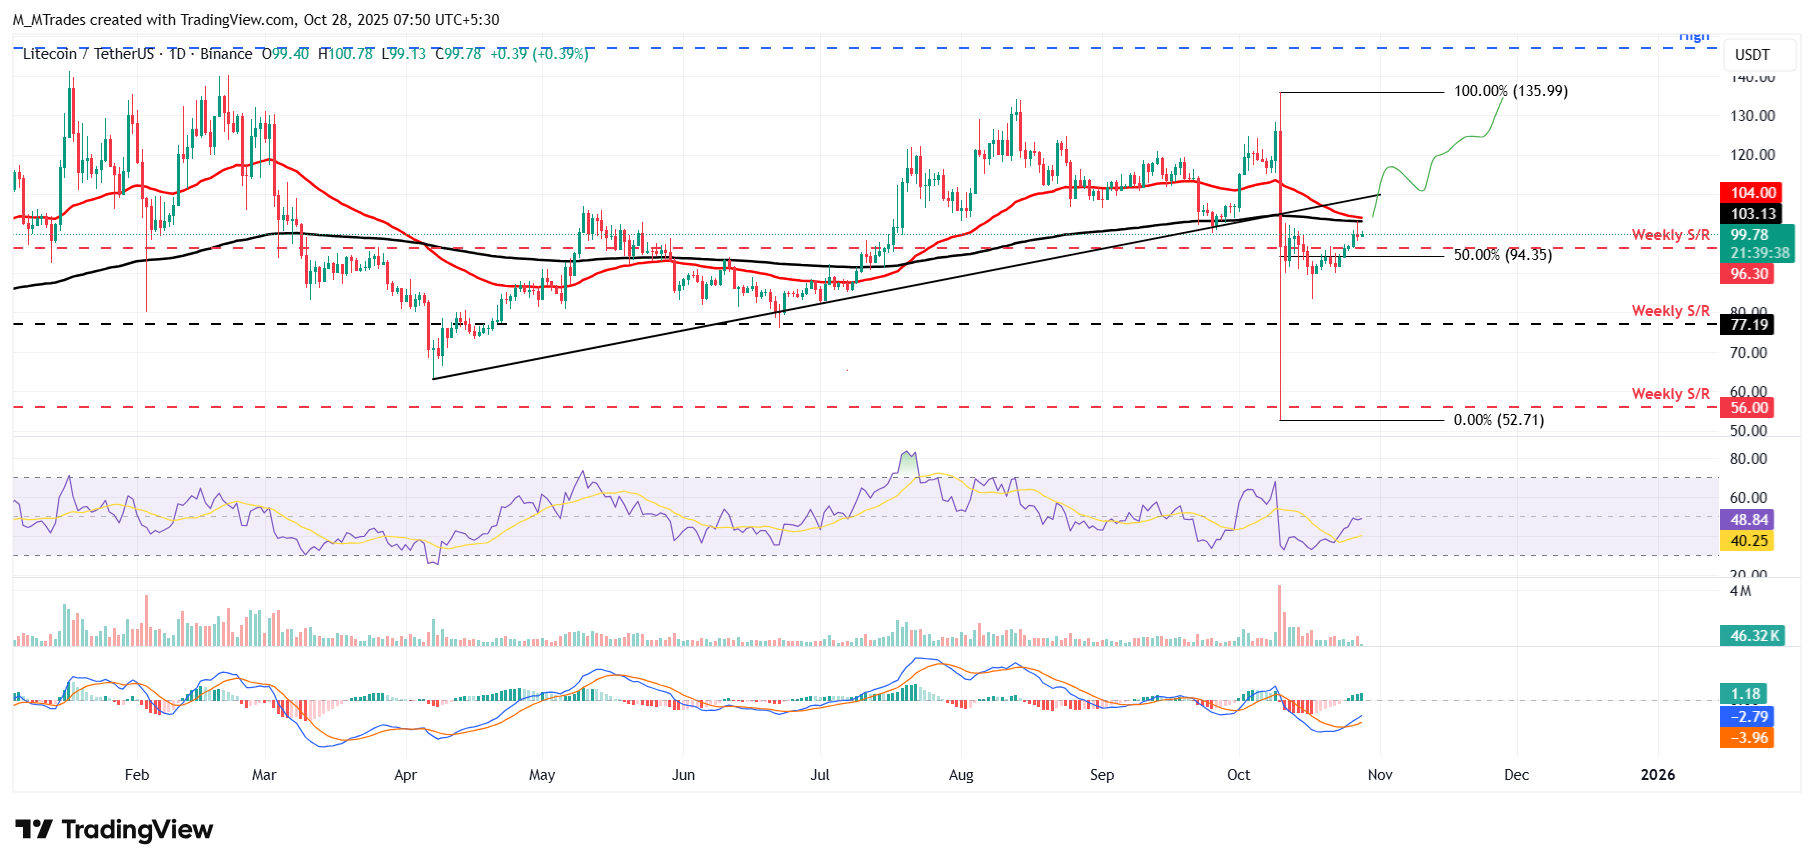
LTC/USDT daily chart
On the other hand, if LTC faces a correction, it could extend the decline toward the weekly support at $96.30.

FXStreet
超過一百萬用戶依賴 FXStreet 獲取即時市場數據、圖表工具、專家洞見與外匯新聞。其全面的經濟日曆與教育網路研討會協助交易者保持資訊領先、做出審慎決策。FXStreet 擁有約 60 人的團隊,分布於巴塞隆納總部及全球各地。
Read More


