
Trade The World
Maple Finance Price Forecast: SYRUP extends gains as monthly revenue hits record high
作者 Vishal Dixit
發布日期: 9 Jan 2026 | 修改日期: 9 Jan 2026


POPULAR ARTICLES
Maple Finance (SYRUP) is up by 2% at press time on Friday, rising above the 200-day Exponential Moving Average (EMA) at $0.3853. The lending protocol’s revenue hit a record high of $2.49 million in December, underscoring accelerated adoption and user demand.
- SYRUP is up over 2% so far on Friday, extending gains above the 200-day EMA.
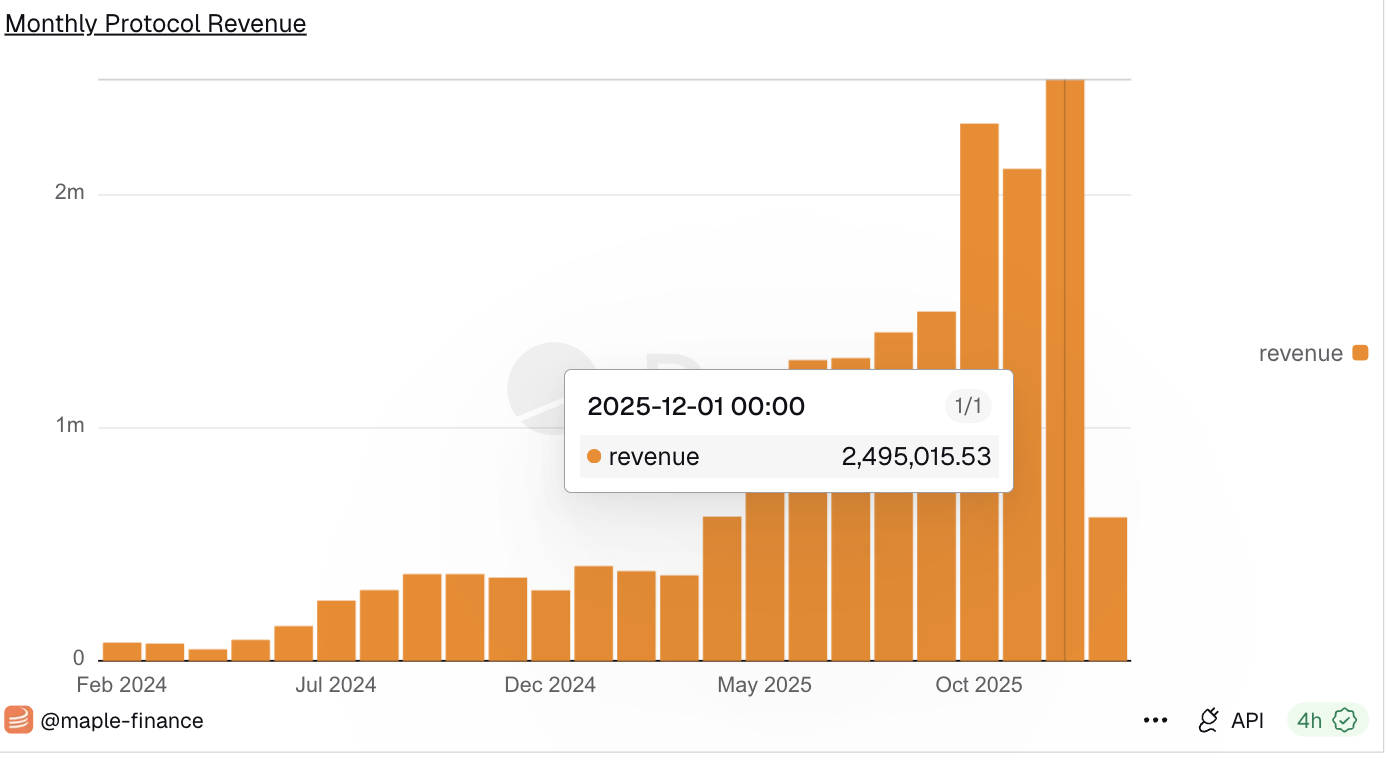
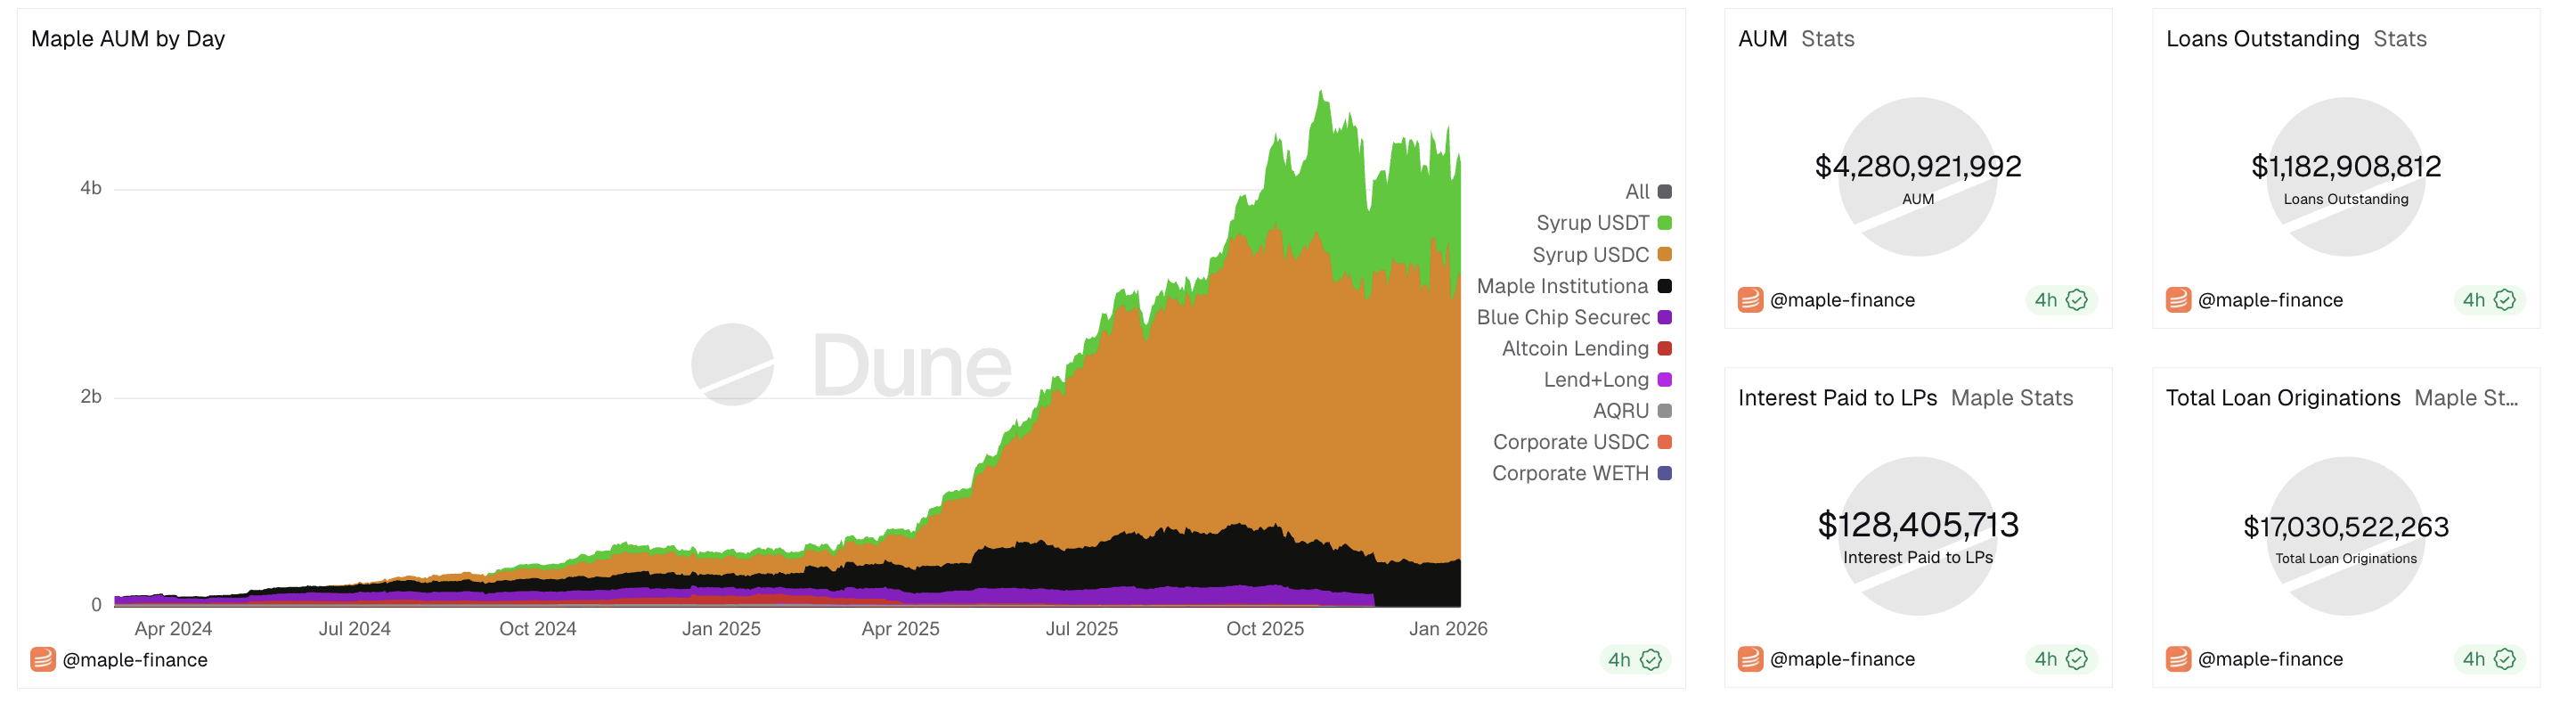
- Maple Finance hit a record-high revenue of $2.49 million in December, while AUM remains above $4.28 billion.
- The technical outlook is still bullish as trend momentum stabilizes.
Maple Finance (SYRUP) is up by 2% at press time on Friday, rising above the 200-day Exponential Moving Average (EMA) at $0.3853. The lending protocol’s revenue hit a record high of $2.49 million in December, underscoring accelerated adoption and user demand. The technical outlook for SYRUP points to further gains as the momentum indicators signal a stable upward trend.
Maple Finance revenue surges as ecosystem expands
Maple Finance's revenue, mainly collected from lending fees and yield optimization, reached a record high of $2.49 million in December. A steady inflow of revenue in 2025 exceeded $15 million in total, indicating a surge in market adoption, particularly from financial institutions.
Meanwhile, the protocol’s Asset Under Management (AUM) exceeds $4.28 billion, with outstanding loan balances of $1.18 billion. This expansion in AUM and revenue highlights the growth of Maple Finance’s ecosystem, which could translate to higher demand for its native token, SYRUP.
SYRUP prepares for extended rally
SYRUP extends gains above the 200-day EMA at $0.3853 by 2% at press time on Friday, amounting to nearly 6% so far this week. This marks the second week of gains following last week's 14% recovery.
The lending protocol’s token struggles to continue its recovery above the $0.4000 round figure, which recently capped Tuesday’s surge. Still, a decisive close above this level could target the R2 Pivot Point at $0.4297, followed by the R3 Pivot Point at $0.4991.
The technical indicators on the daily chart flash mixed signals amid the ongoing rally. The Relative Strength Index (RSI) is at 67, rising toward the overbought zone, suggesting heightened buying pressure. At the same time, the Average Directional Index (ADX) indicator turns flat around 28, indicating that the trend is stabilizing.
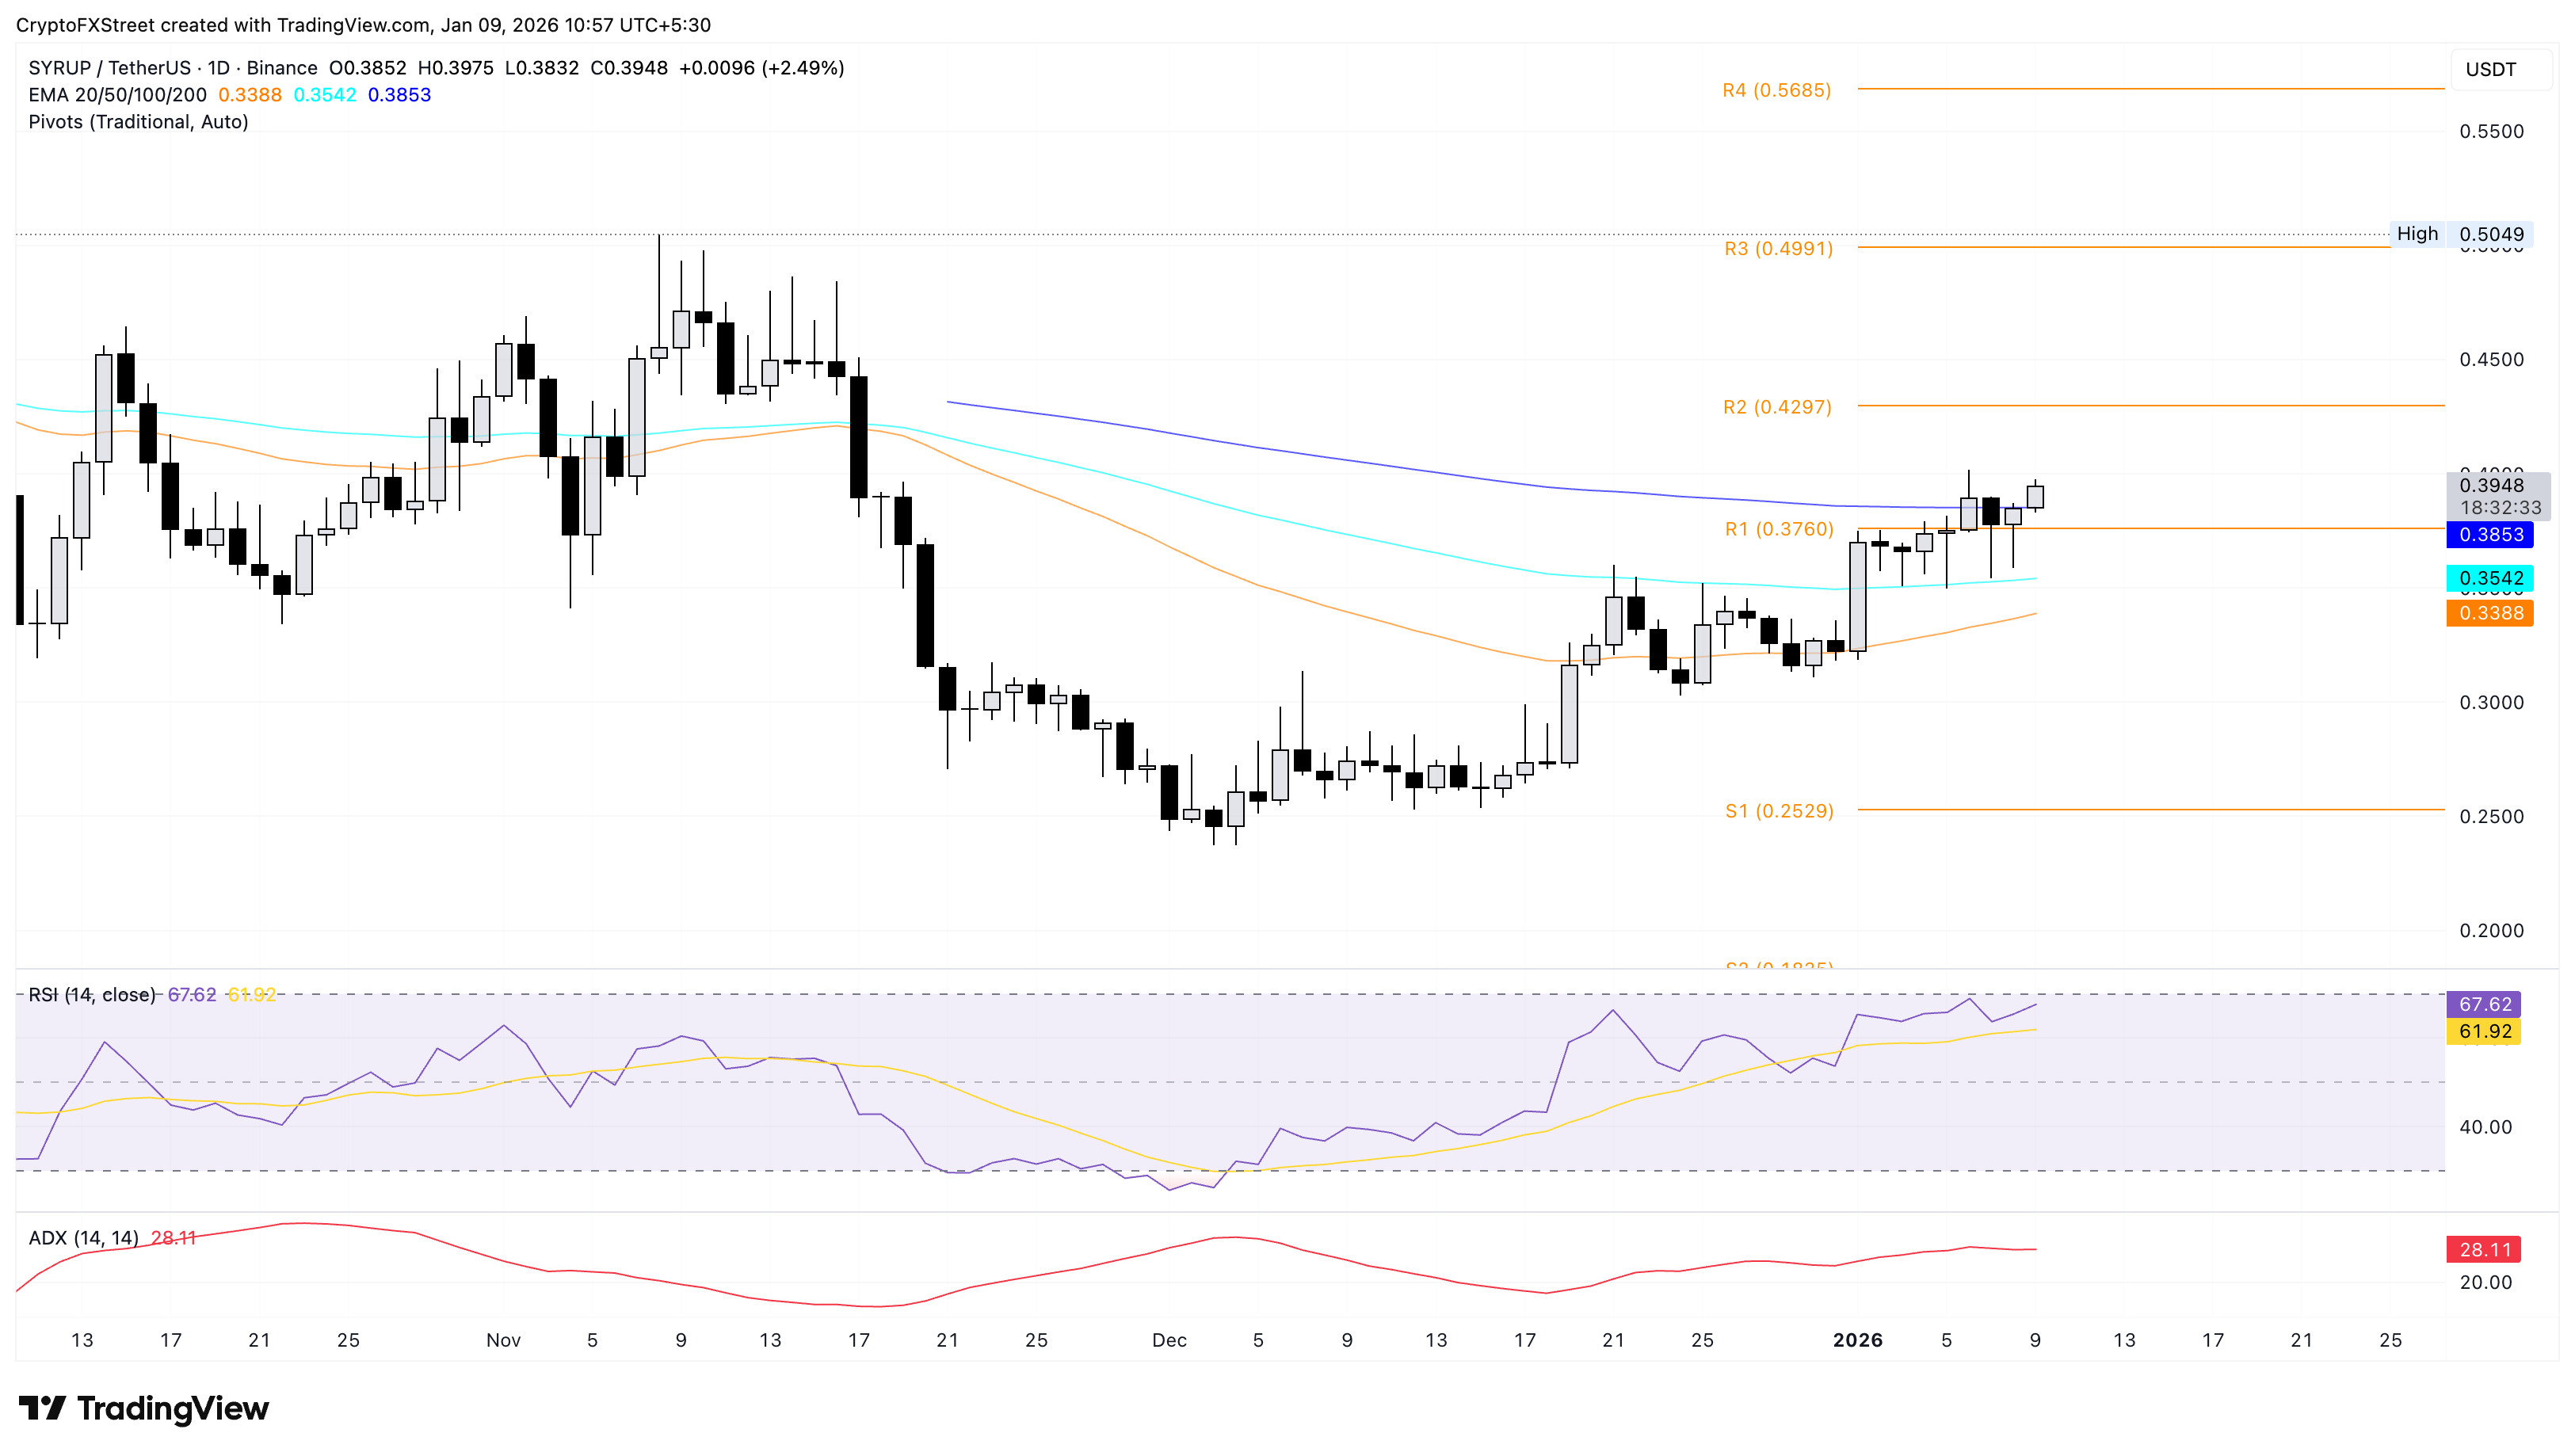
Looking down, if SYRUP dips below the R1 Pivot Point at $0.3760, which is roughly close to the 200-day EMA at $0.3853, the 100-day and 50-day EMAs at $0.3542 and $0.3388 could serve as support levels.

FXStreet
超過一百萬用戶依賴 FXStreet 獲取即時市場數據、圖表工具、專家洞見與外匯新聞。其全面的經濟日曆與教育網路研討會協助交易者保持資訊領先、做出審慎決策。FXStreet 擁有約 60 人的團隊,分布於巴塞隆納總部及全球各地。
Read More


