
Trade The World
Meme Coins Price Prediction: Dogecoin, Shiba Inu, and Pepe tank as whale interest fades
作者 Vishal Dixit
發布日期: 3 Nov 2025 | 修改日期: 3 Nov 2025


POPULAR ARTICLES

Meme coins, such as Dogecoin (DOGE), Shiba Inu (SHIB), and Pepe (PEPE), are at bearish crossroads, facing further losses. Both on-chain and derivatives data suggest that large wallet investors and retailers are reducing their risk exposure, boosting the supply pressure.
- Dogecoin risks further losses as retail interest wanes, and whales remain muted.
- Shiba Inu loses retail and whale support, risking a key support breakdown.
- Pepe is down 7% on Monday as key moving averages extend the declining trend.
Meme coins, such as Dogecoin (DOGE), Shiba Inu (SHIB), and Pepe (PEPE), are at bearish crossroads, facing further losses. Both on-chain and derivatives data suggest that large wallet investors and retailers are reducing their risk exposure, boosting the supply pressure.
Declining interest in meme coins
The retail interest in meme coins is low, as their speculative nature often leads to massive volatility during market corrections. CoinGlass data shows the futures Open Interest (OI), the notional value of all outstanding futures contracts, is down by 2%, 7% and 8%, respectively, in DOGE, SHIB, and PEPE over the last 24 hours, reaching $1.70 billion, $77.80 million, and $227.45 million. A decline in this notional value suggests that the traders are reducing risk exposure by lowering leverage or closing positions.
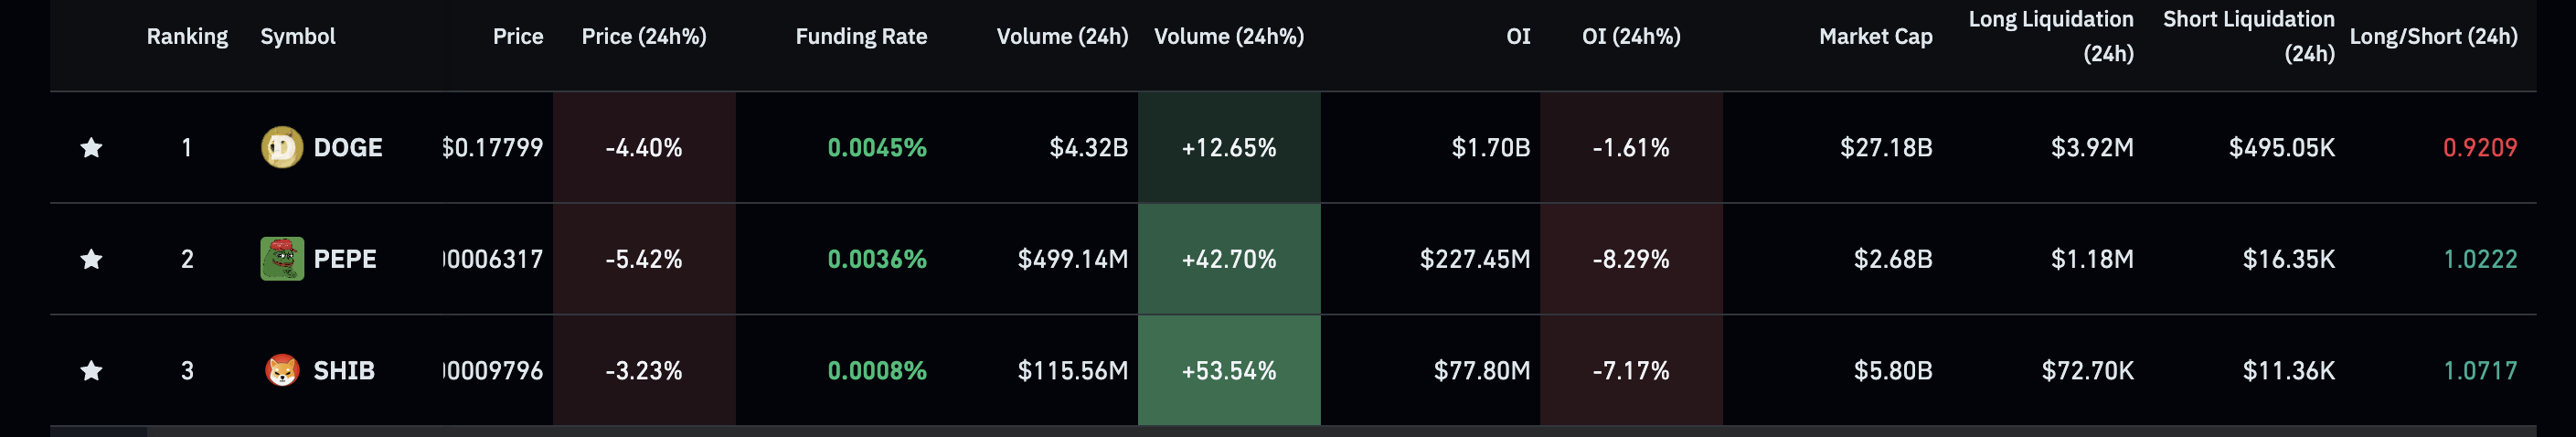
Meme coins derivatives data. Source: CoinGlass
On the other hand, on-chain data indicate that the interest of large wallet investors, commonly referred to as whales, is waning in meme coins. Santiment data shows that DOGE investors with over 100 million tokens have remained muted since November 1, resulting in a flat line.
On a more negative note, a declining trend in the SHIB and PEPE whale holdings, with 100 million to 1 billion tokens, indicates intense supply pressure.
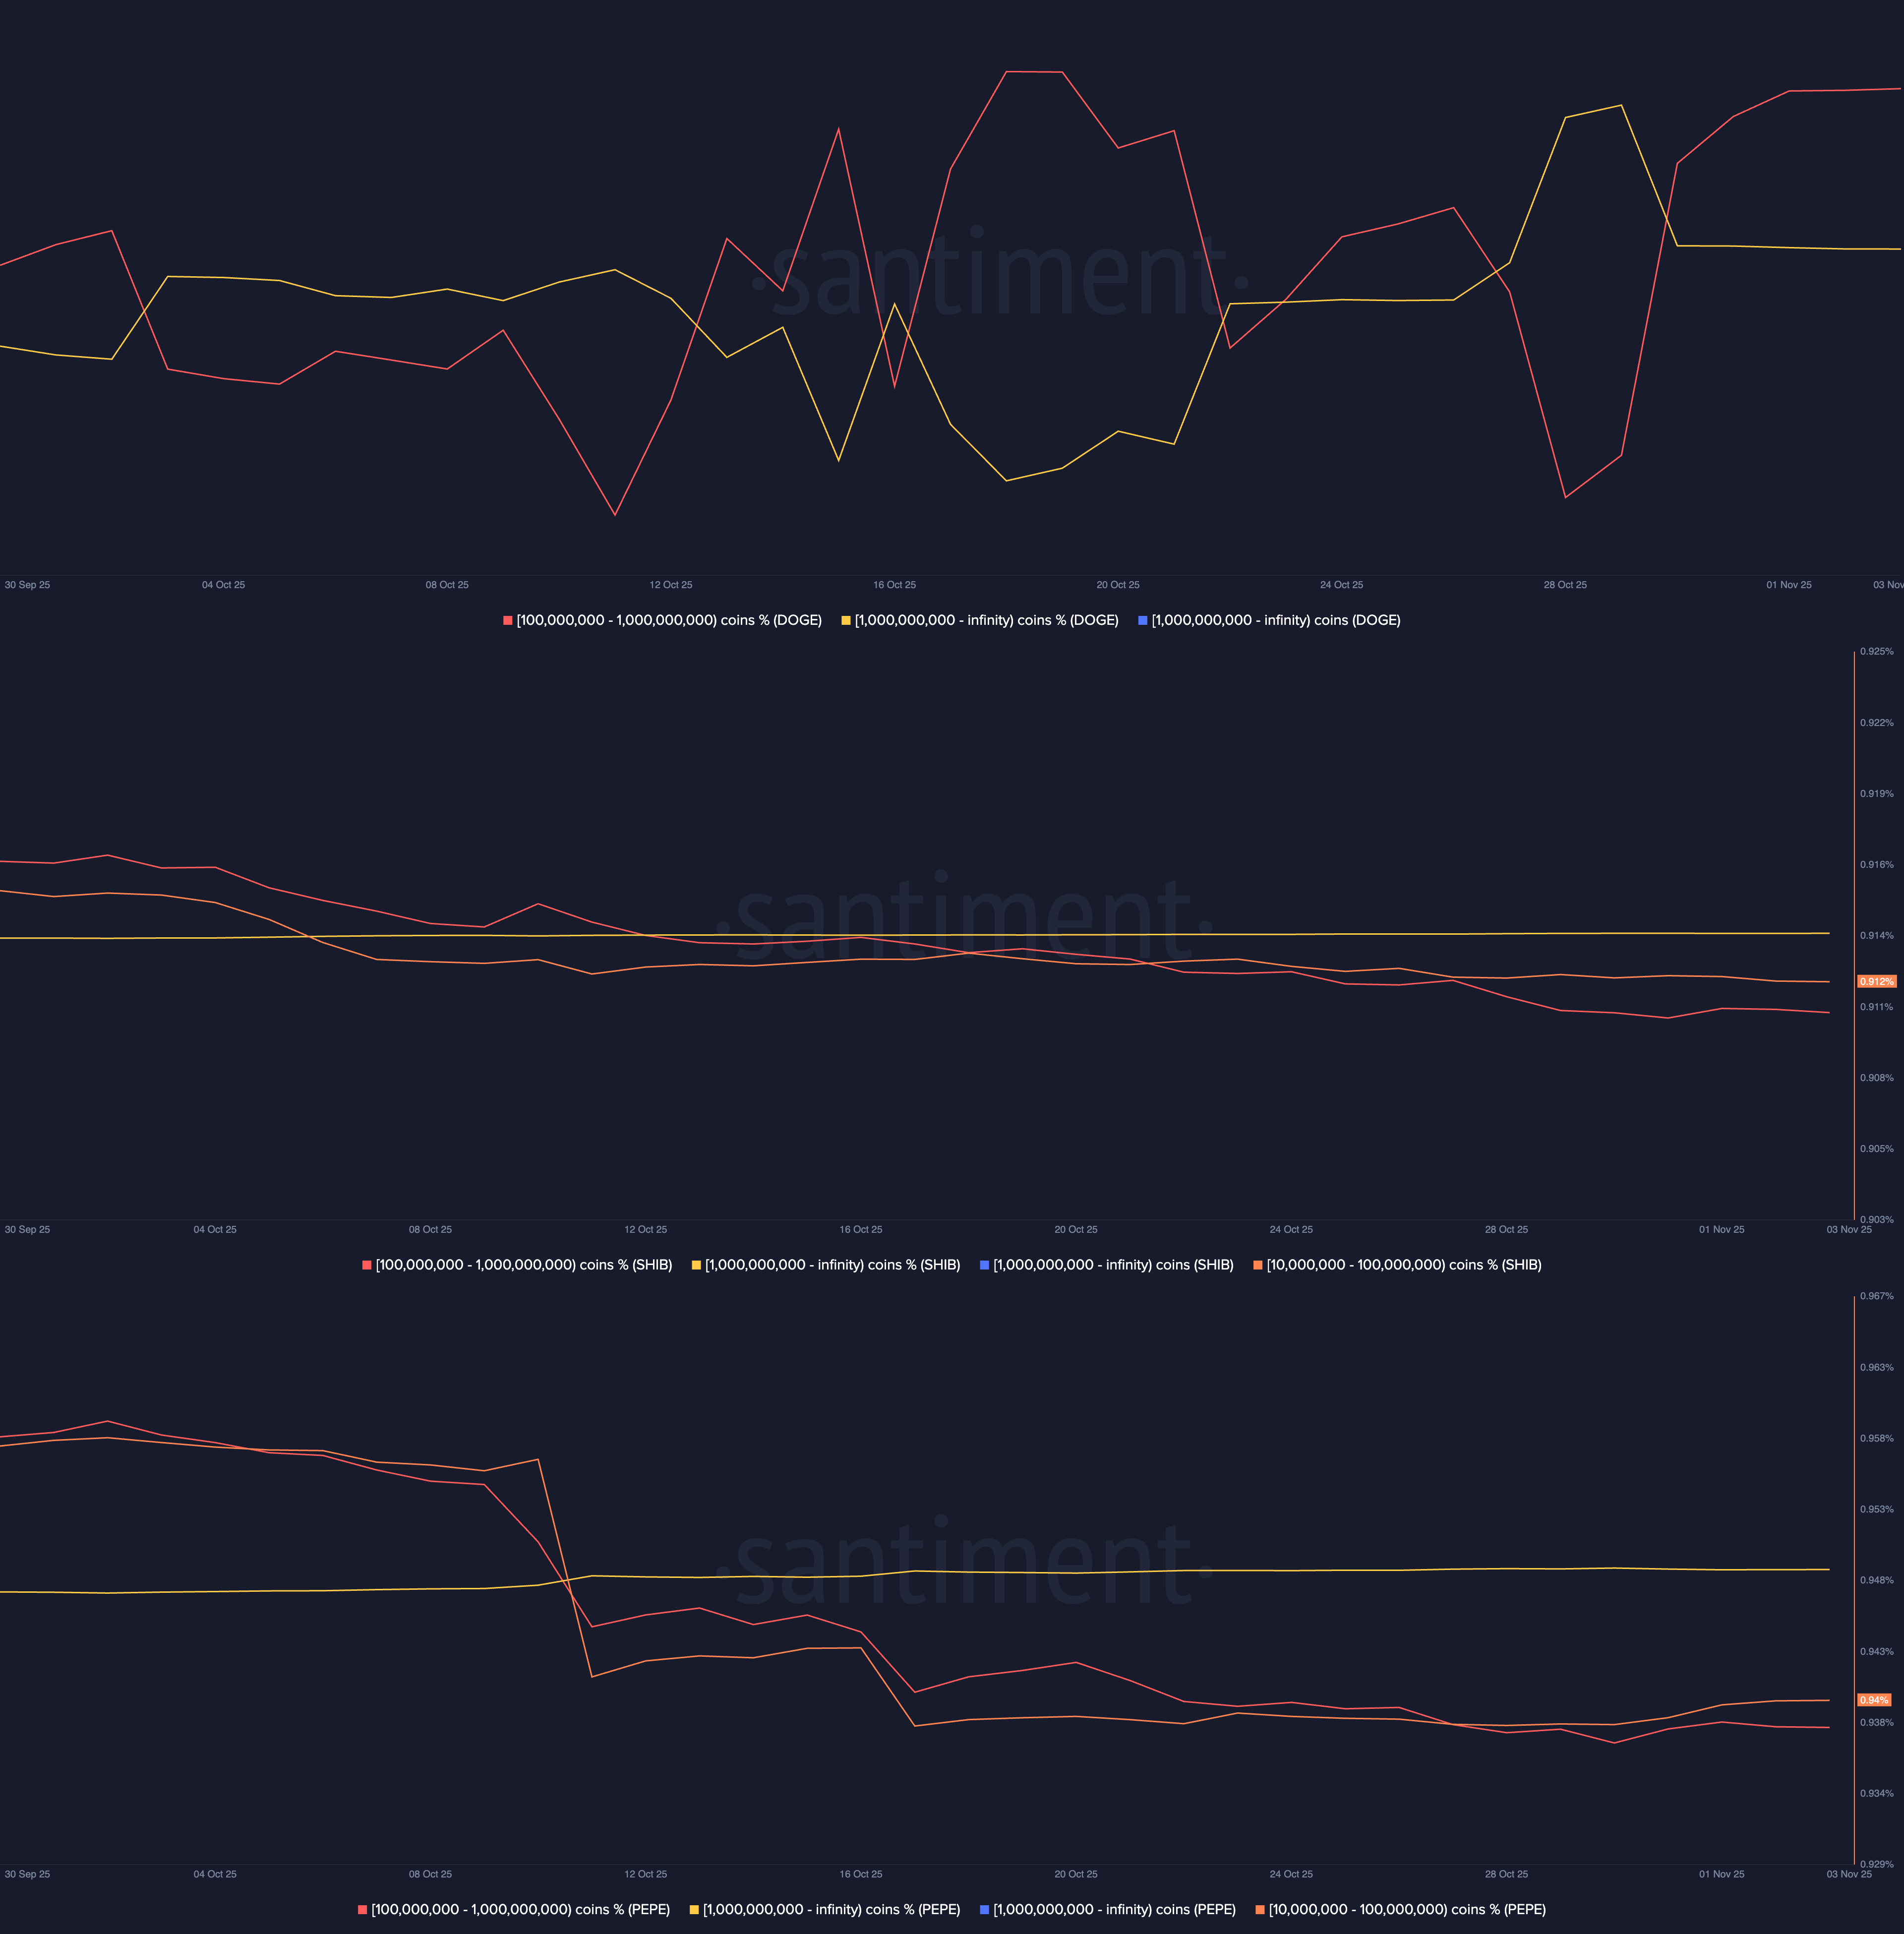
Meme coins supply distribution. Source: Santiment.
Dogecoin risks fracturing the key monthly support
Dogecoin drops over 4% at press time on Monday, trading below the $0.18000 level. The DOGE buyers struggle to hold the crashing prices at the $0.17816 support level, marked by the October 11 low.
A decisive close below this level could extend the decline to the $0.15704 level, marked by the June 27 low.
Corroborating a bearish shift in Dogecoin price trend, an impending bearish crossover between the 100-day and 200-day Exponential Moving Averages (EMAs) follows the recent Death Cross pattern between the 50-day and 200-day EMAs. A potential bearish crossover would confirm a bearish trend in motion.
The momentum indicators on the daily chart suggest a decline in buying pressure as the Moving Average Convergence Divergence (MACD) approaches the signal line. If the MACD blue crosses below the red line, it would signal renewed selling pressure.
At the same time, the Relative Strength Index (RSI) is at 36, lowering towards the oversold zone. The further space before reaching the oversold zone indicates downside potential.
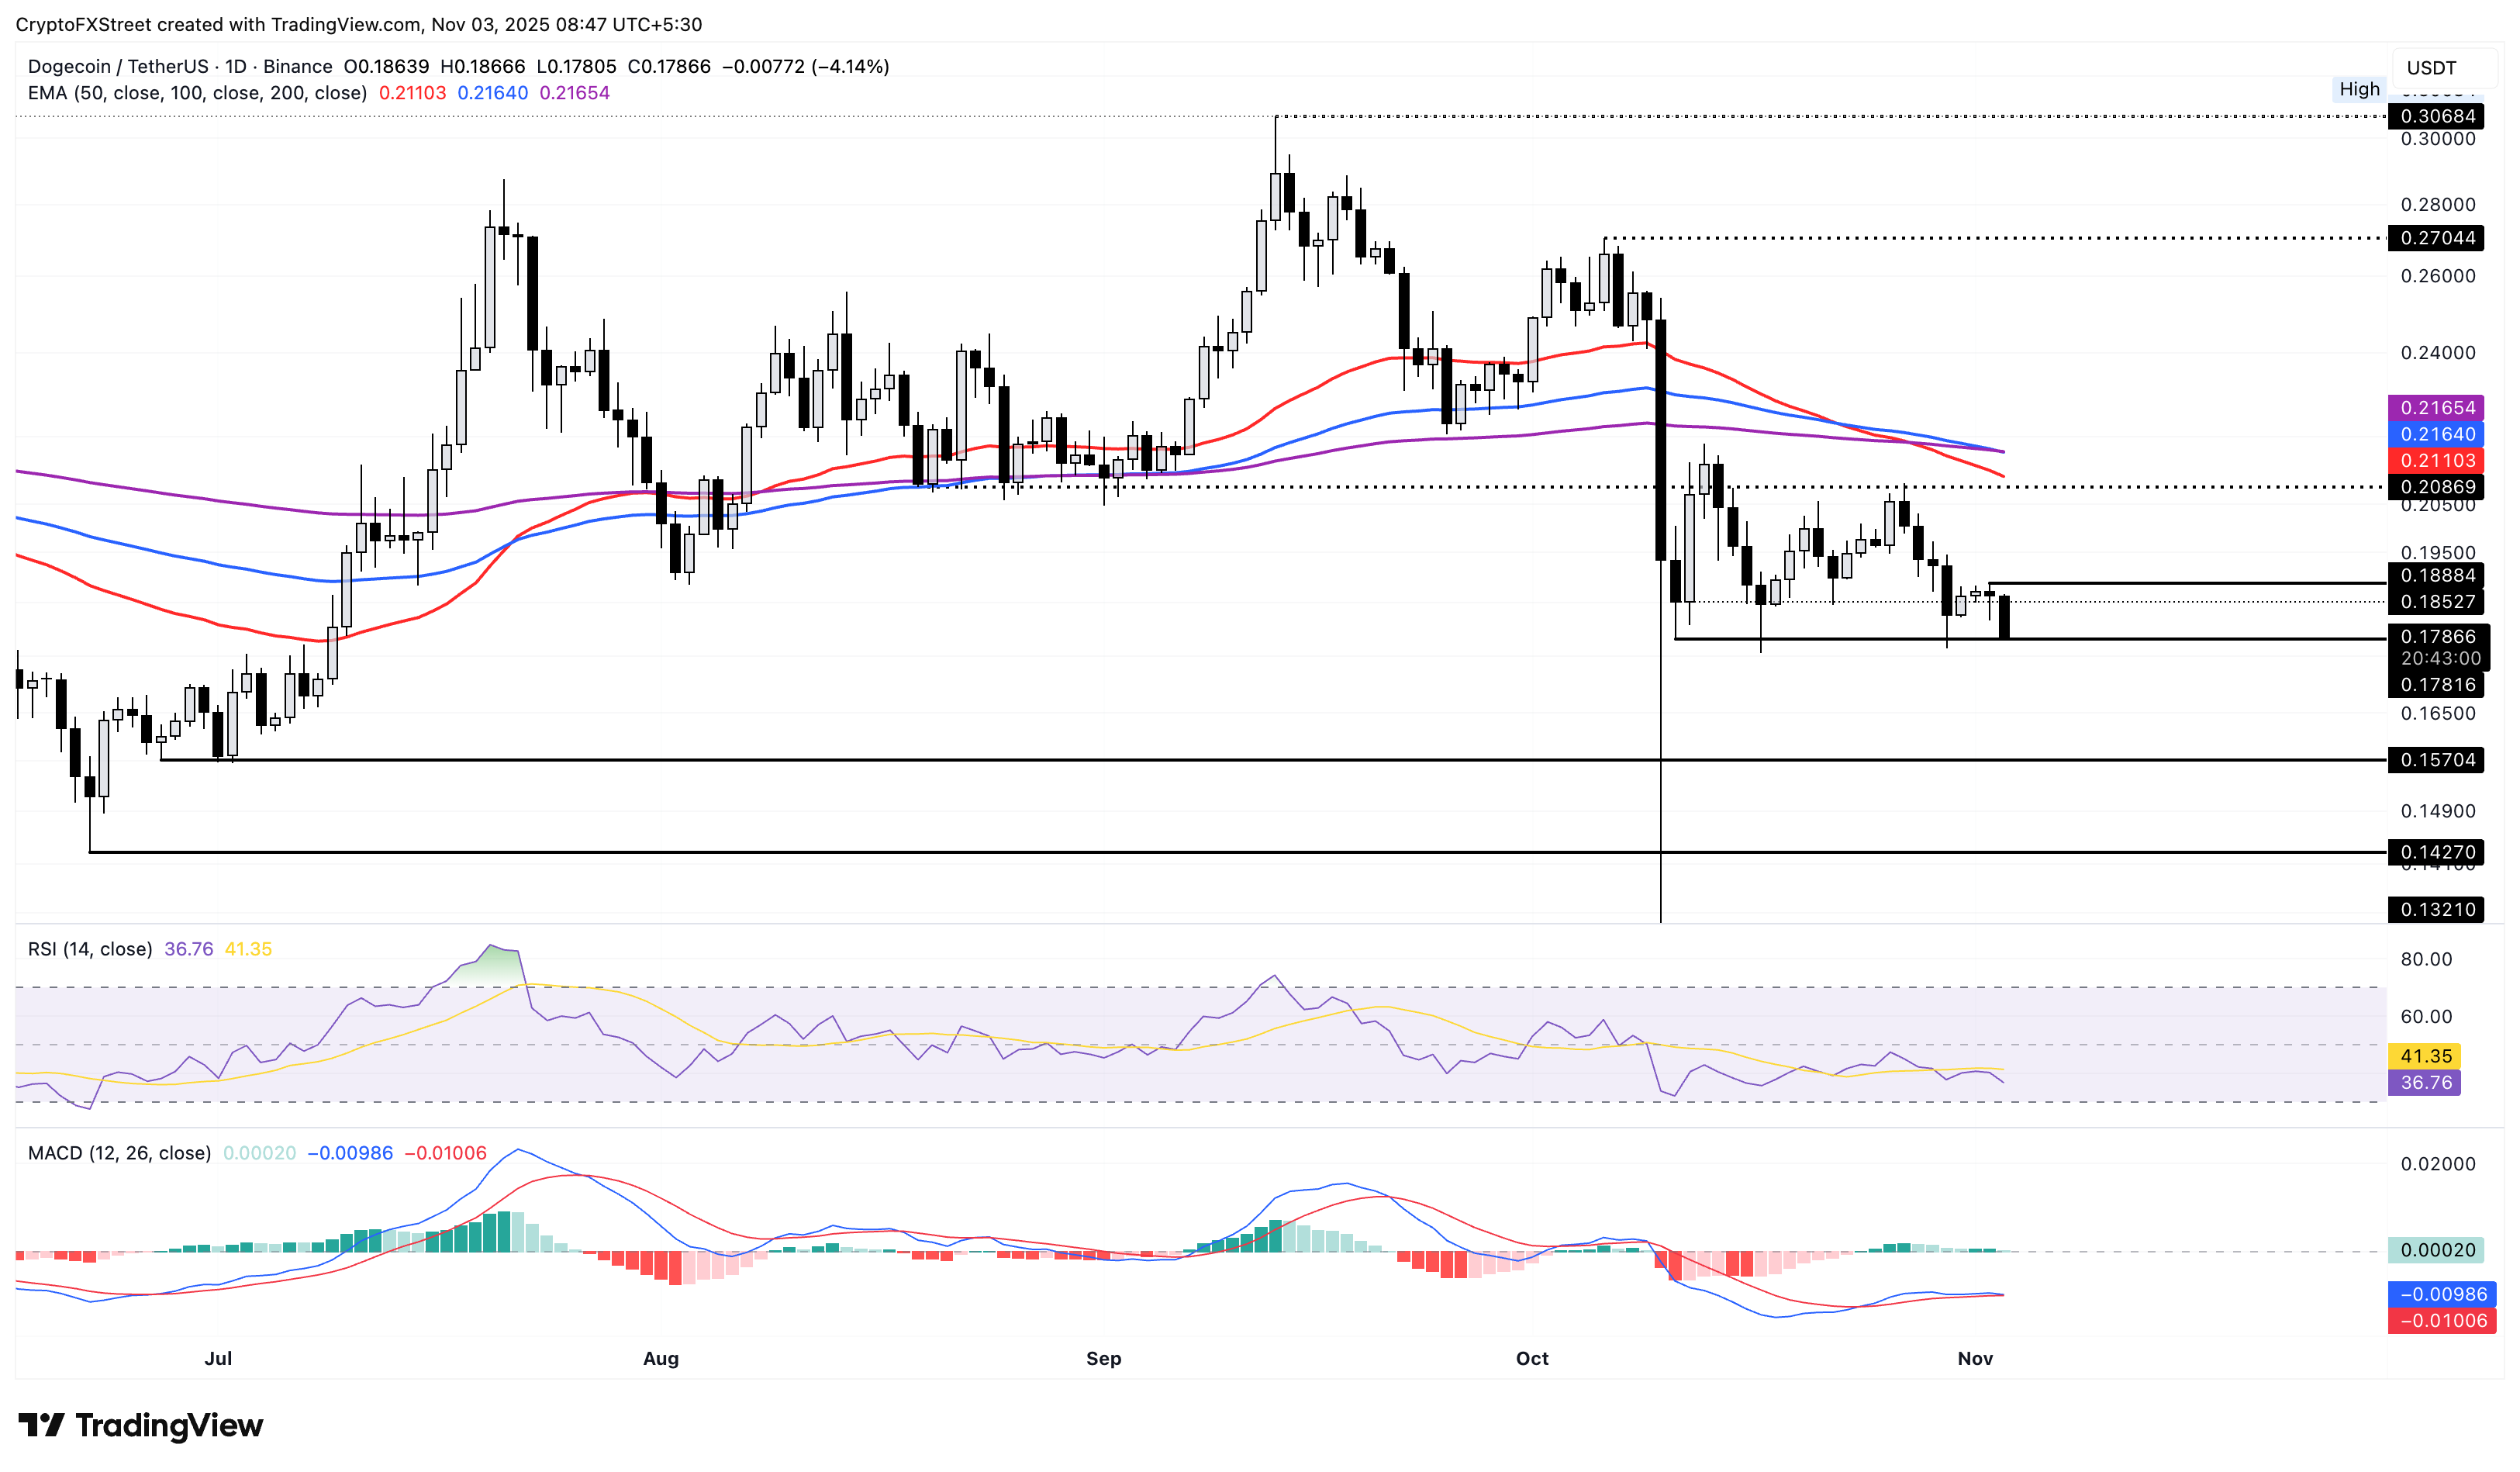
DOGE/USDT daily price chart.
If DOGE manages to bounce back from $0.17819, Sunday’s high at $0.18884 would act as the immediate resistance.
Shiba Inu at key support as buying pressure declines
Shiba Inu drops below the $0.00001000 psychological level, marking a bearish start to the week. At the time of writing, SHIB is down over 3% on Monday, risking a drop below the $0.00000974 support level, marked by the October 10 close.
If SHIB drops below this level, it could further stretch the downtrend to $0.00000930 or $0.00000874, marked by the February 21 and January 24 lows, respectively.
The uptrending MACD and signal line lose momentum as green histogram bars above the zero line shrink. If a red histogram emerges below the same line, it would indicate a bearish upper hand.
Similarly, the RSI at 40 reverts before reaching the midpoint level, indicating renewed selling pressure.
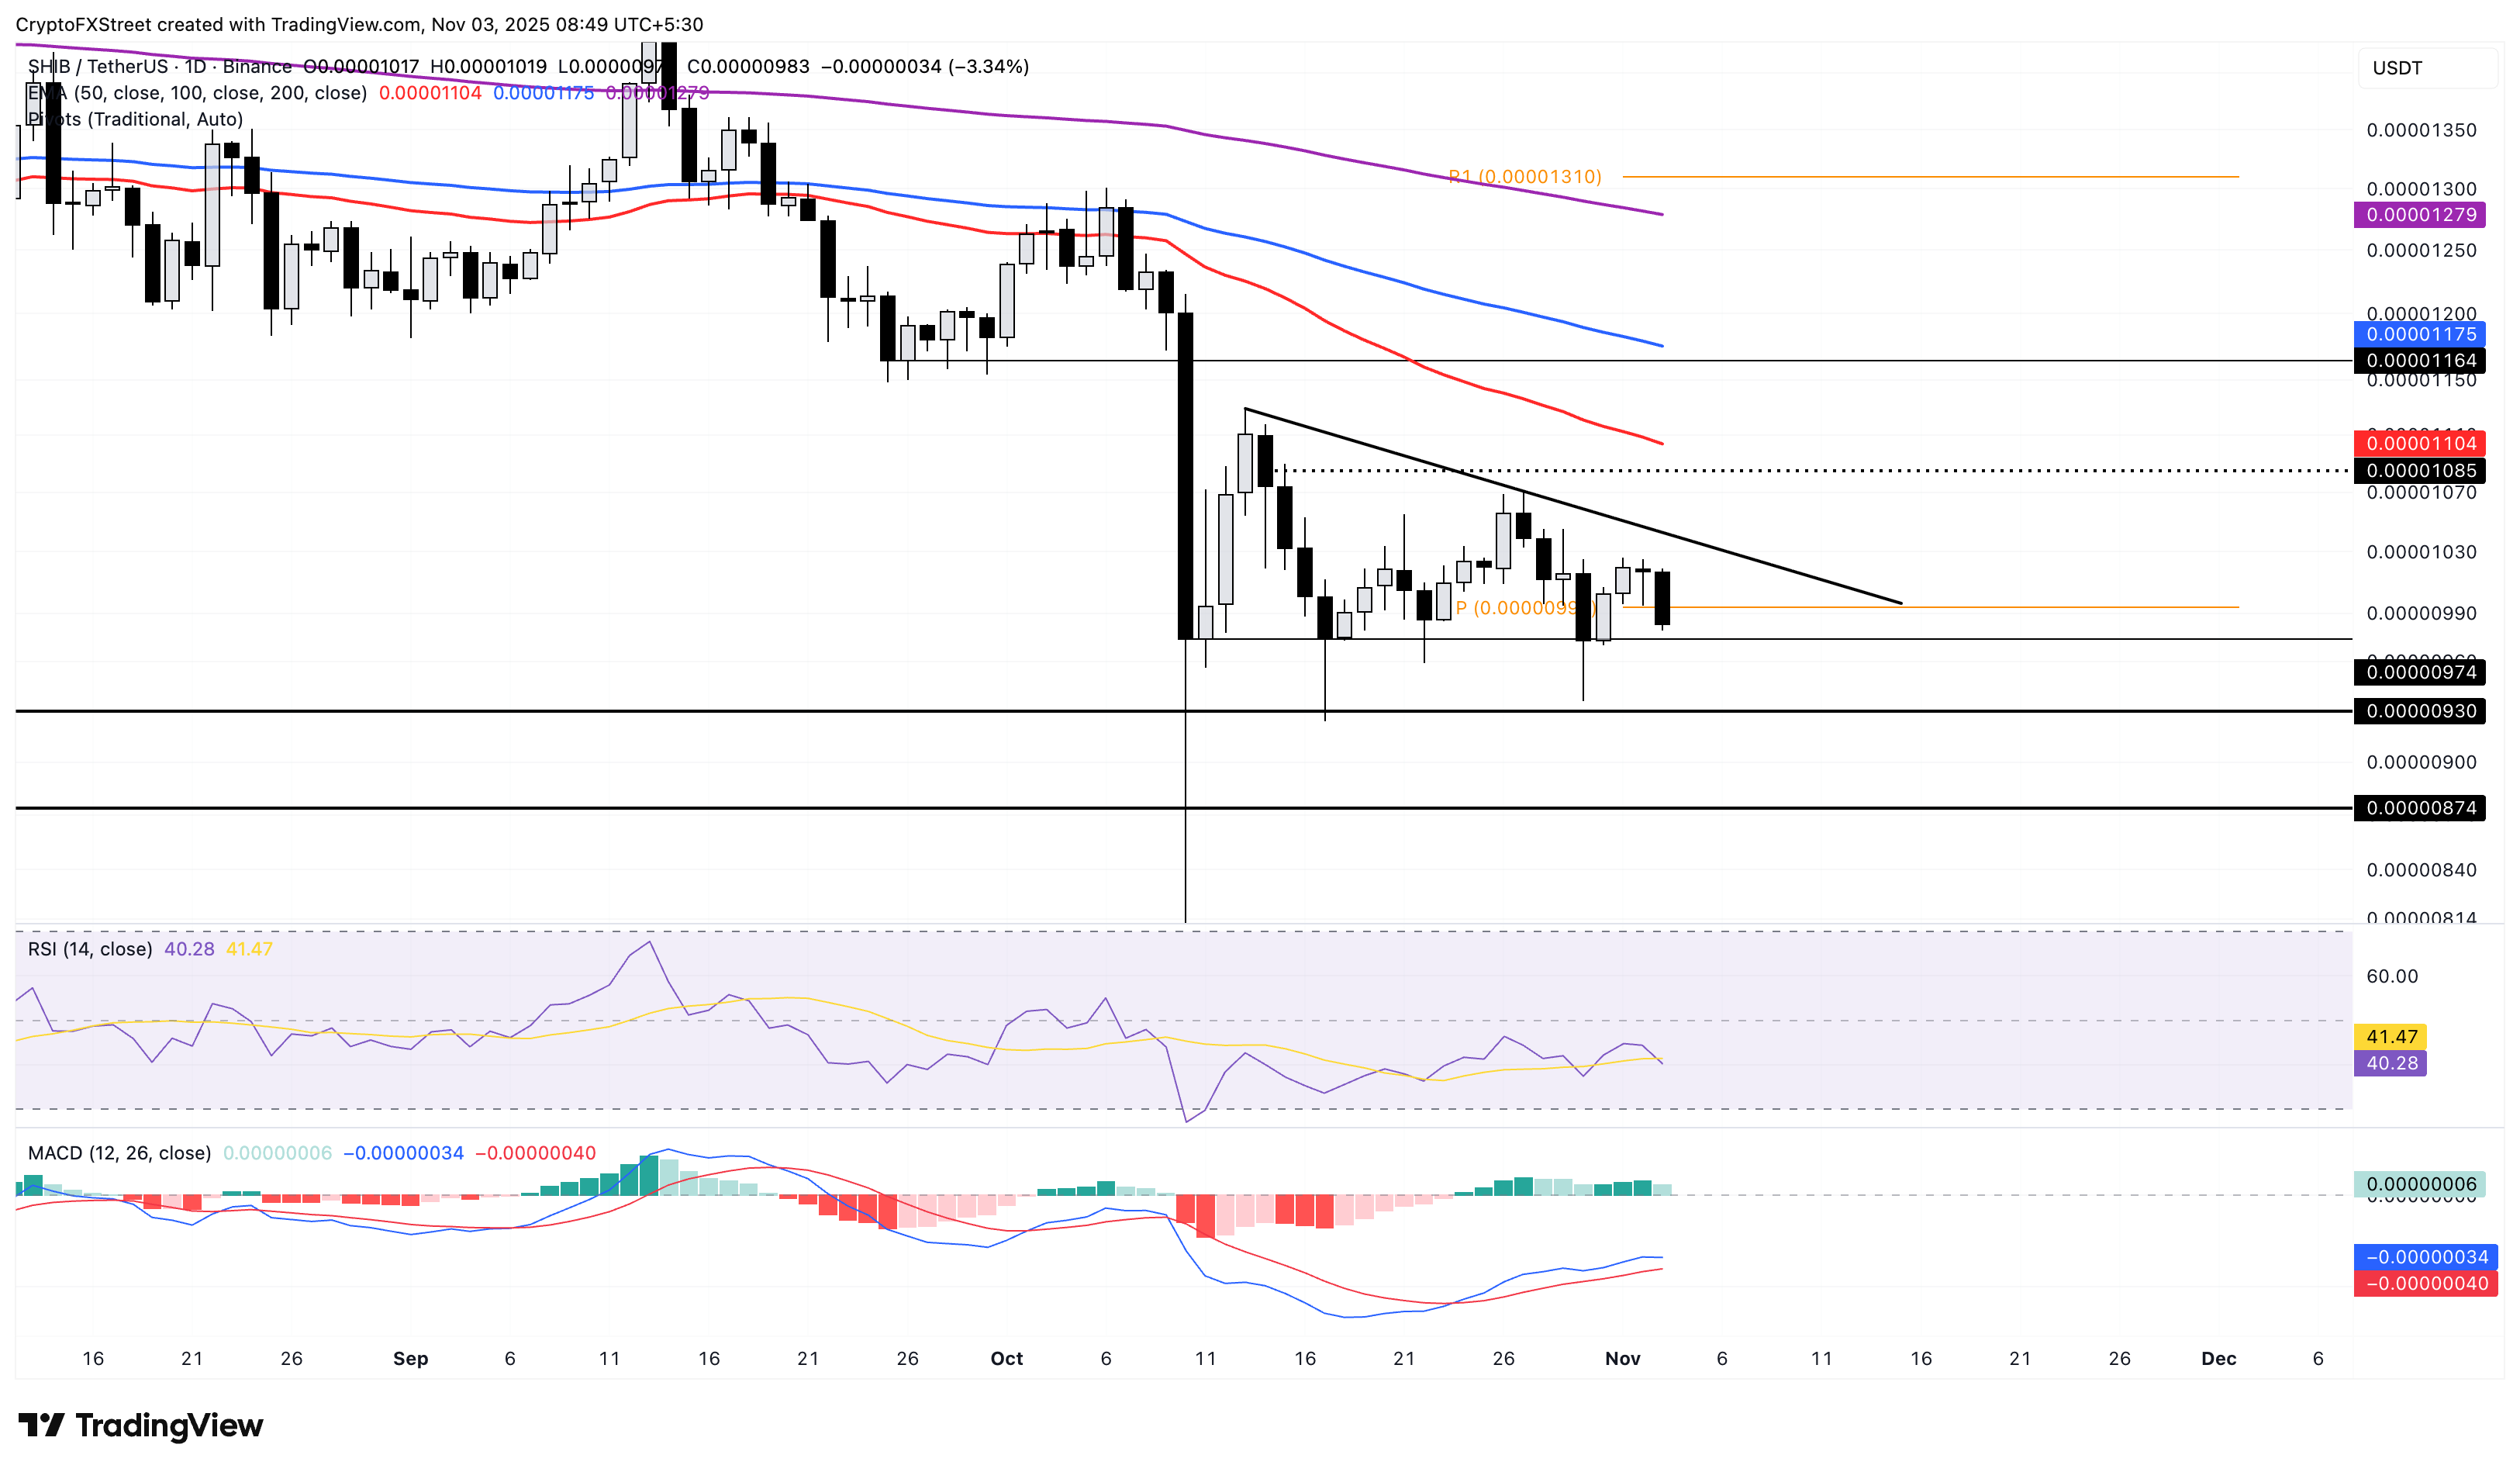
SHIB/USDT daily price chart.
On the upside, if SHIB rebounds from $0.00000974, the psychological resistance at $0.00001000 and the local resistance trendline near $0.00001045 could oppose the recovery.
Pepe risks breaking a key support trendline
Pepe ticks lower by 5% at press time on Monday as the retail and whale demand wanes. The meme coin approaches a local support trendline near $0.00000620, formed by connecting the October 11 and October 30 lows.
If PEPE slips below this level, the key support levels are at the $0.00000525 and $0.00000279 lows marked on March 11 and October 10, respectively.
The declining trend in the 50-day, 100-day, and 200-day EMAs suggests a strong bearish trend in motion.
Similar to Dogecoin, the MACD in PEPE is approaching a bearish crossover with the RSI at 34, indicating an oversold zone.
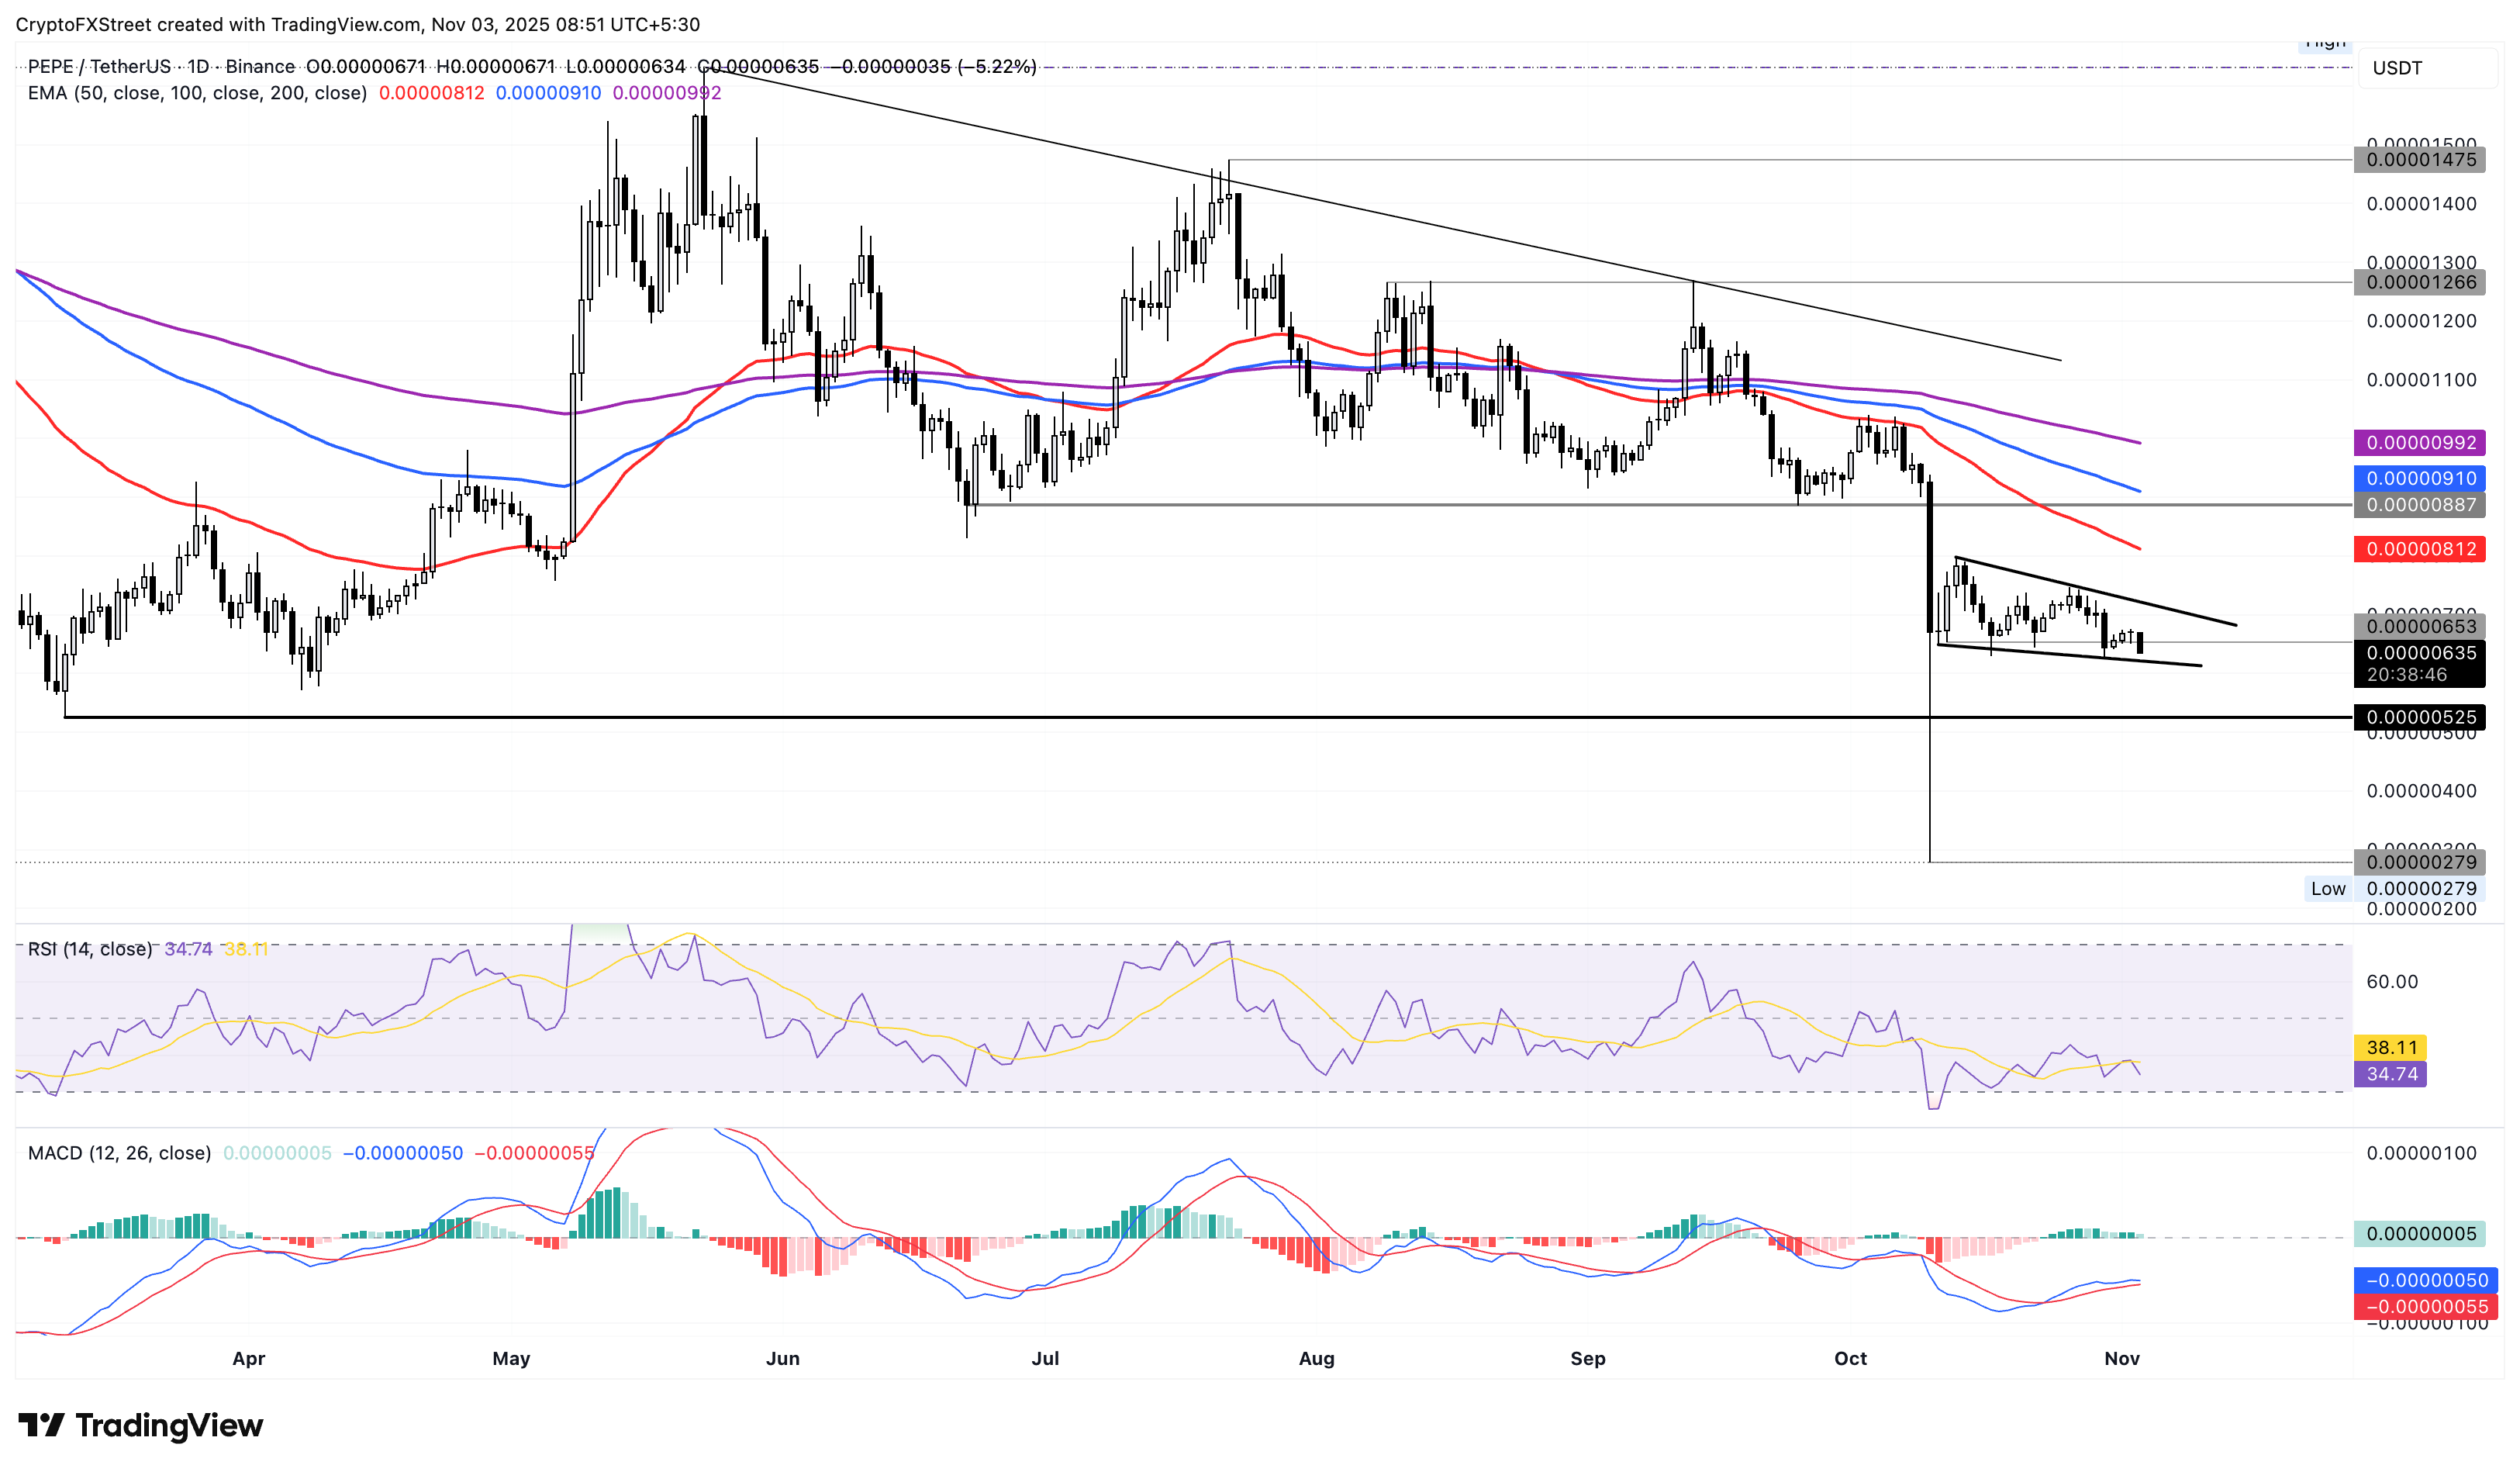
PEPE/USDT daily price chart.
Optimistically, a recovery in PEPE could test the local resistance trendline at $0.00000720 formed by connecting the October 13 and October 27 highs, respectively.

FXStreet
超過一百萬用戶依賴 FXStreet 獲取即時市場數據、圖表工具、專家洞見與外匯新聞。其全面的經濟日曆與教育網路研討會協助交易者保持資訊領先、做出審慎決策。FXStreet 擁有約 60 人的團隊,分布於巴塞隆納總部及全球各地。
Read More


