
Trade The World
Pi Network Price Forecast: PI token nears all-time low with 149 million unlock looming in September
作者 Manish Chhetri
發布日期: 27 Aug 2025 | 修改日期: 27 Aug 2025


POPULAR ARTICLES

Pi Network (PI) trades in red, below $0.339 on Wednesday, edging closer to its all-time low of $0.322 set on August 1.
- Pi Network price edges down on Wednesday, nearing its all-time low of $0.322 set on August 1.
- PiScan data indicates that the upcoming monthly token unlock of over 149 million tokens in September could increase selling pressure.
- Artemis data show that daily trading volumes have been steadily declining since mid-May, signaling a weakening of market interest.
Pi Network (PI) trades in red, below $0.339 on Wednesday, edging closer to its all-time low of $0.322 set on August 1. Traders are bracing for a major token unlock event next month, with over 149 million tokens scheduled to unlock — a development that could intensify selling pressure amid already declining trading volumes and weakening market sentiment.
Pi Network’s 149 million token unlock could fuel a deeper correction
PiScan’s monthly unlock data indicates that over 149 million tokens, worth $50.71 million, are set to unlock in September. These token unlock events will increase the circulating supply of PI and could increase selling pressure, which can weigh down prices. However, planned unlock schedules may have a less significant impact as the trading community anticipates the move and likely positions itself accordingly.
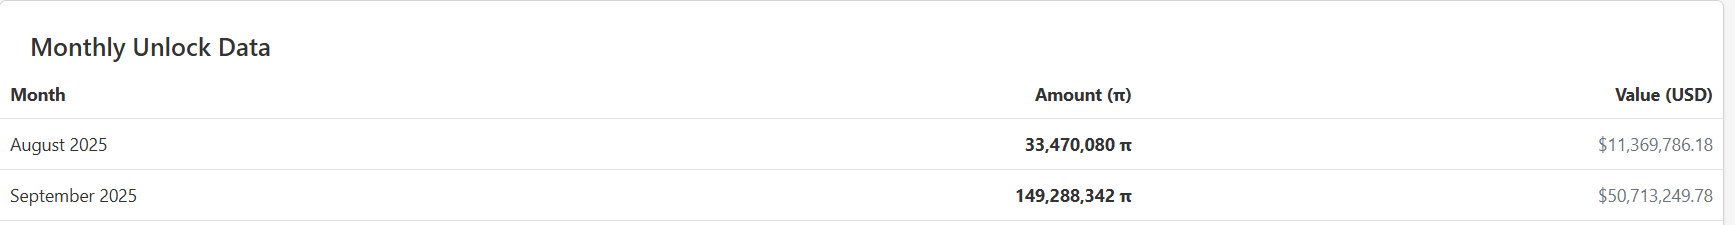
PI monthly unlock data chart. Source: PiScan
Another bearish sign that traders should watch for is the decline in interest and liquidity on the PI chain. Artemis Terminal data show that the daily token trading volume has been steadily declining since mid-May, standing at $43.8 million on Tuesday, which signals a weakening of market interest.
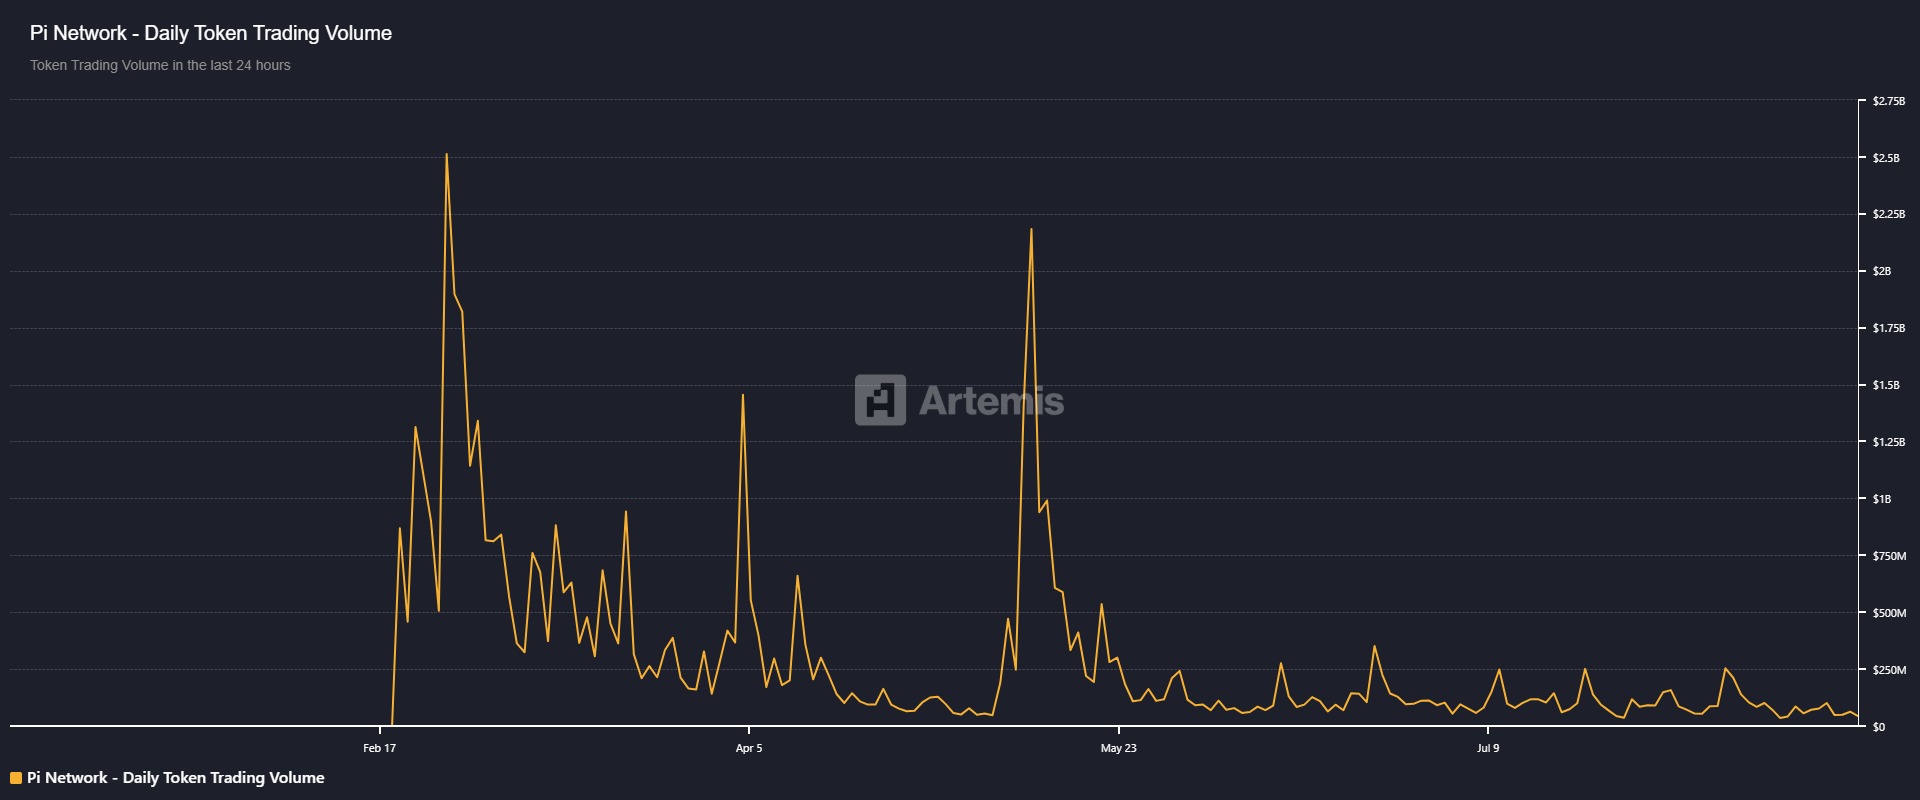
Pi Network daily token trading volume chart. Source: Artemis Terminal
Pi Network Price Forecast: PI nears its all-time low
Pi Network price has been trading within a descending channel pattern (drawn by connecting multiple highs and lows with two trendlines since mid-May) and has fallen by more than 17% this month, reaching an all-time low (ATL) of $0.322 on August 1. At the time of writing on Wednesday, it continues to trade down at around $0.340.
If PI continues its downward trend, it could extend the decline toward its ATL of $0.322.
The Relative Strength Index (RSI) on the daily chart reads 38, below its neutral level of 50, indicating strong bearish momentum. The Moving Average Convergence Divergence (MACD) indicator lines coil against each other, suggesting indecisiveness among traders.
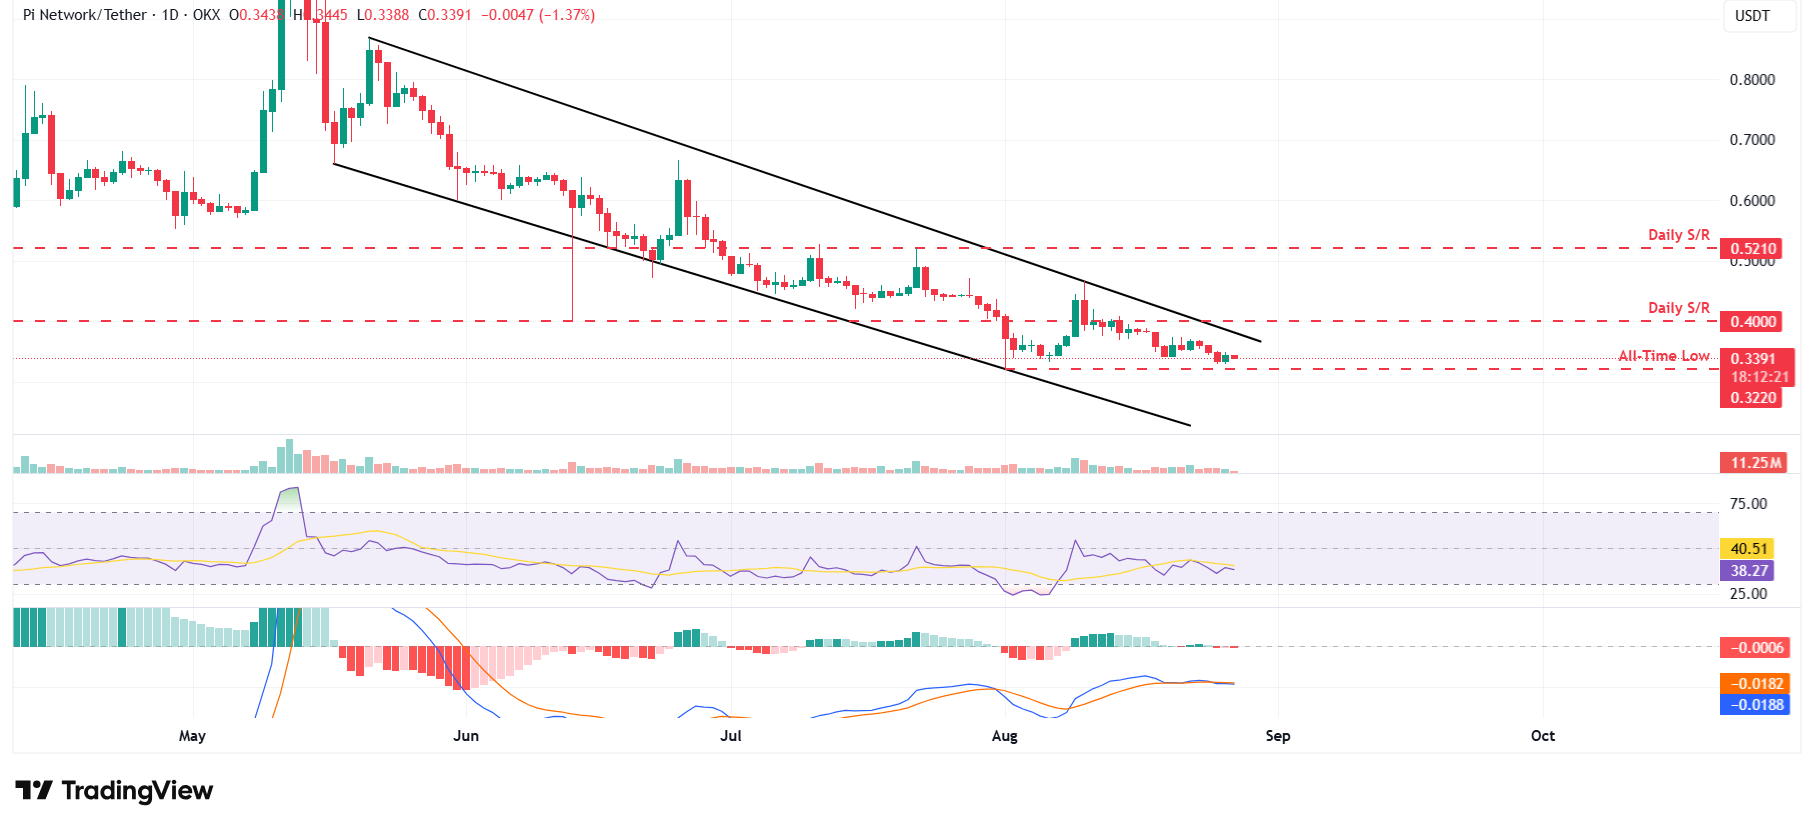
PI/USDT daily chart
However, if PI recovers, it could extend the recovery toward its daily resistance at $0.400.
Cryptocurrency metrics FAQs
The developer or creator of each cryptocurrency decides on the total number of tokens that can be minted or issued. Only a certain number of these assets can be minted by mining, staking or other mechanisms. This is defined by the algorithm of the underlying blockchain technology. On the other hand, circulating supply can also be decreased via actions such as burning tokens, or mistakenly sending assets to addresses of other incompatible blockchains.
Market capitalization is the result of multiplying the circulating supply of a certain asset by the asset’s current market value.
Trading volume refers to the total number of tokens for a specific asset that has been transacted or exchanged between buyers and sellers within set trading hours, for example, 24 hours. It is used to gauge market sentiment, this metric combines all volumes on centralized exchanges and decentralized exchanges. Increasing trading volume often denotes the demand for a certain asset as more people are buying and selling the cryptocurrency.
Funding rates are a concept designed to encourage traders to take positions and ensure perpetual contract prices match spot markets. It defines a mechanism by exchanges to ensure that future prices and index prices periodic payments regularly converge. When the funding rate is positive, the price of the perpetual contract is higher than the mark price. This means traders who are bullish and have opened long positions pay traders who are in short positions. On the other hand, a negative funding rate means perpetual prices are below the mark price, and hence traders with short positions pay traders who have opened long positions.

FXStreet
超過一百萬用戶依賴 FXStreet 獲取即時市場數據、圖表工具、專家洞見與外匯新聞。其全面的經濟日曆與教育網路研討會協助交易者保持資訊領先、做出審慎決策。FXStreet 擁有約 60 人的團隊,分布於巴塞隆納總部及全球各地。
Read More


