
Trade The World
Pump.fun, Virtuals Protocol, and Ethena log double-digit losses amid market-wide sell-off
作者 Vishal Dixit
發布日期: 31 Oct 2025 | 修改日期: 31 Oct 2025


POPULAR ARTICLES

Pump.fun (PUMP), Virtuals Protocol (VRITUAL), and Ethena (ENA) are leading the decline as the broader cryptocurrency market faces a sell-off wave.
- Pump.fun flips to the downside from a key resistance trendline, recording double-digit losses in the last 24 hours.
- Virtuals Protocol rebounds 6% on Friday as bulls attempt recovery after a 17% decline in the previous session.
- Ethena extends the support trendline breakdown, with bears aiming for the $0.3459 level.
Pump.fun (PUMP), Virtuals Protocol (VRITUAL), and Ethena (ENA) are leading the decline as the broader cryptocurrency market faces a sell-off wave. Technically, the PUMP, VIRTUAL, and ENA tokens are approaching key support levels, but market-wide fear, uncertainty, and doubt (FUD) risks may further exacerbate losses.
Pump.fun’s declining trend tests a key support
Pump.fun’s PUMP token price is down by nearly 1% at press time on Friday, extending the 15% losses from the previous day. The launchpad token failed to surpass the R1 Pivot Point $0.005275 and the local resistance trendline formed by connecting the September 14 and October 3 peaks on the 4-hour price chart.
The key support levels during the ongoing pullback are the S1 and S2 Pivot Points, located at $0.003864 and $0.002933, respectively.
The momentum indicators on the 4-hour chart maintain a bearish incline as the Moving Average Convergence Divergence (MACD) slope downwards with its signal line, indicating a rise in supply pressure.
Additionally, the Relative Strength Index (RSI) reads 43 on the same chart, indicating further room for downside movement before reaching the overbought zone.
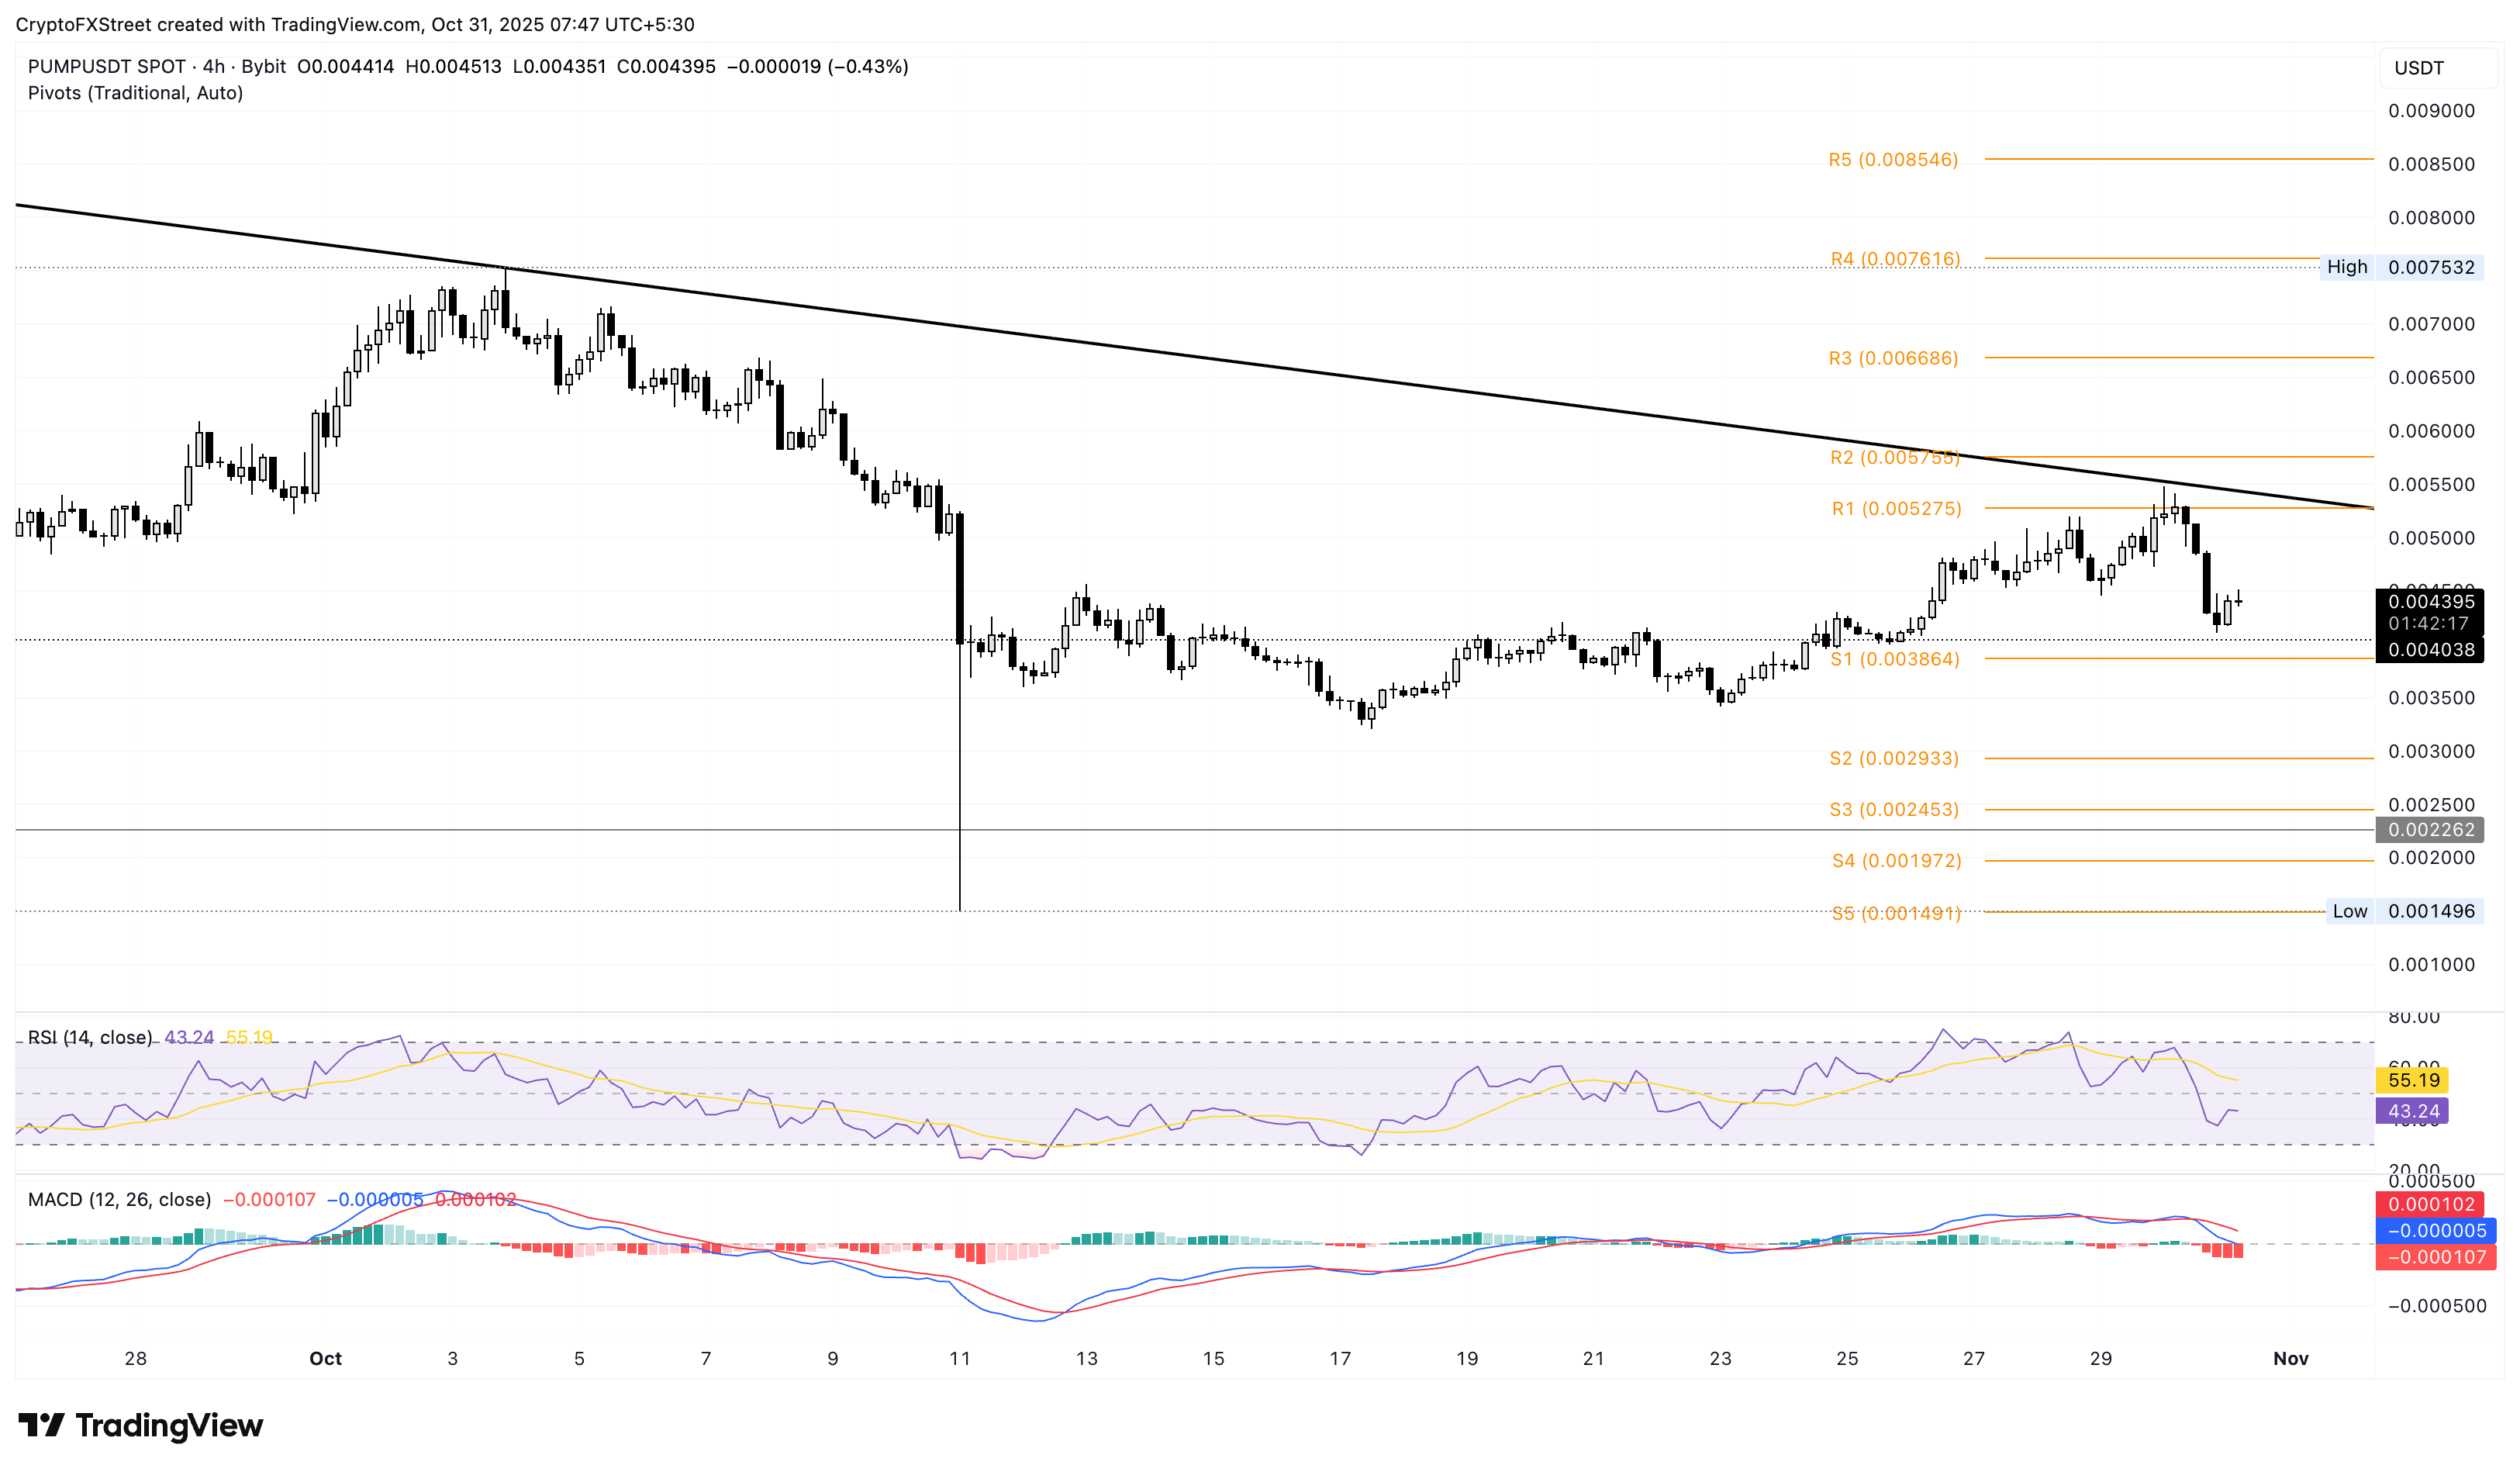
PUMP/USDT 4-hour price chart.
Looking up, the key resistance for PUMP remains the local resistance trendline near the R1 Pivot Point at $0.005275.
Virtuals Protocol bulls hold at a crucial stronghold
Virtuals Protocol recovers over 5% at the time of writing on Friday, from the 17% loss on the previous day. The AI agent token has failed to surpass the $1.6898 level earlier this week and is now maintaining a position above the $1.1821 support level.
If VIRTUAL slips below this level, it could test the $1.0000 psychological support.
Adding to the downside risk, the indicators on the daily chart suggest a decline in buying pressure. The MACD approaches its signal line for a potential bearish crossover while the RSI slips to 59 from the overbought zone.
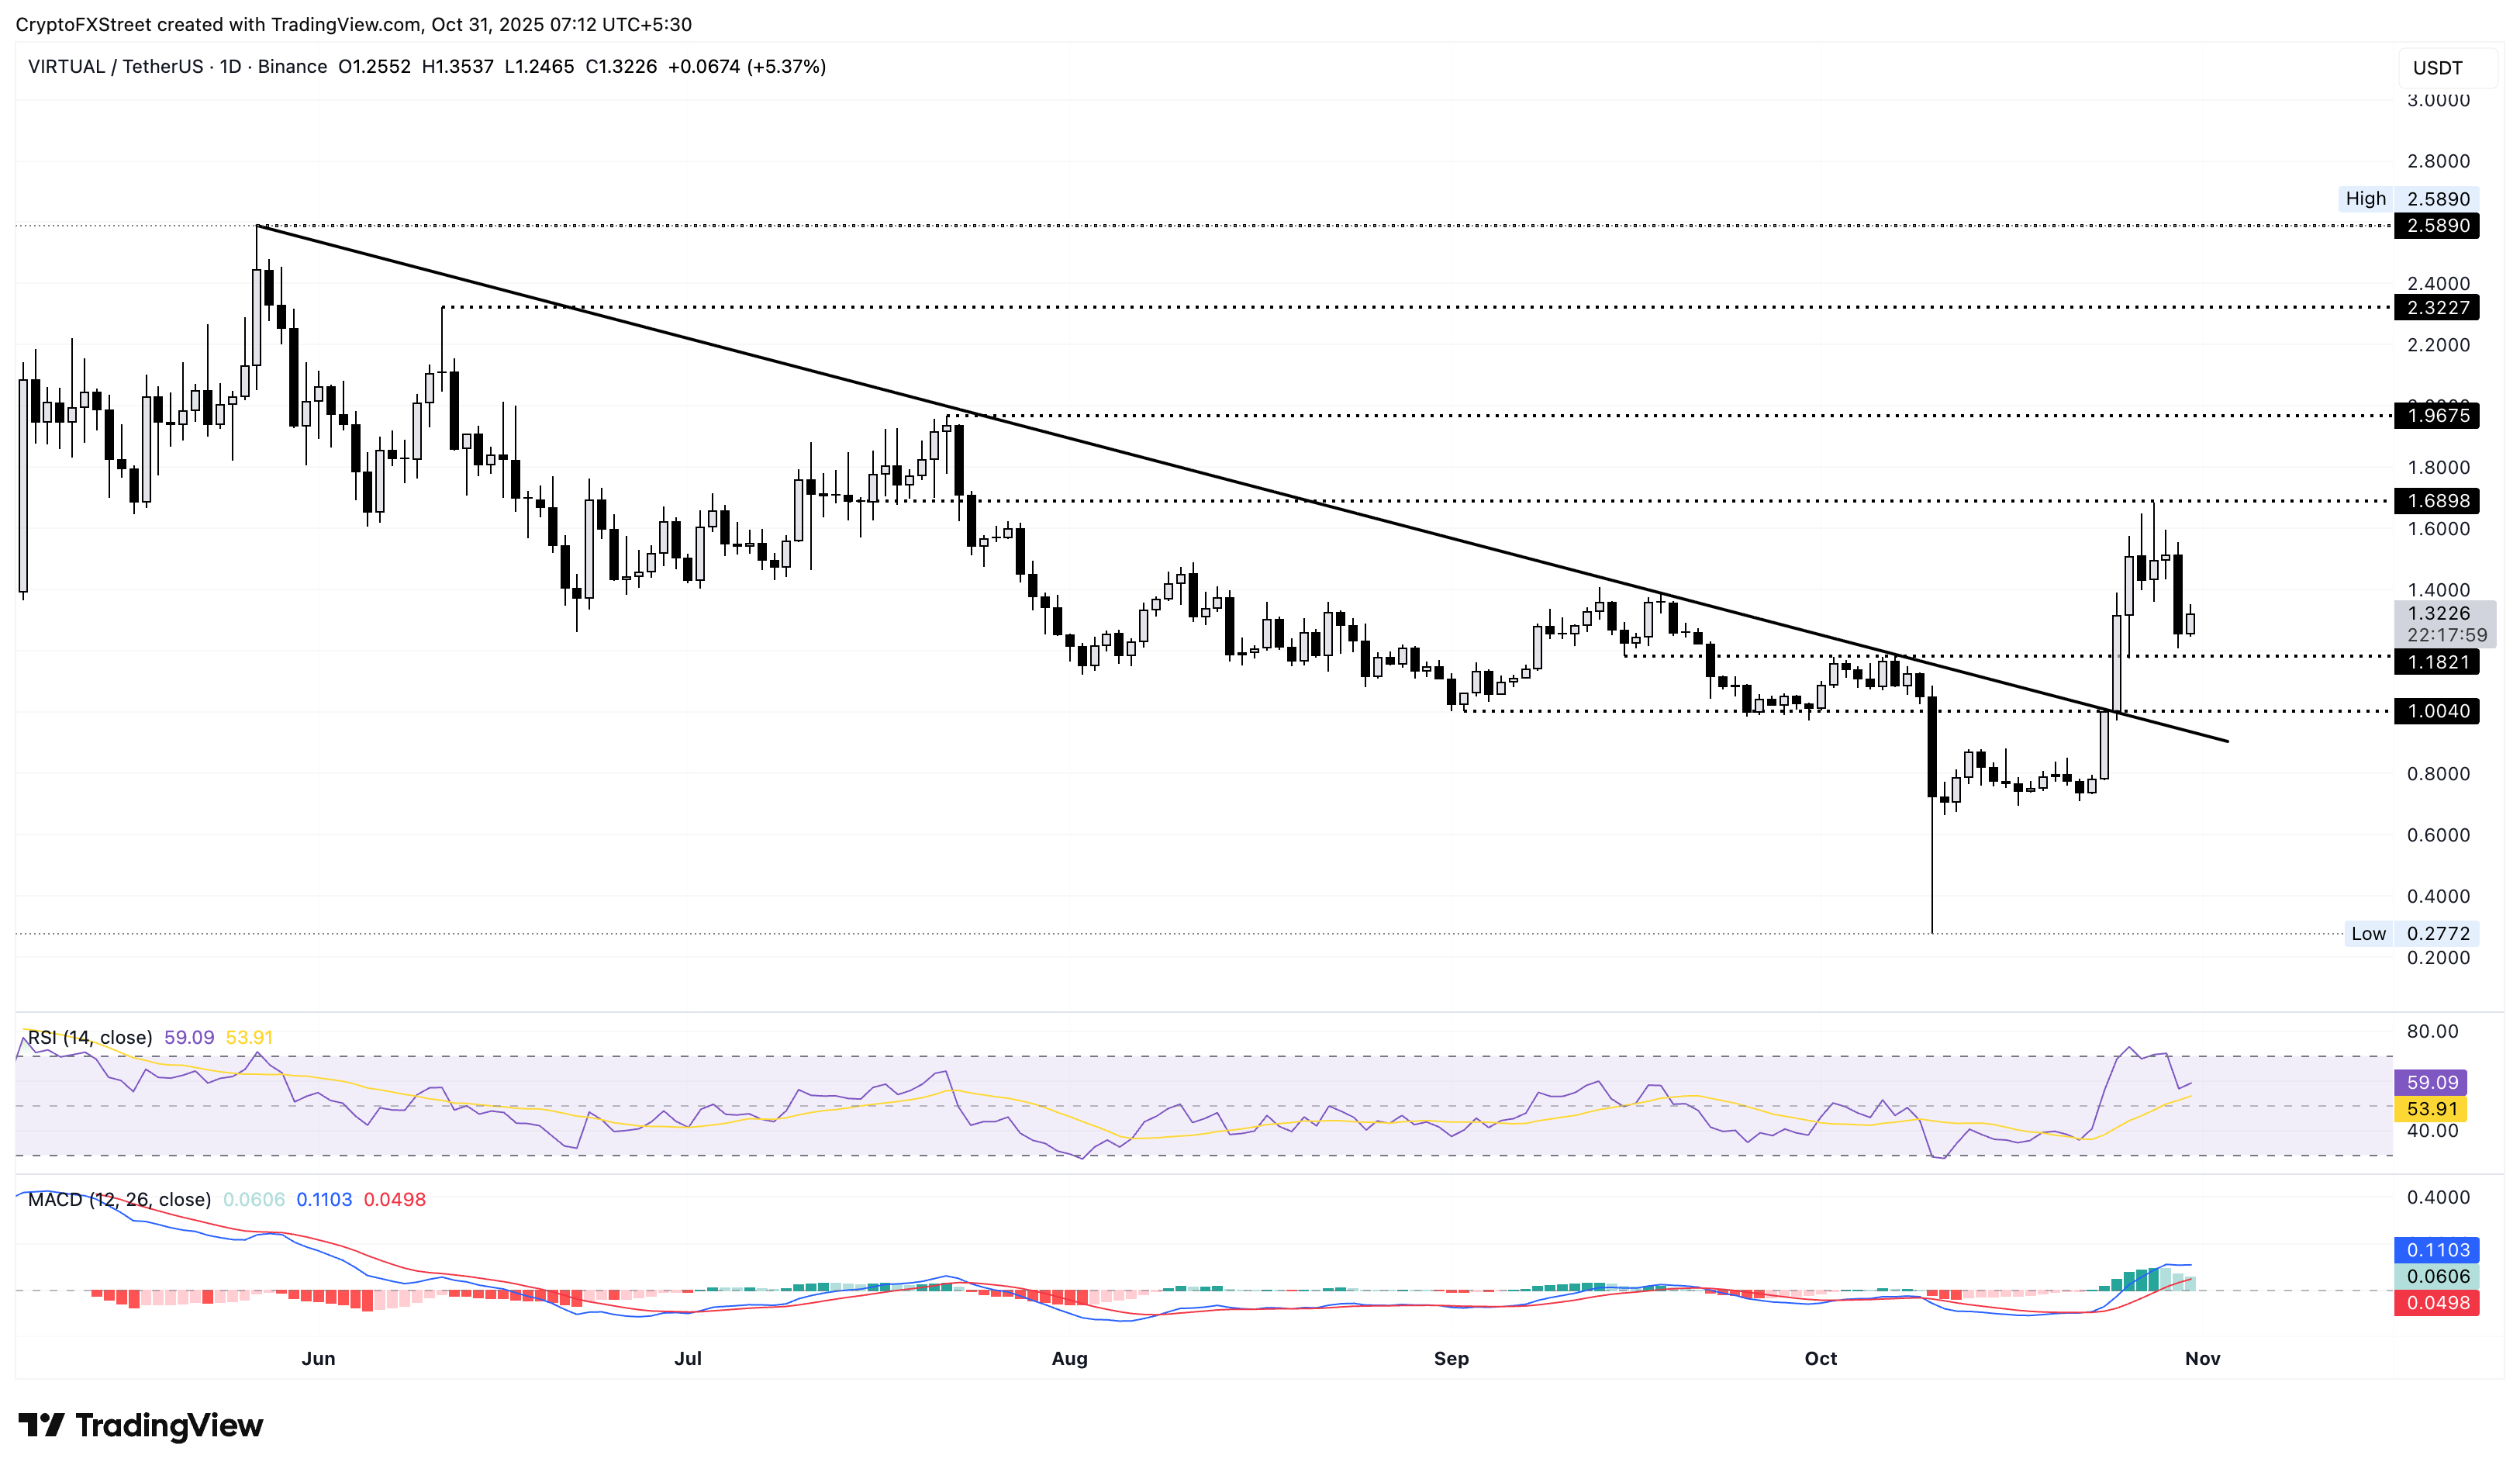
VIRTUAL/USDT daily price chart.
On the upside, a bounce back could retest the $1.6898 resistance with the $1.9675 level as the potential breakout target.
Ethena’s key support is at risk
Ethena trades below the $0.4000 level at press time on Friday, after four consecutive days of losses. The bearish flip in ENA from the $0.5343 resistance broke below a local support trendline to test the S2 Pivot Point at $0.3823, as previously anticipated by FXStreet.
If the synthetic dollar token fails to hold above this level, it could extend the correction to $0.3459, the low of October 12, followed by the S4 Pivot Point at $0.3102.
Technically, the selling pressure on the 4-hour timeframe is at extreme levels as the RSI at 25 flashes oversold signals while the MACD and its signal line fall freely into the negative zone.
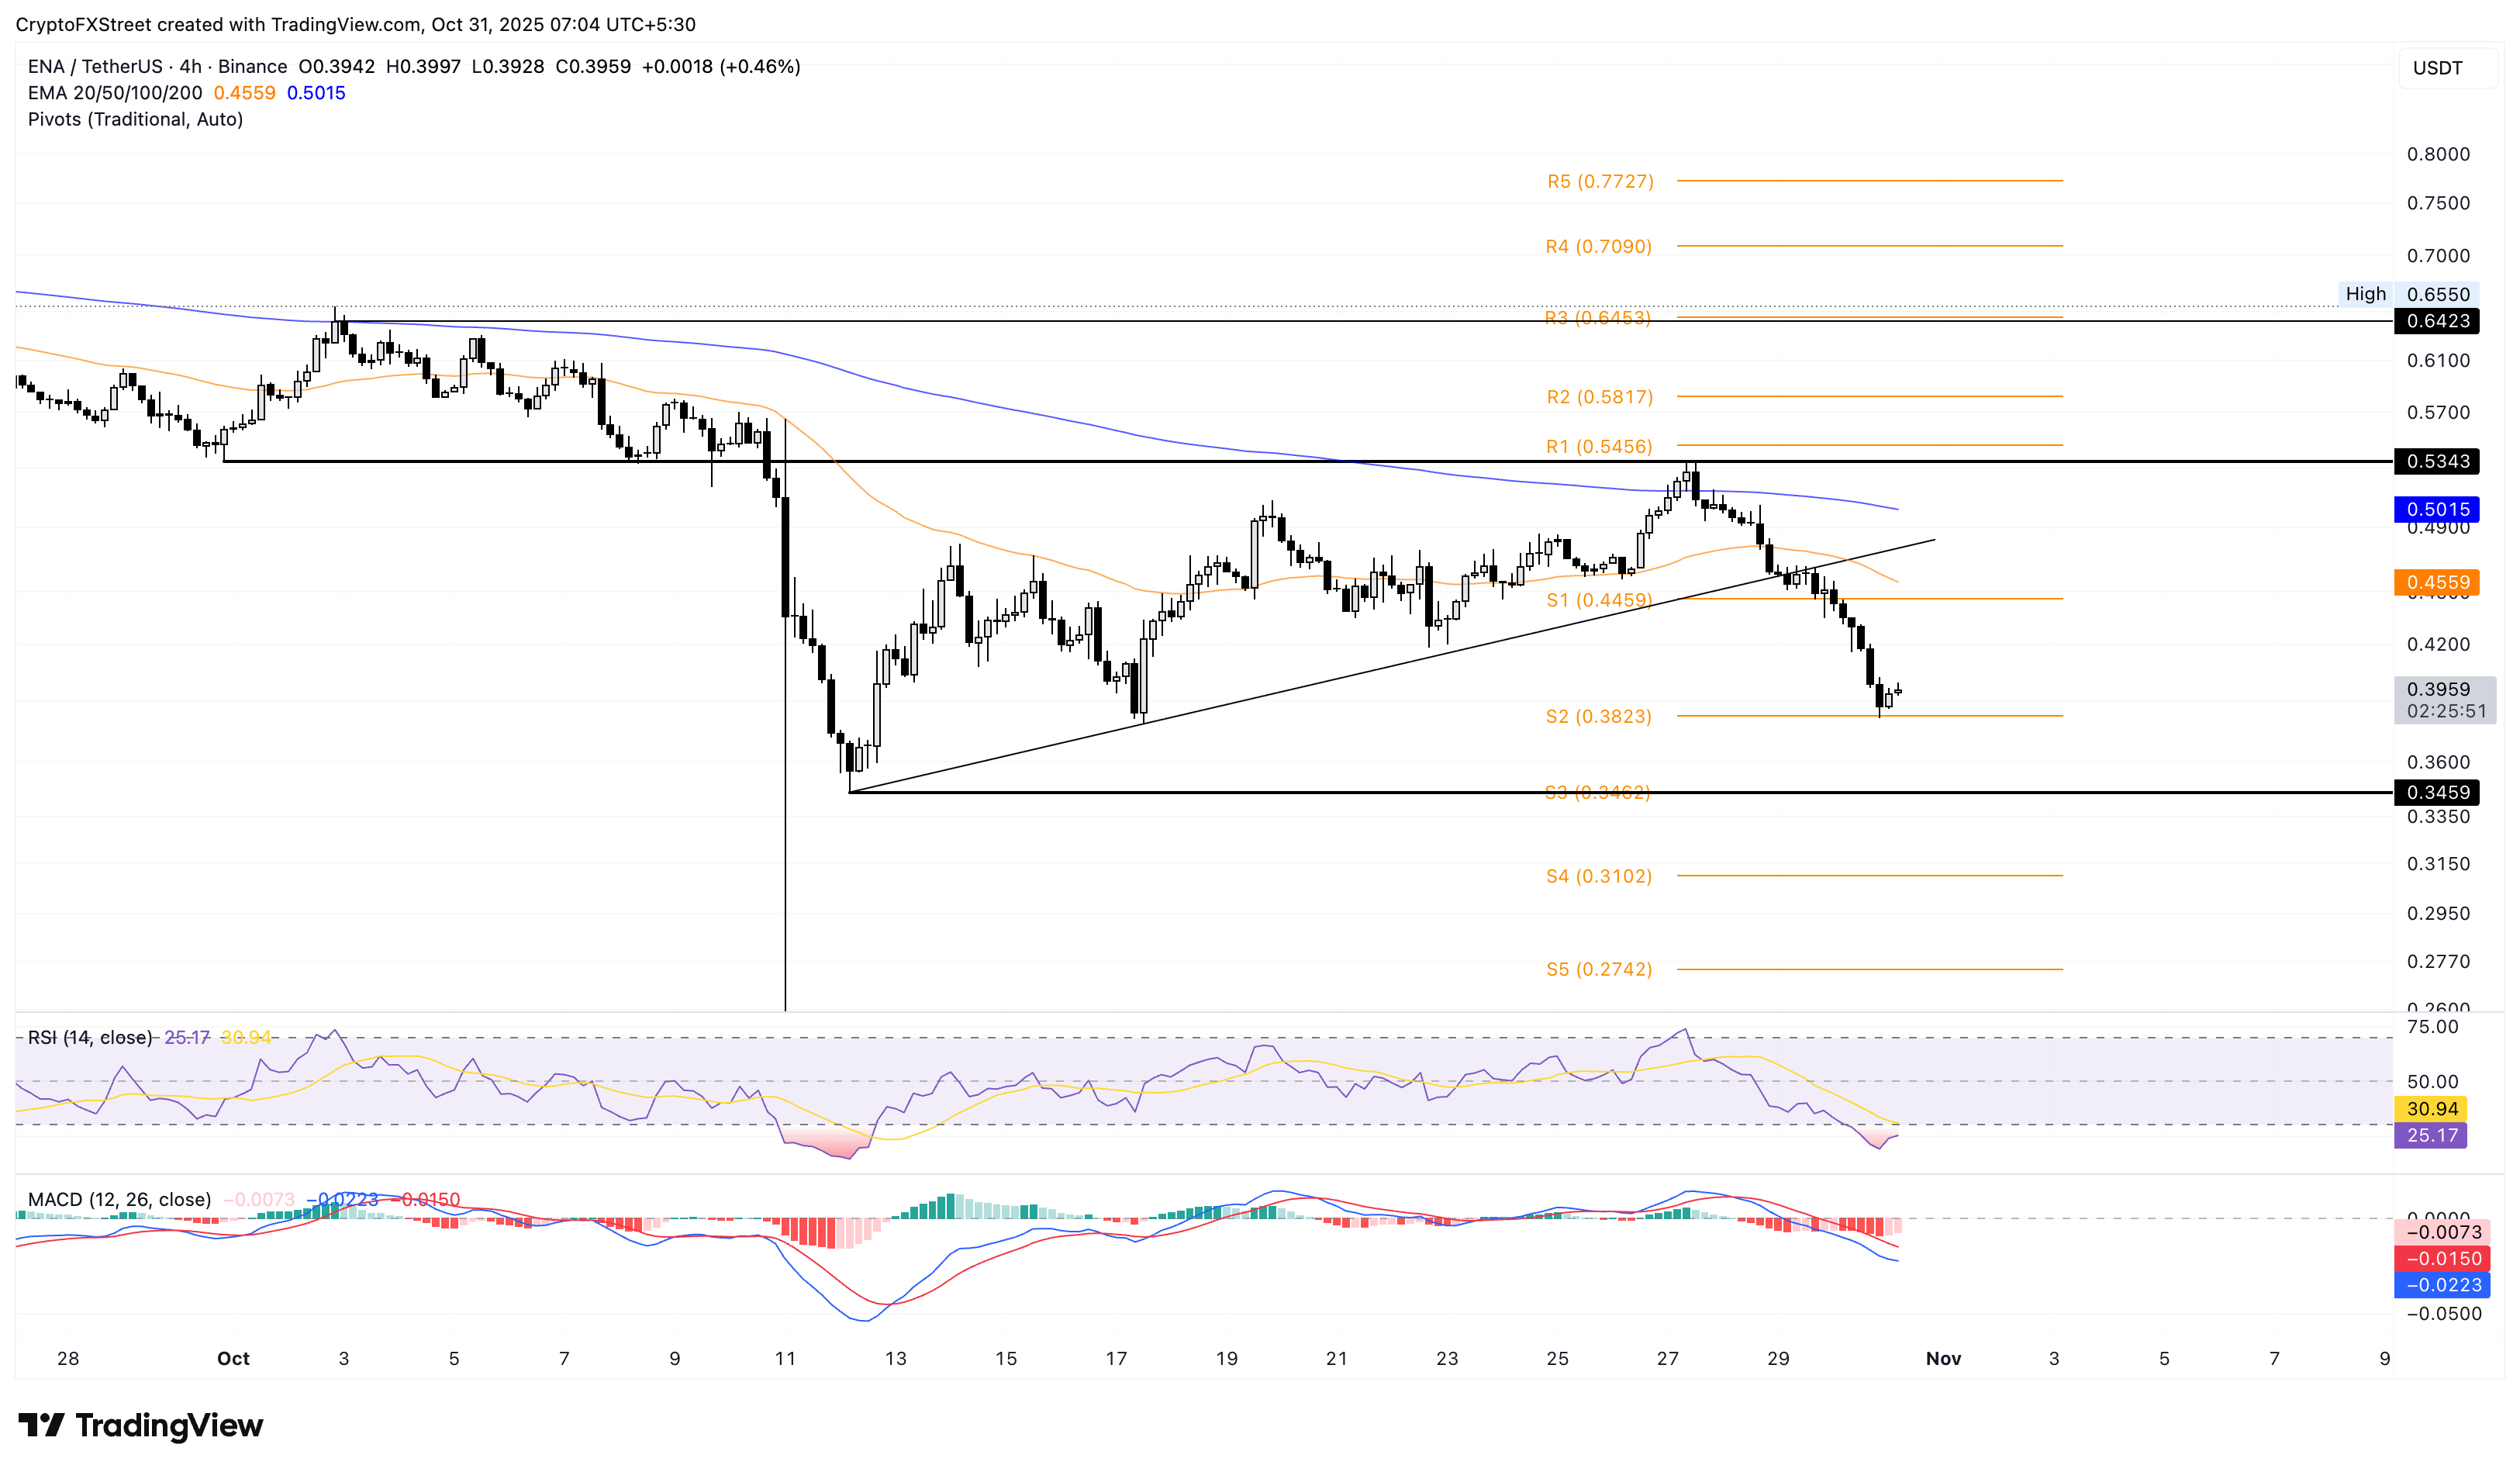
ENA/USDT 4-hour price chart.
A potential bounce back in ENA could retest the S1 Pivot Point at $0.4459.

FXStreet
超過一百萬用戶依賴 FXStreet 獲取即時市場數據、圖表工具、專家洞見與外匯新聞。其全面的經濟日曆與教育網路研討會協助交易者保持資訊領先、做出審慎決策。FXStreet 擁有約 60 人的團隊,分布於巴塞隆納總部及全球各地。
Read More


