
Trade The World
Solana Price Forecast: SOL rebounds amid steady retail, institutional demand
作者 Vishal Dixit
發布日期: 10 Nov 2025 | 修改日期: 10 Nov 2025


POPULAR ARTICLES

Solana (SOL) price is up nearly 2% at press time on Monday, extending the over 4% gains from the previous day. The rebound from the $150 psychological level signals strong demand, as evidenced by the consistent daily net inflows in the US spot Solana Exchange Traded Funds (ETFs).
- Solana extends recovery as bearish momentum wanes.
- The rise in SOL futures Open Interest indicates renewed risk-on sentiment among investors.
- A steady streak of daily net inflows in the US spot SOL ETFs reflects consistent institutional demand.
Solana (SOL) price is up nearly 2% at press time on Monday, extending the over 4% gains from the previous day. The rebound from the $150 psychological level signals strong demand, as evidenced by the consistent daily net inflows in the US spot Solana Exchange Traded Funds (ETFs).
Furthermore, the retail interest increases their exposure to Solana futures, anticipating extended gains. Still, the technical outlook suggests that a previous key support zone has become resistance, posing a significant overhead hurdle that could stall the recovery.
Renewed retail and steady institutional demand back Solana
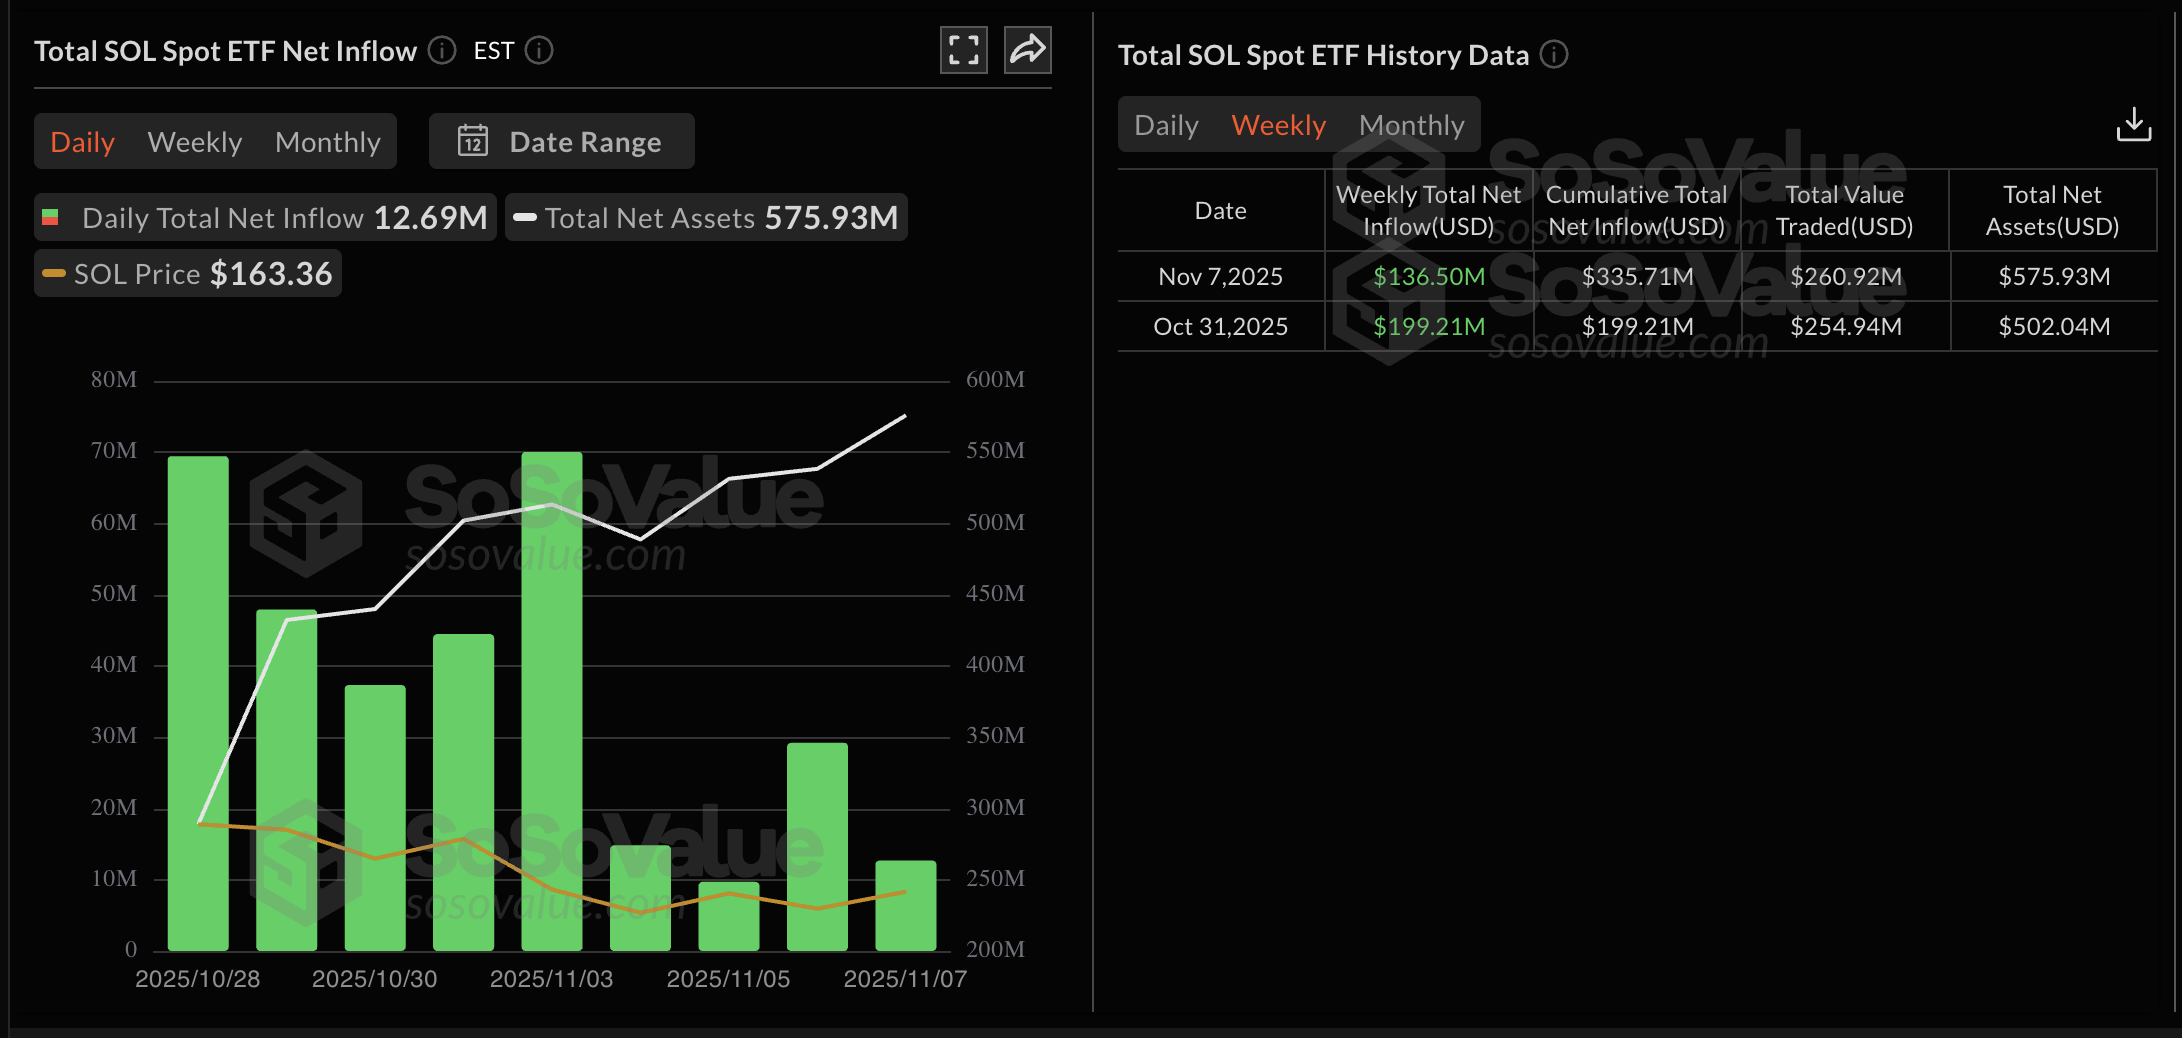
The US spot Solana ETFs recorded their ninth consecutive day of net inflows on Friday, amounting to $136.50 million in inflows last week. A potential increase in ETF inflows could uplift the SOL prices.
The recent bounce back in the broader cryptocurrency market is driven by the possibility that the US government shutdown may be coming to an end, as the US Senate voted 60-40 on a temporary funding bill to reopen the government. This will need to be passed by the House of Representatives before being sent to US President Donald Trump to be signed.
Despite the positive flows, the decreasing magnitude of daily net inflows suggests that the institutional demand could be at risk.
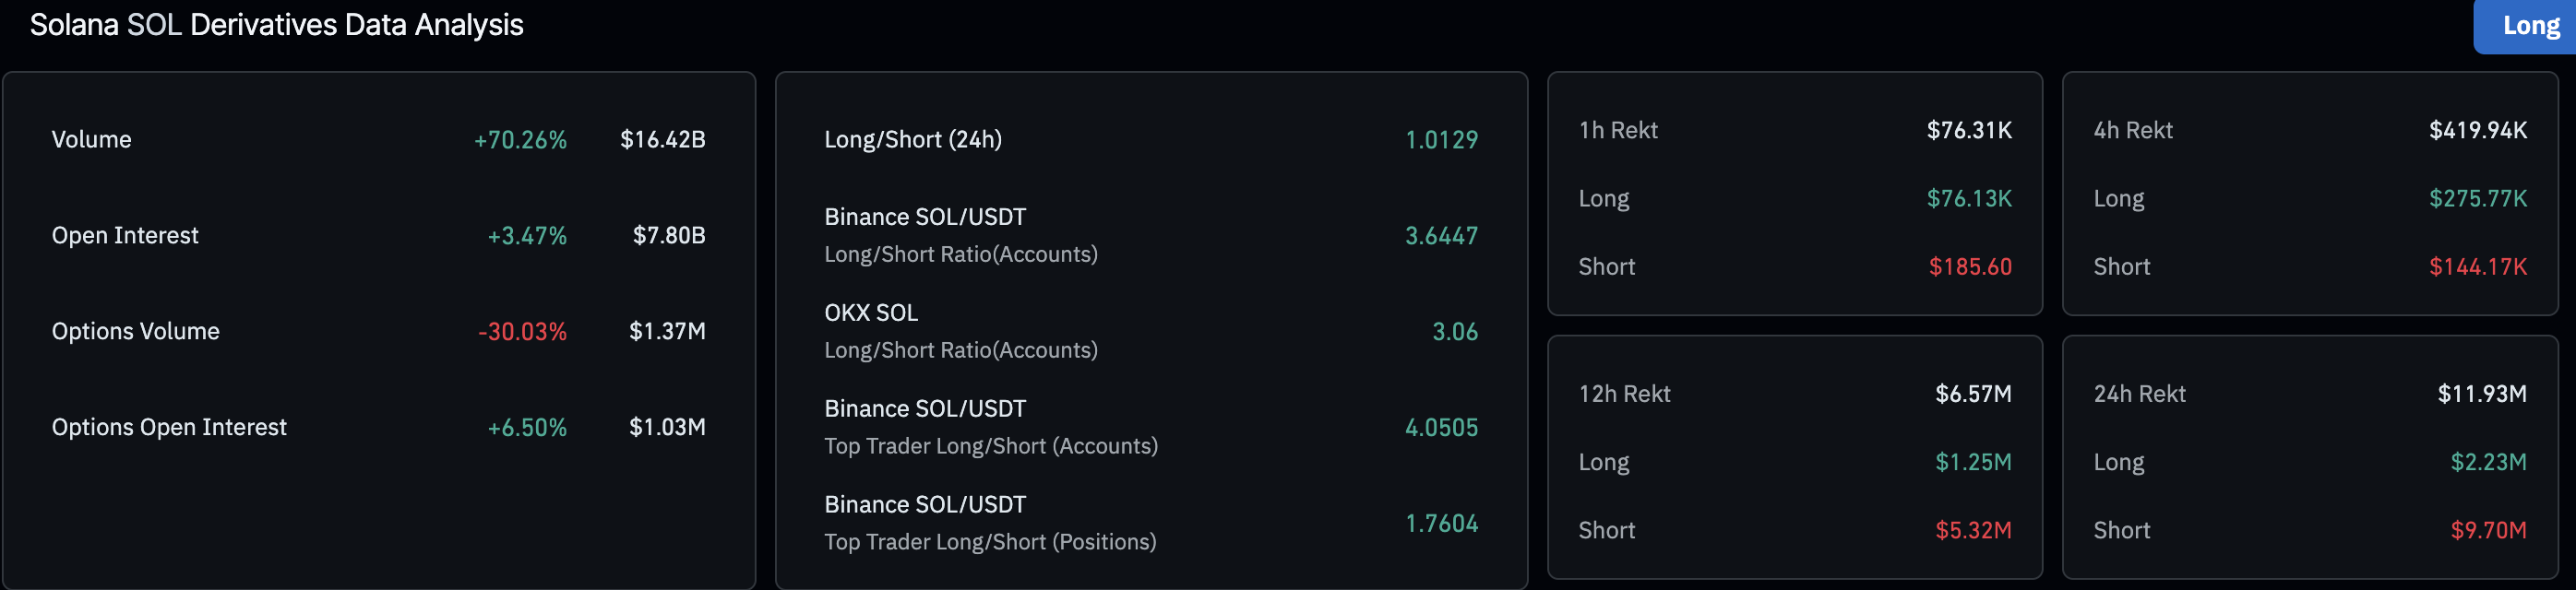
Meanwhile, the Solana derivatives experience an increase in capital inflows due to renewed bullish interest in the market. CoinGlass data shows that the SOL futures Open Interest (OI) has increased by 3.47% over the last 24 hours to $7.80 billion. This suggests that traders are establishing long positions or increasing their leverage.
Furthermore, the short liquidations of $9.70 million in the same time period outpace the long liquidations of $2.23 million, indicating a wipeout of largely bearish positions.
Technical outlook: Will Solana’s recovery hit $200?
Solana marks the second consecutive bullish candle on the daily chart, extending the rebound from $155 support zone on Sunday. The recovery run in SOL targets a broken trendline and the $175 zone from last week.
A decisive close above this zone could test the 200-day Exponential Moving Average (EMA) at $185, followed by the $200 round figure.
The technical indicators on the daily chart suggest that the recovery run is gaining traction as the Relative Strength Index (RSI) is at 41, rising from the oversold zone, indicating a decline in selling pressure. At the same time, the Moving Average Convergence Divergence (MACD) approaches the signal line, preparing for a crossover which could confirm a renewed bullish momentum.
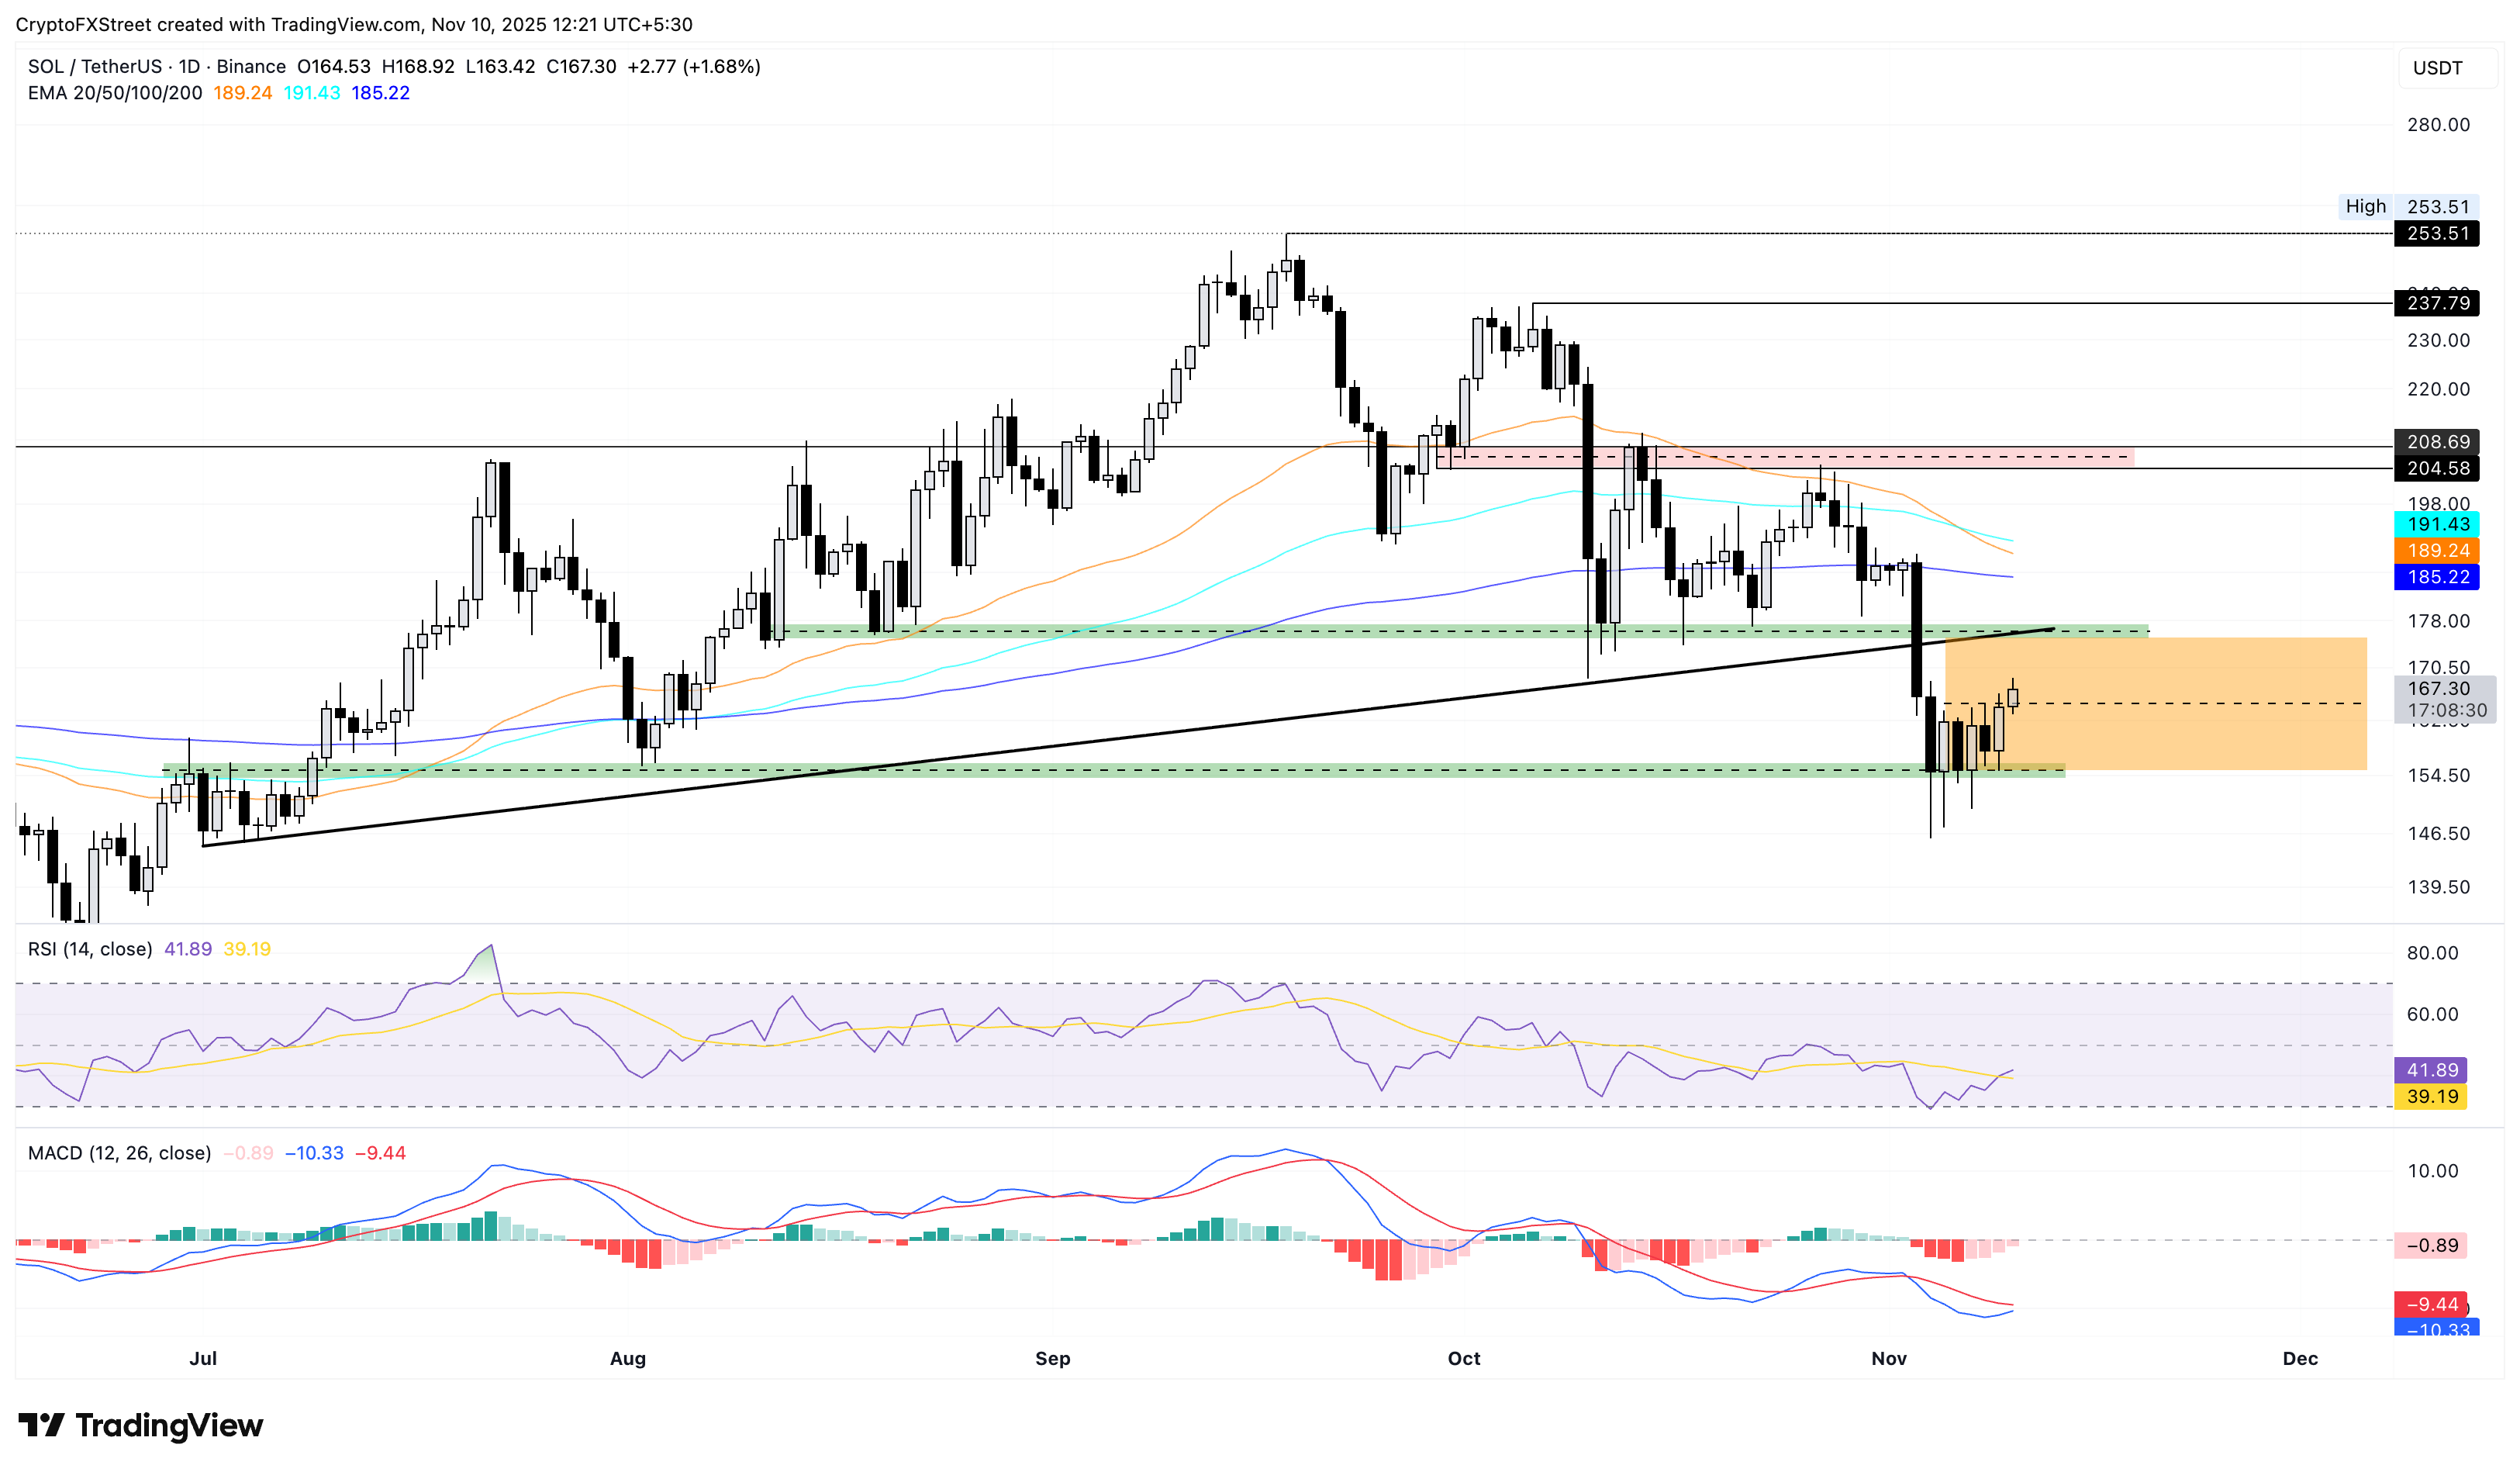
However, if the SOL recovery flips midway, it could threaten the $155 support zone.

FXStreet
超過一百萬用戶依賴 FXStreet 獲取即時市場數據、圖表工具、專家洞見與外匯新聞。其全面的經濟日曆與教育網路研討會協助交易者保持資訊領先、做出審慎決策。FXStreet 擁有約 60 人的團隊,分布於巴塞隆納總部及全球各地。
Read More


