
Trade The World
SPX, VIRTUAL, PENDLE lead the fall amid Bitcoin’s third major profit booking
作者 Vishal Dixit
發布日期: 1 Aug 2025 | 修改日期: 1 Aug 2025


POPULAR ARTICLES

SPX6900 (SPX), Virtuals Protocol (VIRTUAL), and Pendle (PENDLE) are leading the broader cryptocurrency market pullback on Friday, underpinned by a major sell-off move in Bitcoin (BTC).
- SPX6900 meme coin nears the 50-day EMA after four consecutive days of losses.
- Virtuals Protocol hits a three-month low as its decline penetrated the $1.27 support.
- Pendle falls below $4, risking the 200-day EMA support as momentum shifts bearish.
SPX6900 (SPX), Virtuals Protocol (VIRTUAL), and Pendle (PENDLE) are leading the broader cryptocurrency market pullback on Friday, underpinned by a major sell-off move in Bitcoin (BTC).
The crypto market turns red amid the third major profit-booking wave this bullish season, as reported by CryptoQuant. The report highlights realized profits reaching $6 billion to $8 billion in late July, mainly driven by new investors.
SPX6900 meme coin risks a steeper correction
SPX edges higher by nearly 1% at press time on Friday after four consecutive days of losses. The uptick holds the meme coin above its 50-day Exponential Moving Average (EMA) at $1.55.
The Moving Average Convergence Divergence (MACD) indicator has held a sell signal since Wednesday, marked by the resurgence of red histogram bars below the zero line. If investors continue to exit or increase their bearish exposure, the SPX could extend the decline to the 100-day EMA at $1.29.
Traders should consider tempering bullish expectations, as the Relative Strength Index (RSI) stands at 46 on the daily chart, indicating a decline in buying pressure.
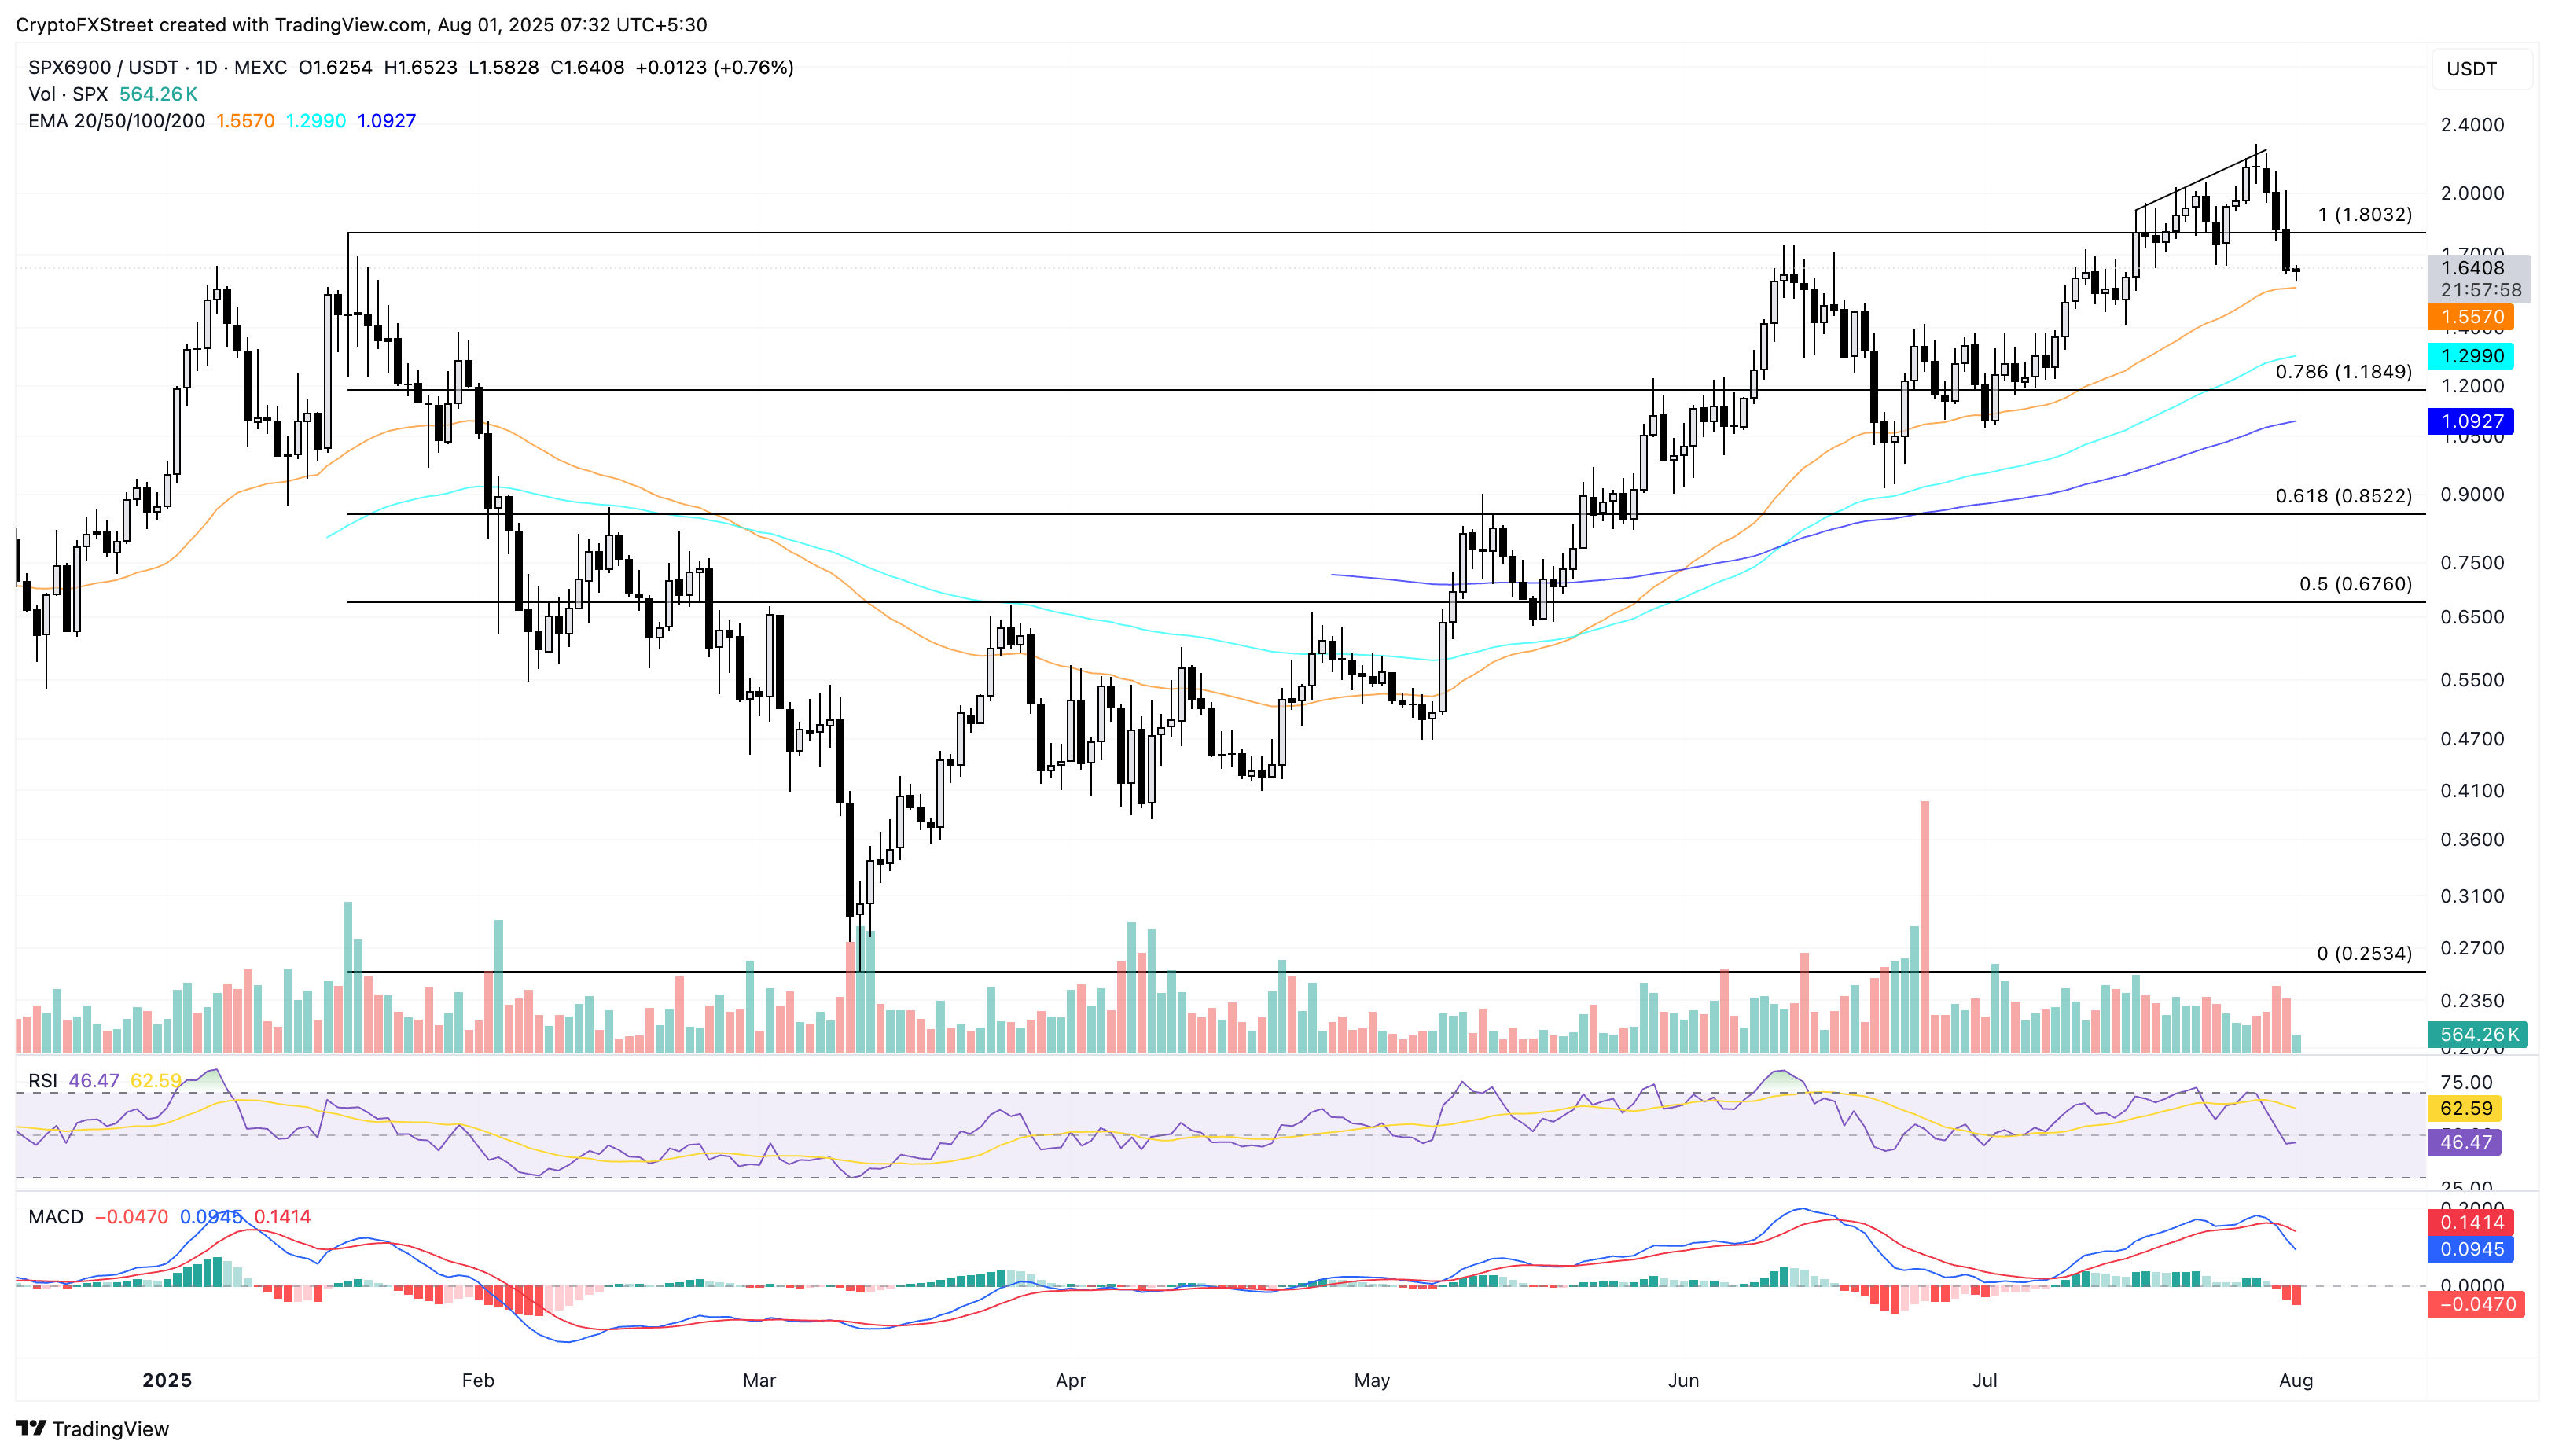
SPX/USDT daily price chart.
On the contrary, a bounce back in SPX could test the $1.80 peak marked on January 19.
VIRTUAL extends the downfall as selling pressure grows
Virtuals Protocol edges lower by over 1% at the time of writing, extending the downtrend for the fifth consecutive day. A nearly 12% drop on July 23, from a resistance trendline formed by connecting the January 2 and May 27 peaks, ignited the ongoing decline.
VIRTUAL falls below the $1.27 support level last tested on Wednesday, underpinned by a potential Death Cross between the declining 50-day and 200-day EMAs. The bearish run targets the $1.04 support level, last tested on April 28.
The technical indicators back the downtrend as the MACD indicator displays successive rises in red histogram bars, and the RSI reading of 31 on the daily chart stands close to the oversold boundary line.
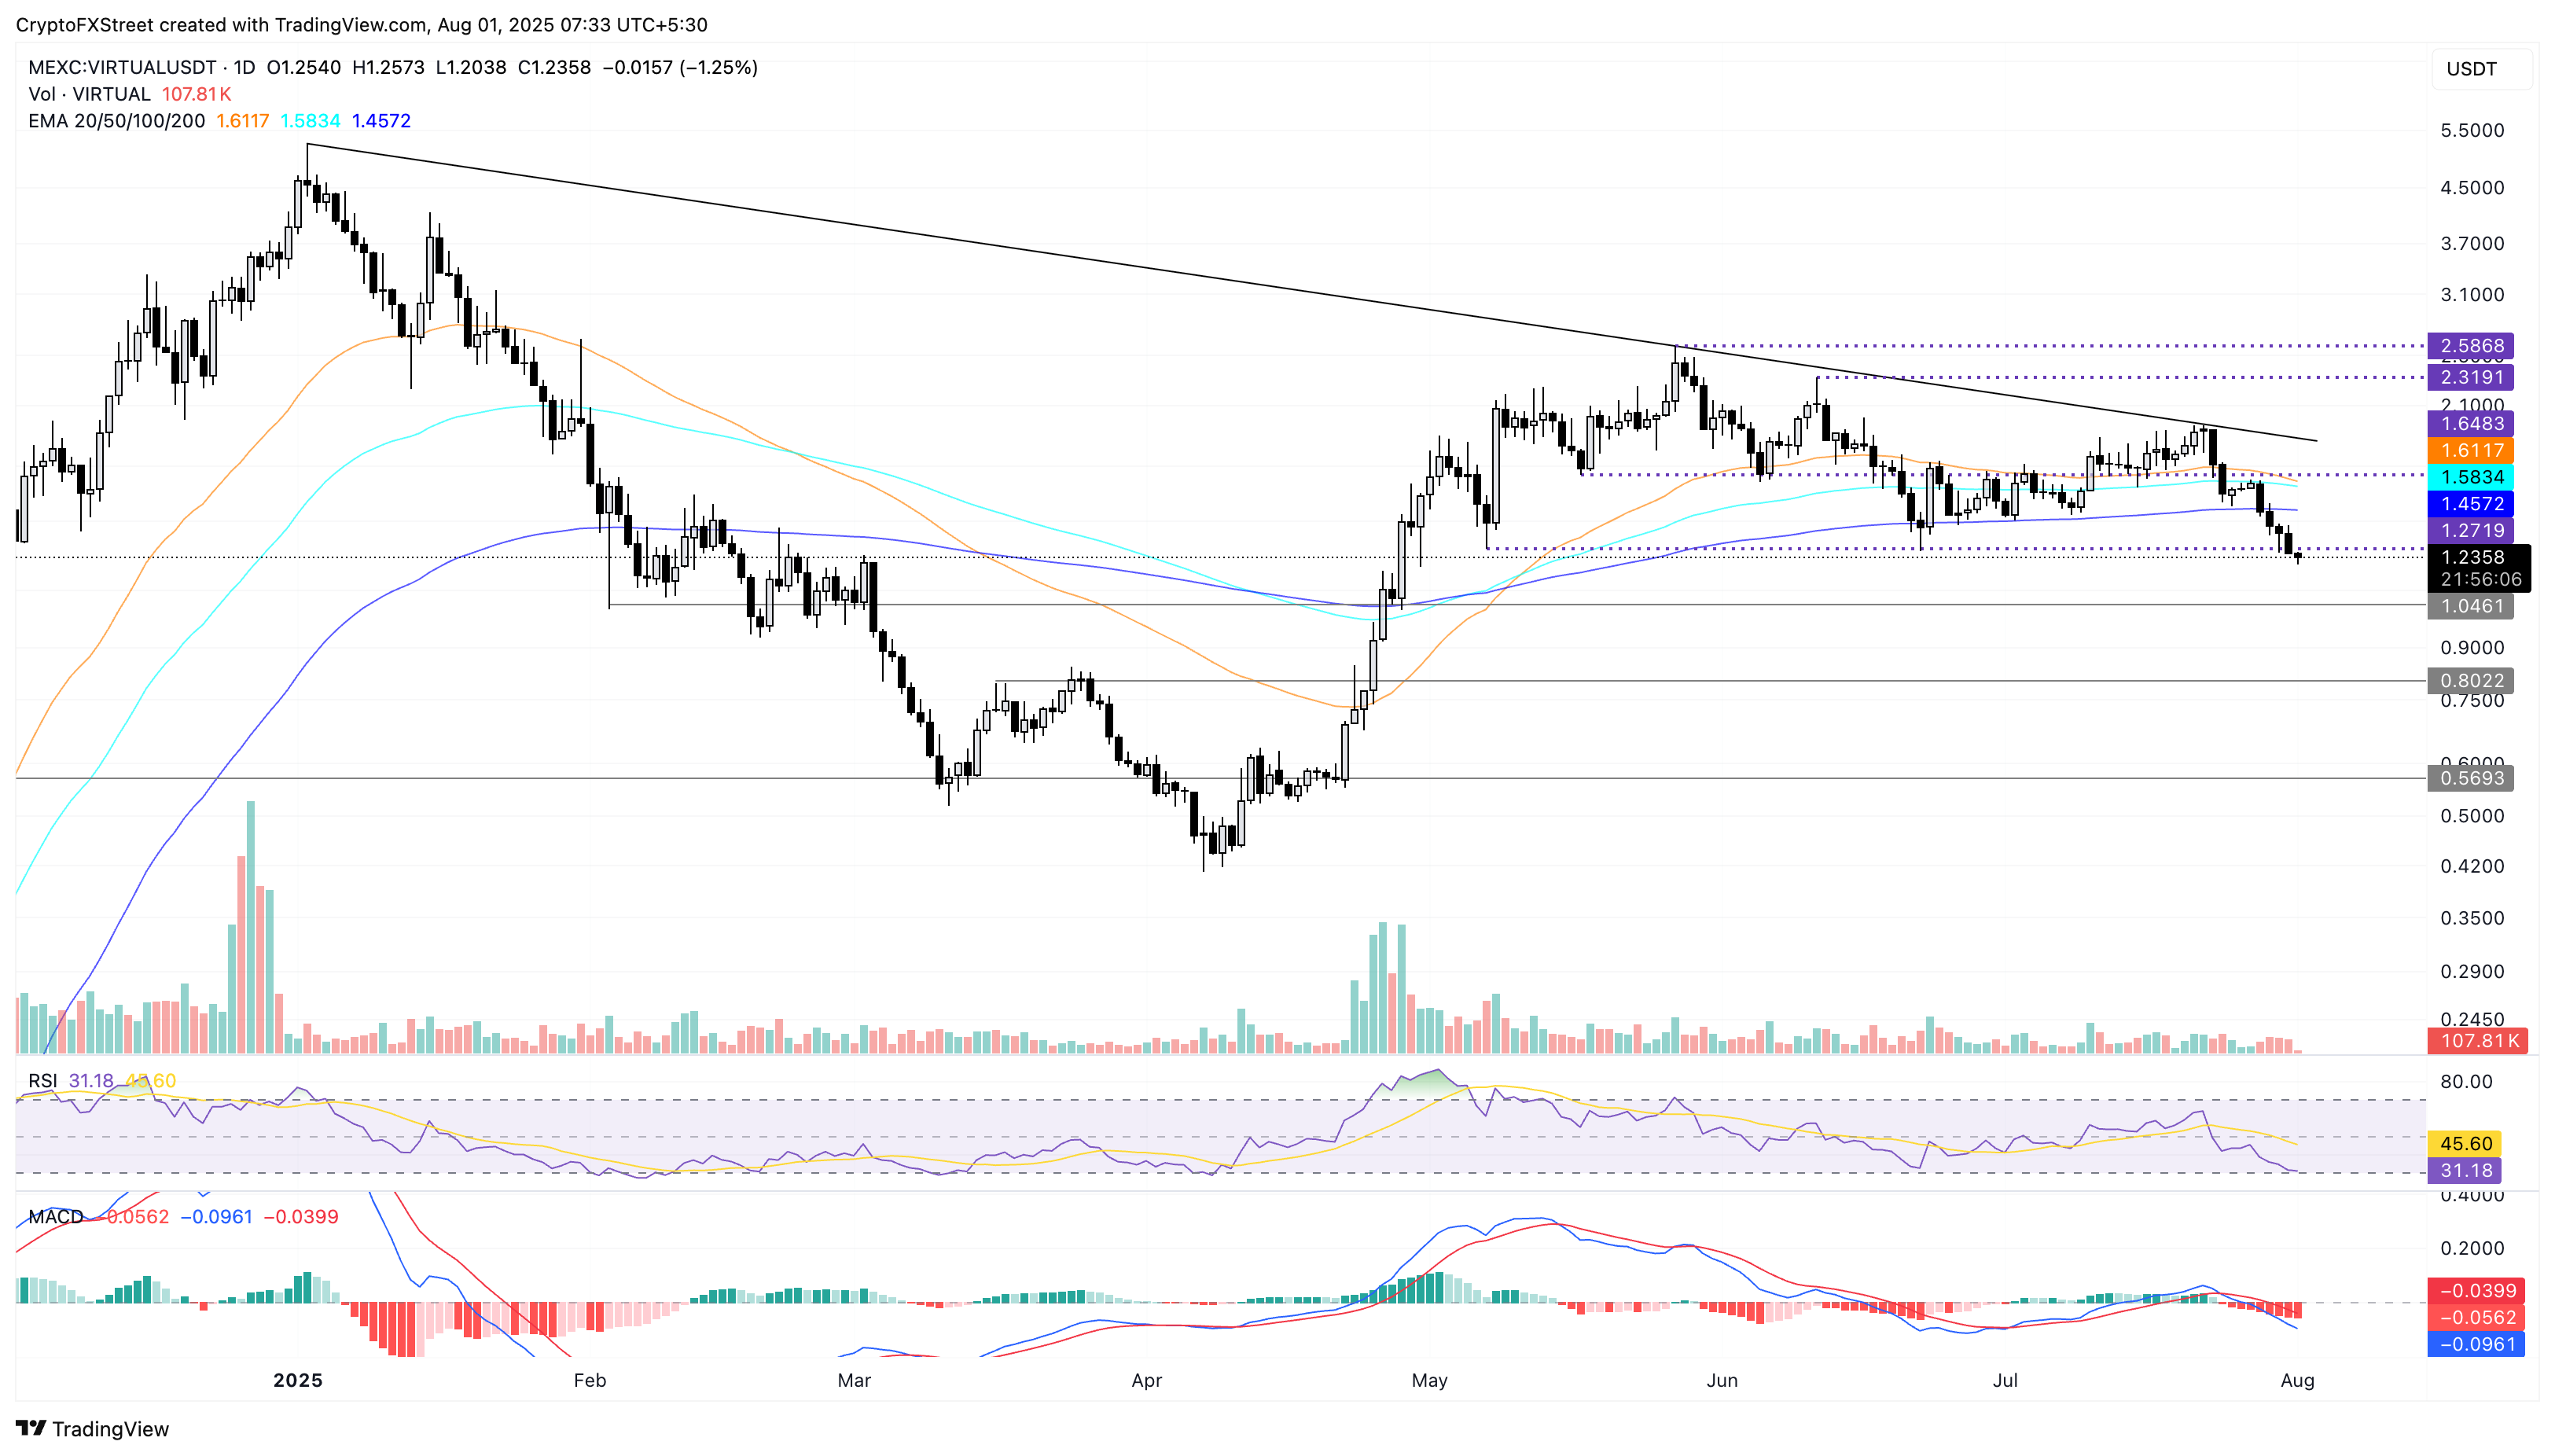
VIRTUAL/USDT daily price chart.
If VIRTUAL resurfaces above the $1.27 support level, it could extend a recovery run to the 200-day EMA at $1.45.
PENDLE struggles below the 50-day EMA
Pendle edges lower by over 1% at press time to trade at $3.98. The downfall has crossed below the 50-day EMA at $4.05, underpinned by the MACD indicator, which flashed a sell signal on Tuesday.
Investors may consider the advancing trend, indicated by the red histogram bars, as a sign of increasing bearish momentum. Furthermore, the RSI drops below its halfway line to 44, pointing to a steep decline in buying pressure.
The 200-day EMA at $3.82 remains a strong dynamic support for PENDLE. Sellers could consider a decisive close below this support as an entry opportunity, with targets set at $3.59 support level.
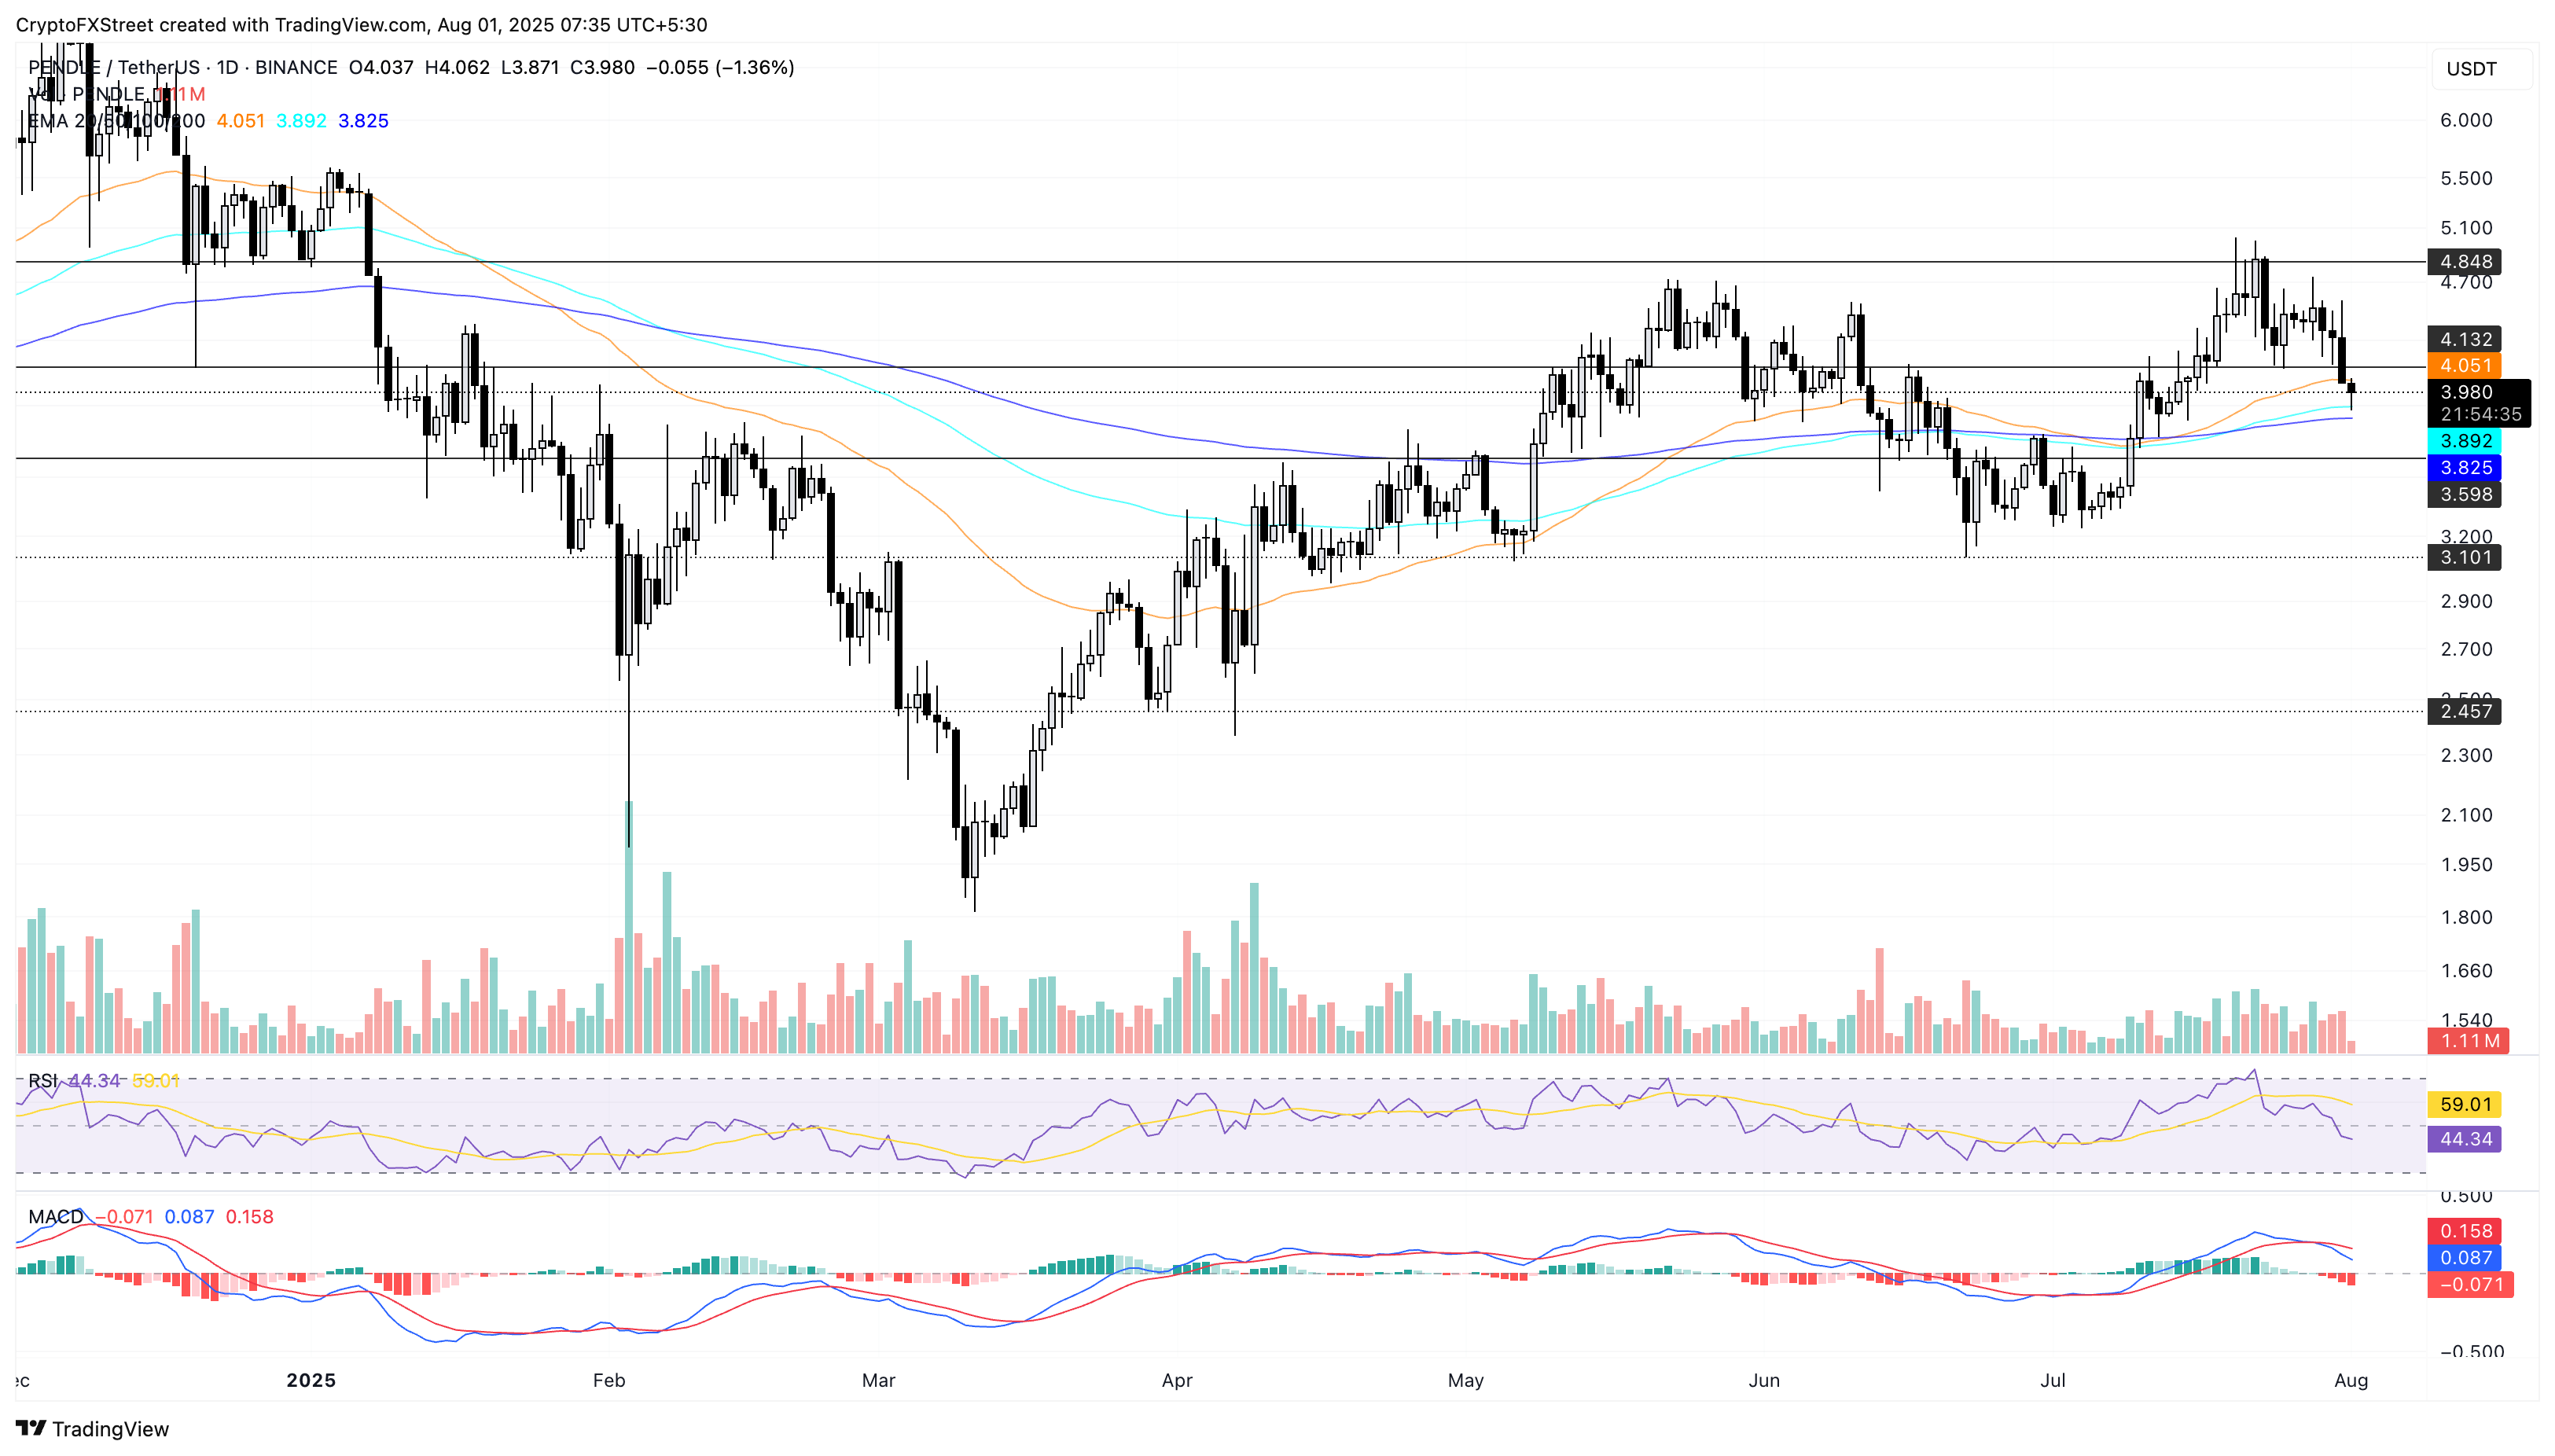
PENDLE/USDT daily price chart.
On the other hand, a reversal of the PENDLE token above the $4.13 level, last tested on Wednesday, could extend the rally to the weekly high of $4.73.

FXStreet
超過一百萬用戶依賴 FXStreet 獲取即時市場數據、圖表工具、專家洞見與外匯新聞。其全面的經濟日曆與教育網路研討會協助交易者保持資訊領先、做出審慎決策。FXStreet 擁有約 60 人的團隊,分布於巴塞隆納總部及全球各地。
Read More


