
Trade The World
Top 3 Price Prediction: Bitcoin, Ethereum, Ripple – BTC, ETH, and XRP continue to crash as market bears take control
作者 Manish Chhetri
發布日期: 21 Nov 2025 | 修改日期: 21 Nov 2025


POPULAR ARTICLES

Bitcoin (BTC), Ethereum (ETH) and Ripple (XRP) continued their downward trajectory on Friday, slipping more than 8%, 9% and 10% respectively so far this week.BTC slips below $86,000, Ethereum falls under $2,900, and XRP drops below $2, highlighting a deepening correction as bearish momentum gains co
- Bitcoin continues to trade in the red on Friday after correcting by more than 8% so far this week.
- Ethereum price dips below $2,900, signaling potential for further downside.
- XRP slips below $2, suggesting a deeper correction amid intensifying bearish pressure.
Bitcoin (BTC), Ethereum (ETH) and Ripple (XRP) continued their downward trajectory on Friday, slipping more than 8%, 9% and 10% respectively so far this week.BTC slips below $86,000, Ethereum falls under $2,900, and XRP drops below $2, highlighting a deepening correction as bearish momentum gains control across the top three cryptocurrencies. Traders should keep an eye on key support levels to see whether a short-term rebound is possible or whether the current sell-off will extend.
Bitcoin slips below $86,000
Bitcoin began the week on a bearish footing, extending its decline by 2% and closing below the 61.8% Fibonacci retracement level at $94,253 (drawn from the April 7 low of $74,508 to the all-time high of $126,299 set on October 6). However, BTC found support at the $90,000 psychological level and consolidated there for the next two days. On Thurday, BTC continued its correction, falling more than 5% to slide below $90,000 and closing the day at $86,637. At the time of writing on Friday, BTC is trading down around 85,900.
If the closes below the $85,000 support on a daily basis, it could extend the decline toward the key psychological level at $80,000.
The Relative Strength Index (RSI) on the daily chart stands at 23, indicating strong bearish momentum and oversold conditions for Bitcoin.
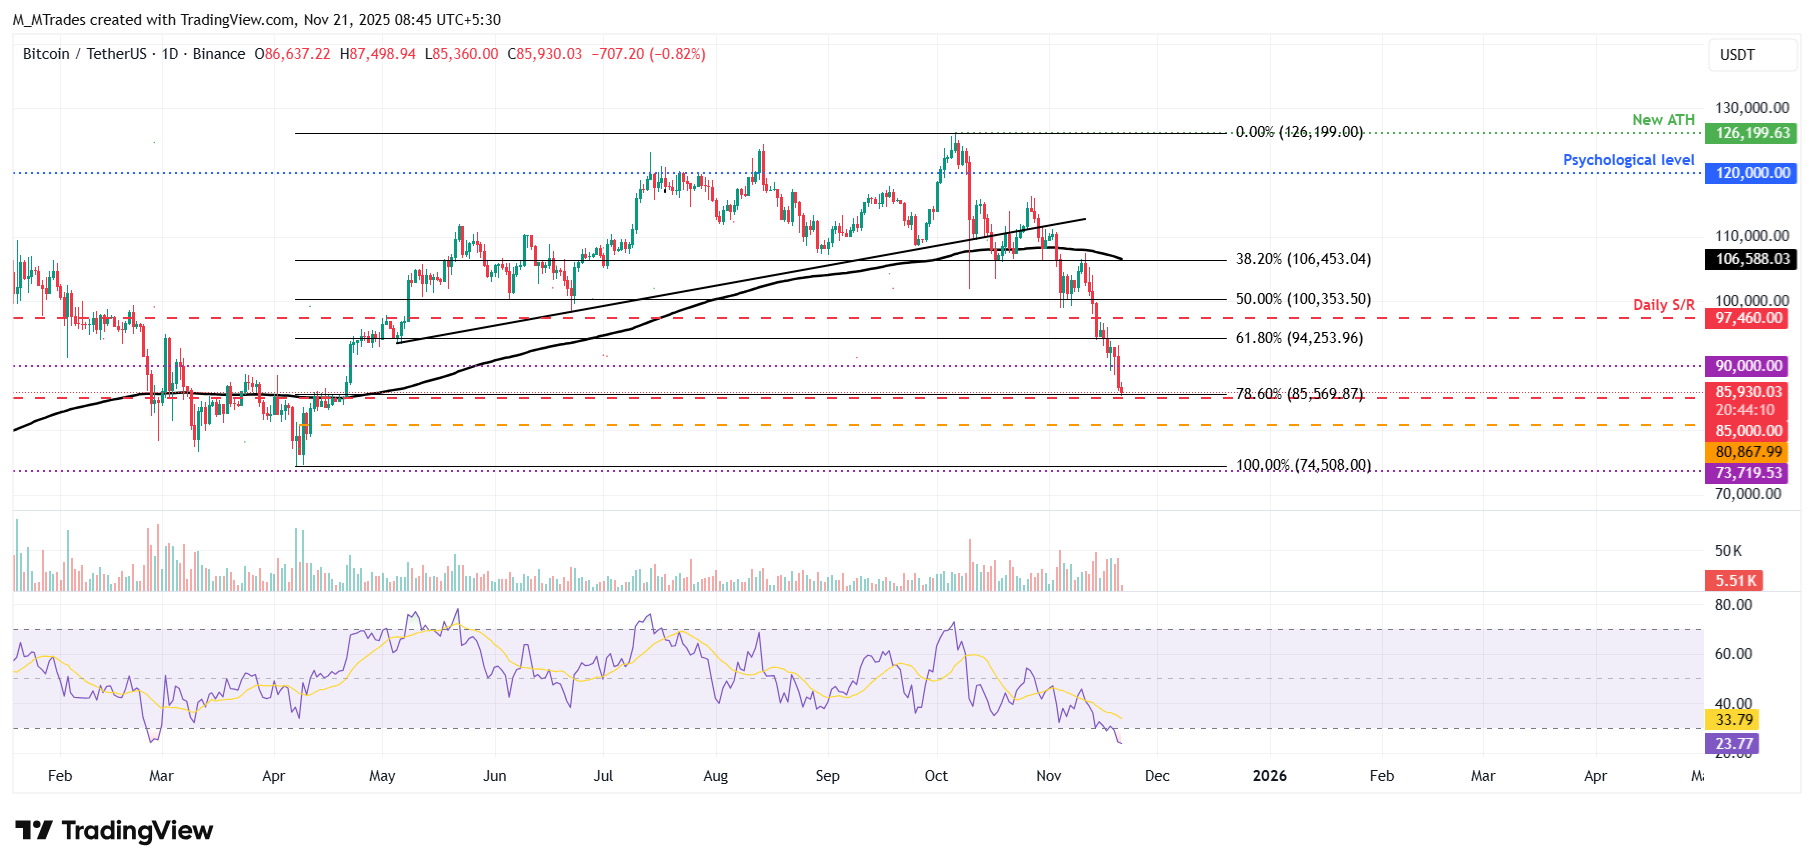
On the other hand, if BTC finds support around the $85,000, it could extend the recovery toward the next key resistance at $90,000.
Ethereum could extend its decline as it closes below $3,017 support level
Ethereum price faced rejection at the previous broken trendline around $3,592 last week and declined by nearly 14%. ETH continued its correction, down 9.38% by Thursday, and closed below the key support at $3,017. At the time of writing on Friday, ETH continues its correction, trading below $2,791.
If ETH continues its downward trend, it could extend the correction toward the 61.8% Fibonacci retracement at $2,749.
Like Bitcoin, ETH’s RSI also shows strong bearish momentum.
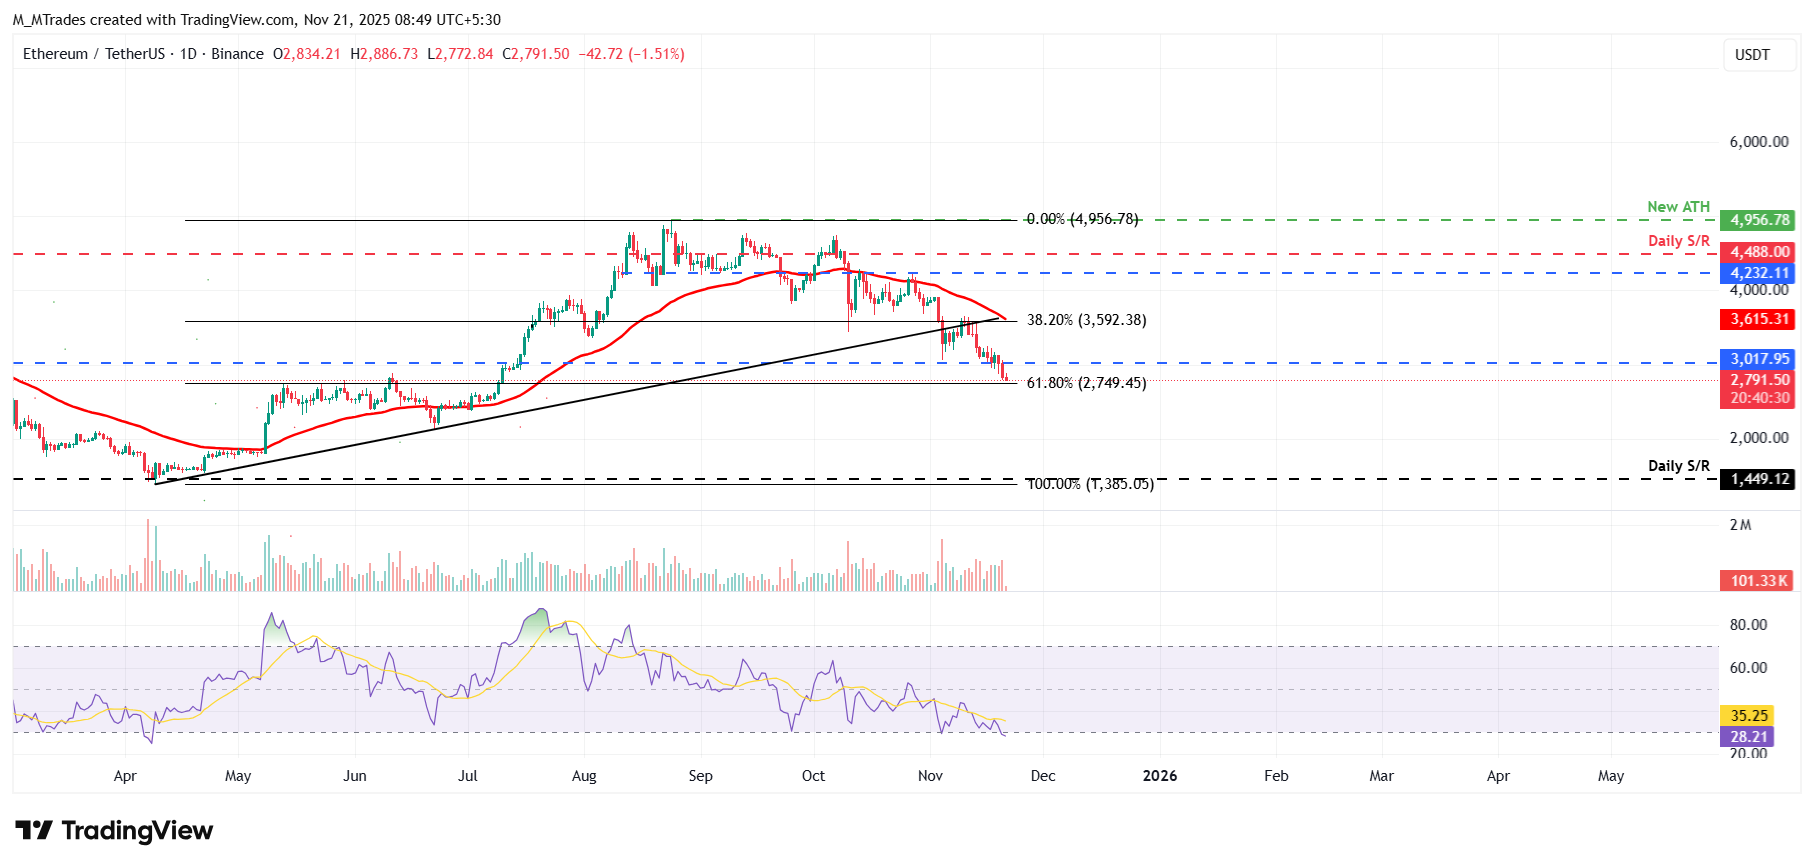
On the other hand, if ETH recovers, it could extend gains toward the next resistance level at $3,017.
XRP shows bearish signs in the momentum indicator
XRP price found rejection from the 50-day EMA at $2.47 last week and declined nearly 7%. XRP continued its correction on Monday, sliding more than 10% until Thursday. At the time of writing on Friday, XRP is trading below $1.99.
If XRP continues its downward trend, it could extend the decline toward the next key support at $1.77.
The RSI on the daily chart is 32, indicating strong bearish momentum and nearing oversold conditions.
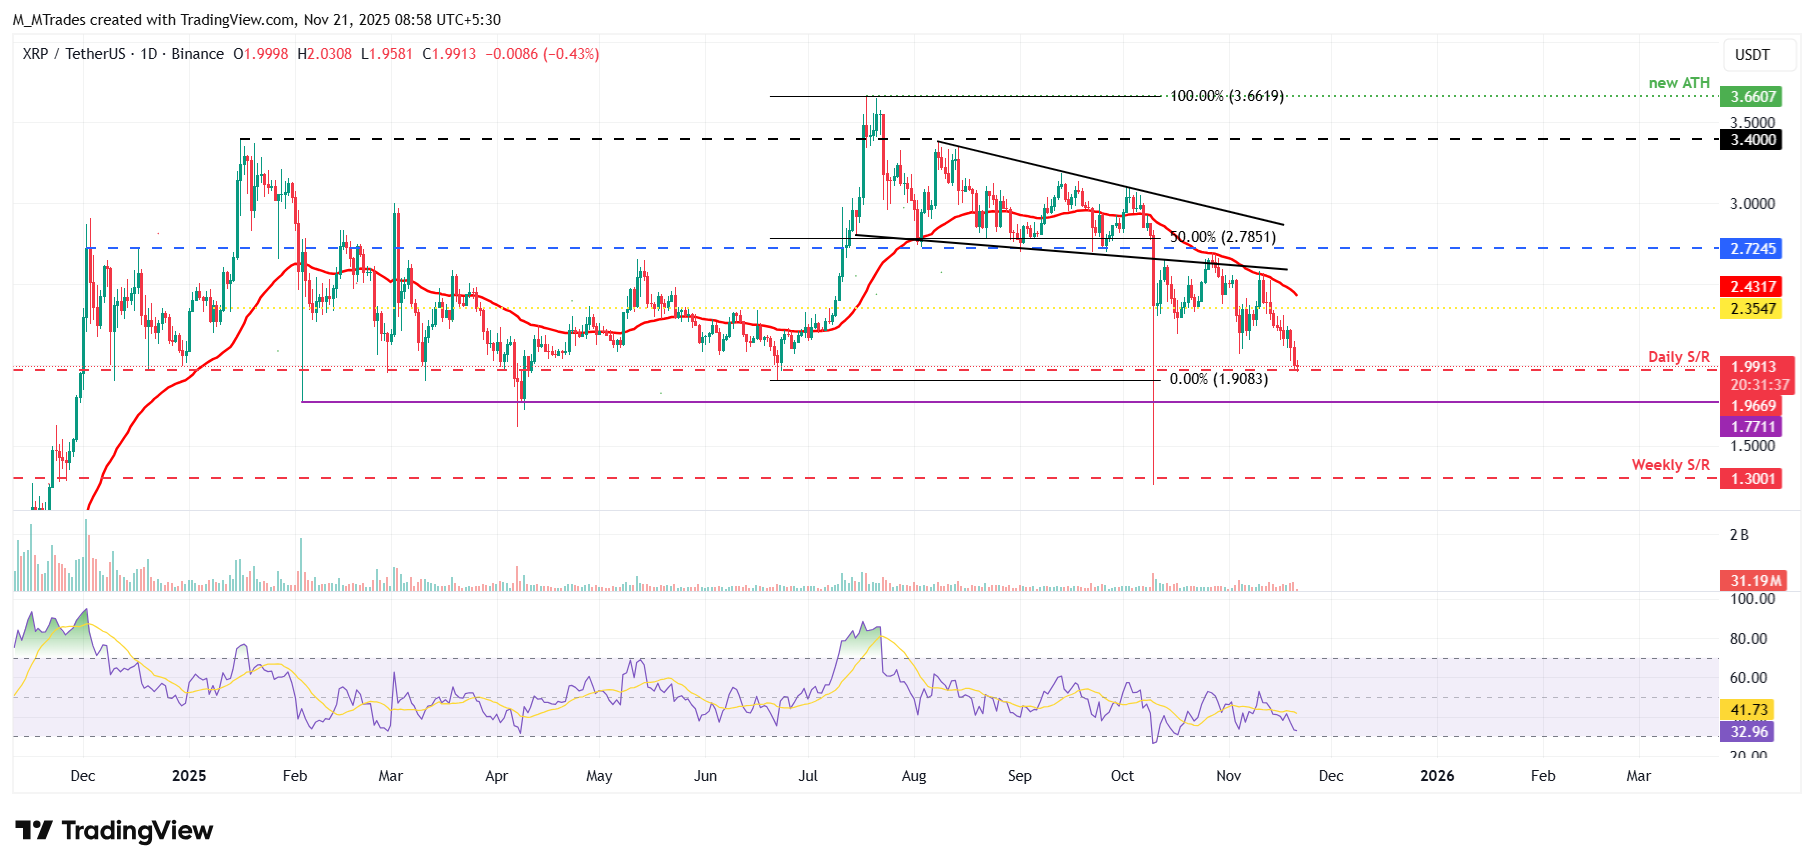
On the other hand, if XRP recovers, it could extend gains toward the daily resistance at $2.35.
Cryptocurrency metrics FAQs
The developer or creator of each cryptocurrency decides on the total number of tokens that can be minted or issued. Only a certain number of these assets can be minted by mining, staking or other mechanisms. This is defined by the algorithm of the underlying blockchain technology. On the other hand, circulating supply can also be decreased via actions such as burning tokens, or mistakenly sending assets to addresses of other incompatible blockchains.
Market capitalization is the result of multiplying the circulating supply of a certain asset by the asset’s current market value.
Trading volume refers to the total number of tokens for a specific asset that has been transacted or exchanged between buyers and sellers within set trading hours, for example, 24 hours. It is used to gauge market sentiment, this metric combines all volumes on centralized exchanges and decentralized exchanges. Increasing trading volume often denotes the demand for a certain asset as more people are buying and selling the cryptocurrency.
Funding rates are a concept designed to encourage traders to take positions and ensure perpetual contract prices match spot markets. It defines a mechanism by exchanges to ensure that future prices and index prices periodic payments regularly converge. When the funding rate is positive, the price of the perpetual contract is higher than the mark price. This means traders who are bullish and have opened long positions pay traders who are in short positions. On the other hand, a negative funding rate means perpetual prices are below the mark price, and hence traders with short positions pay traders who have opened long positions.

FXStreet
超過一百萬用戶依賴 FXStreet 獲取即時市場數據、圖表工具、專家洞見與外匯新聞。其全面的經濟日曆與教育網路研討會協助交易者保持資訊領先、做出審慎決策。FXStreet 擁有約 60 人的團隊,分布於巴塞隆納總部及全球各地。
Read More


