
Trade The World
Top 3 Price Prediction: Bitcoin, Ethereum, Ripple – BTC, ETH, and XRP rebound after recent downside pressure
作者 Manish Chhetri
發布日期: 24 Nov 2025 | 修改日期: 24 Nov 2025


POPULAR ARTICLES

Bitcoin (BTC), Ethereum (ETH), and Ripple (XRP) begin the week with a modest recovery on Monday after last week’s massive correction. These top three cryptocurrencies are holding above their key support levels, suggesting recovery continuation.
- Bitcoin price holds above $86,500 on Monday after a slight weekend recovery following last week’s steep correction.
- Ethereum price finds support around $2,749, a breakdown below this level is likely to trigger further downside.
- XRP price rebounds after retesting the $1.966 daily support.
Bitcoin (BTC), Ethereum (ETH), and Ripple (XRP) begin the week with a modest recovery on Monday after last week’s massive correction. These top three cryptocurrencies are holding above their key support levels, suggesting recovery continuation. However, broader market sentiment remains fragile, and any upside could face near-term resistance.
Bitcoin recovers slightly after a massive correction
Bitcoin price faced rejection at $106,453 on November 11 and has declined more than 20% over the past 12 days, reaching a low of $80,600 last Friday. BTC managed a mild rebound over the weekend, closing above $86,830 on Sunday. At the time of writing on Monday, BTC is recovering, trading above $87,700.
If BTC continues its recovery, it could extend the rally toward the next key resistance at $90,000.
The Relative Strength Index (RSI) on the daily chart reads 30, after slipping below the oversold threshold last week, suggesting that downside pressure may be moderating as bearish momentum shows early signs of exhaustion.
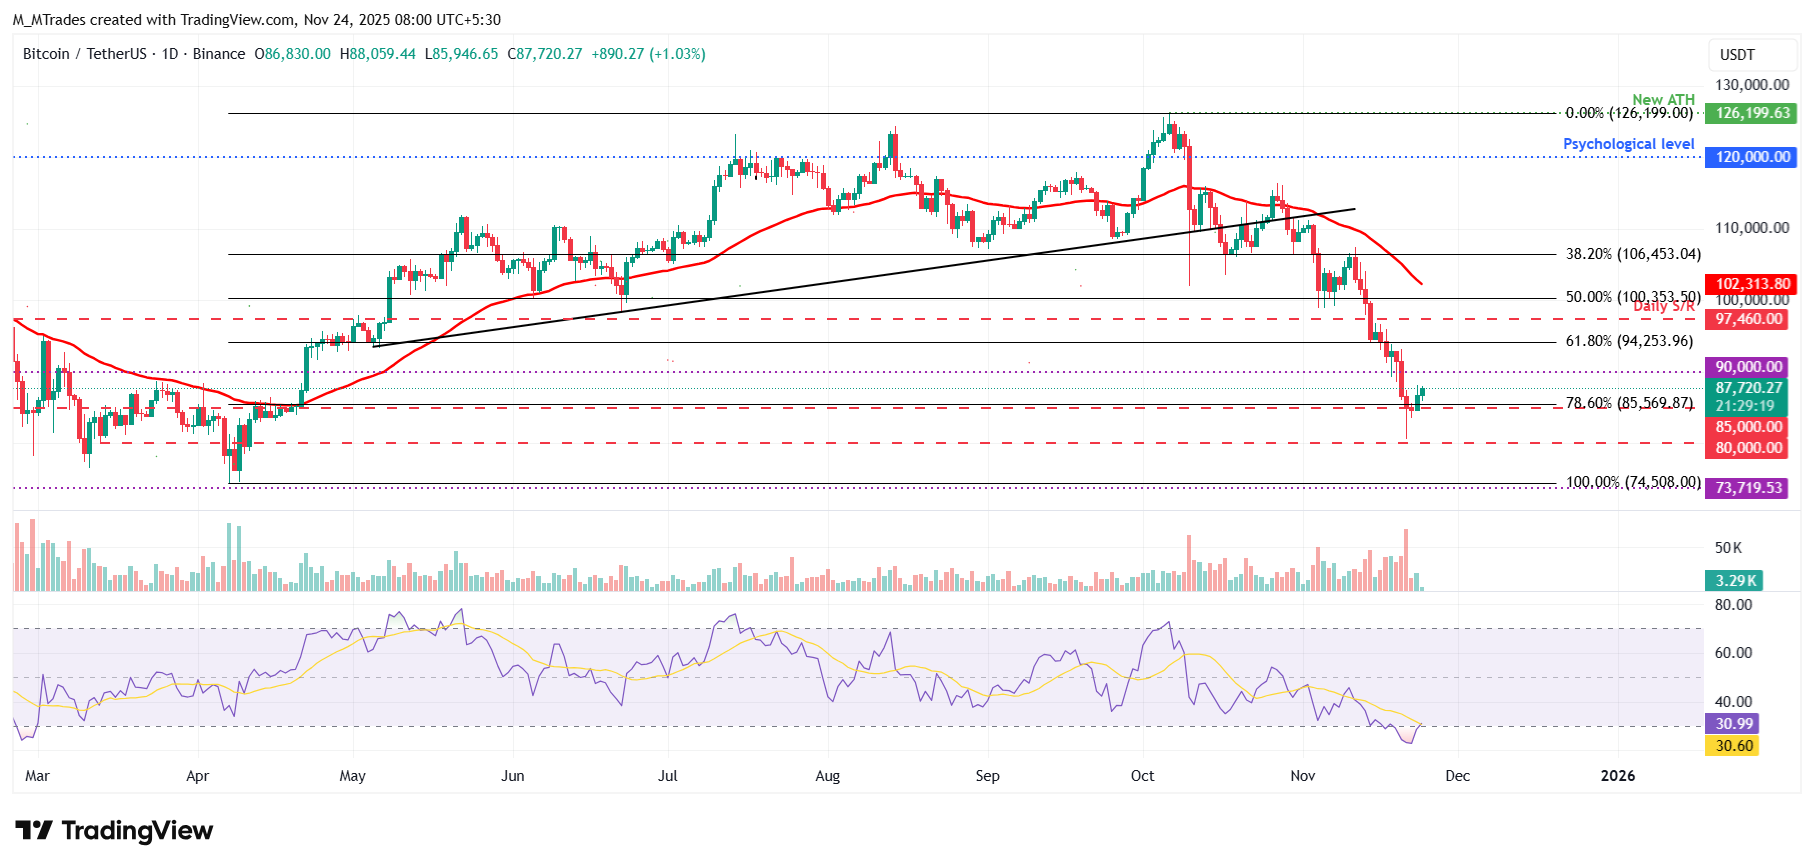
On the other hand, if BTC faces a correction, it could extend the decline toward the key psychological level at $80,000.
Ethereum rebounds after retesting the key support zone
Ethereum price faced rejection at the previously broken trendline on November 13 and declined more than 18% over the following 8 days, reaching a low of $2,623 on Friday. ETH saw a mild weekend rebound, finding support near the 61.8% Fibonacci retracement level at $2,749. At the time of writing on Monday, ETH is recovering, trading above $2,840.
If ETH continues its recovery, it could extend the rally toward the daily resistance level at $3,017.
Like Bitcoin, Ethereum's RSI is rebounding from oversold territory, suggesting early signs of exhaustion and a potential recovery ahead.
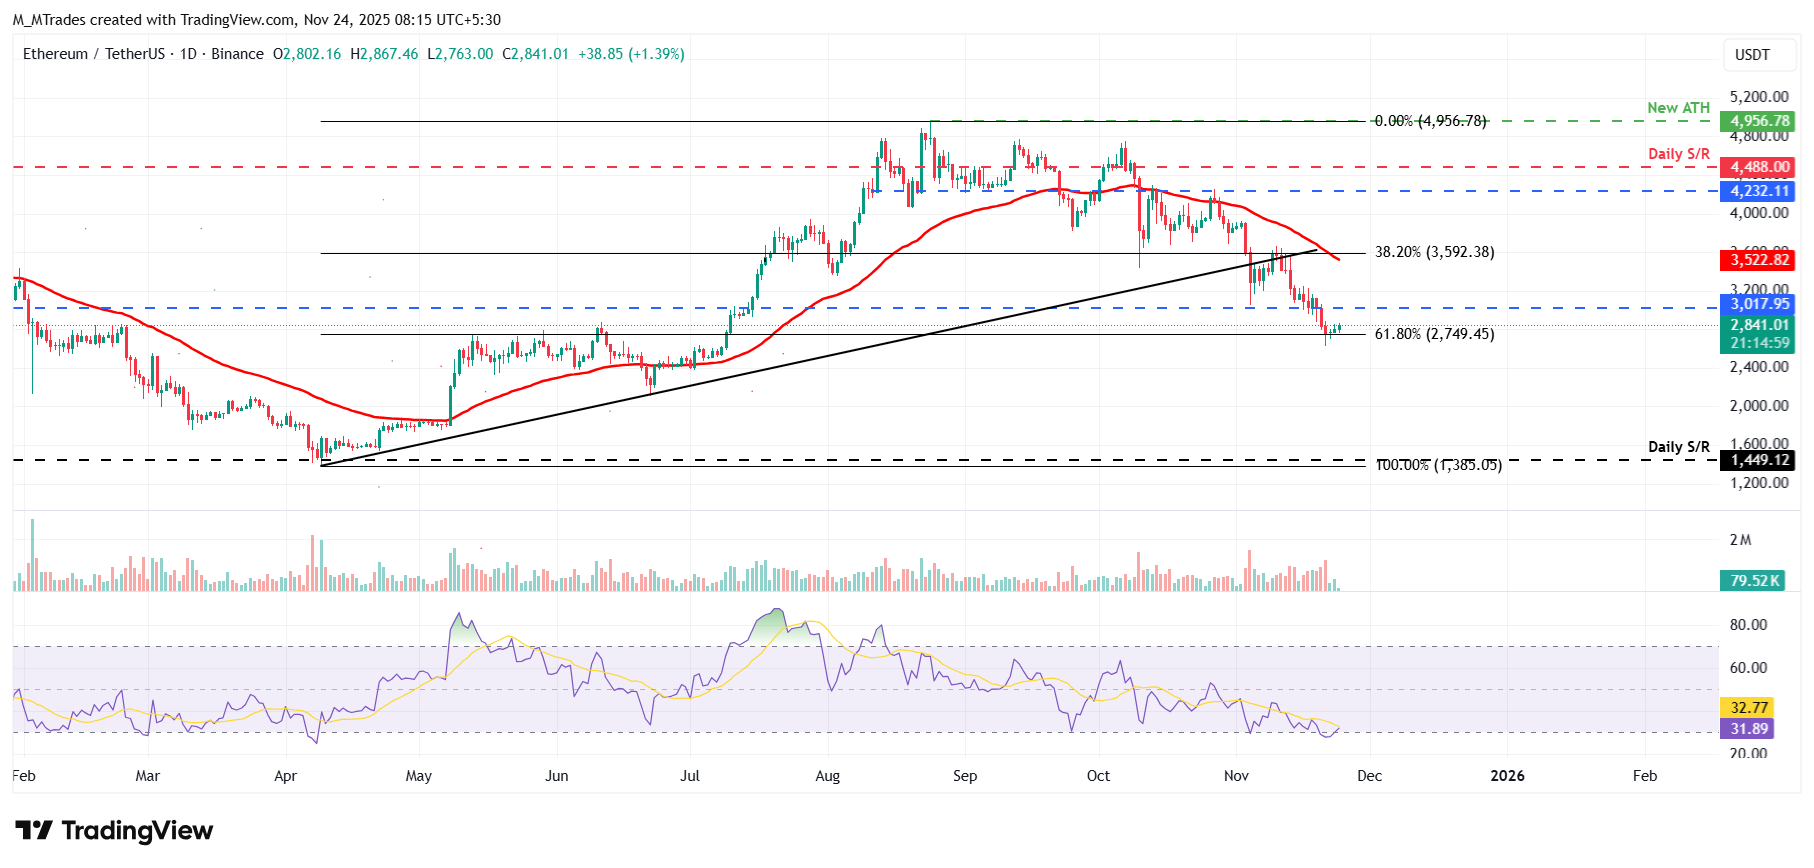
On the other hand, if ETH faces a correction, it could extend the decline toward the key support level at $2,749.
XRP recovers after finding support at $1.96 level
XRP price found rejection from the 50-day EMA at $2.38 on November 13 and declined nearly 19% in the following 8 days, reaching a low of $1.82 on Friday. XRP rebounded slightly after resting its daily support level at $1.96 over the weekend. At the time of writing on Monday, XRP is recovering, trading above $2.08.
If XRP continues its recovery, it could extend the rally toward the next daily resistance level at $2.35.
The RSI reads 41, rebounding from oversold territory last week, suggesting that bearish pressure is easing and supporting a recovery view.
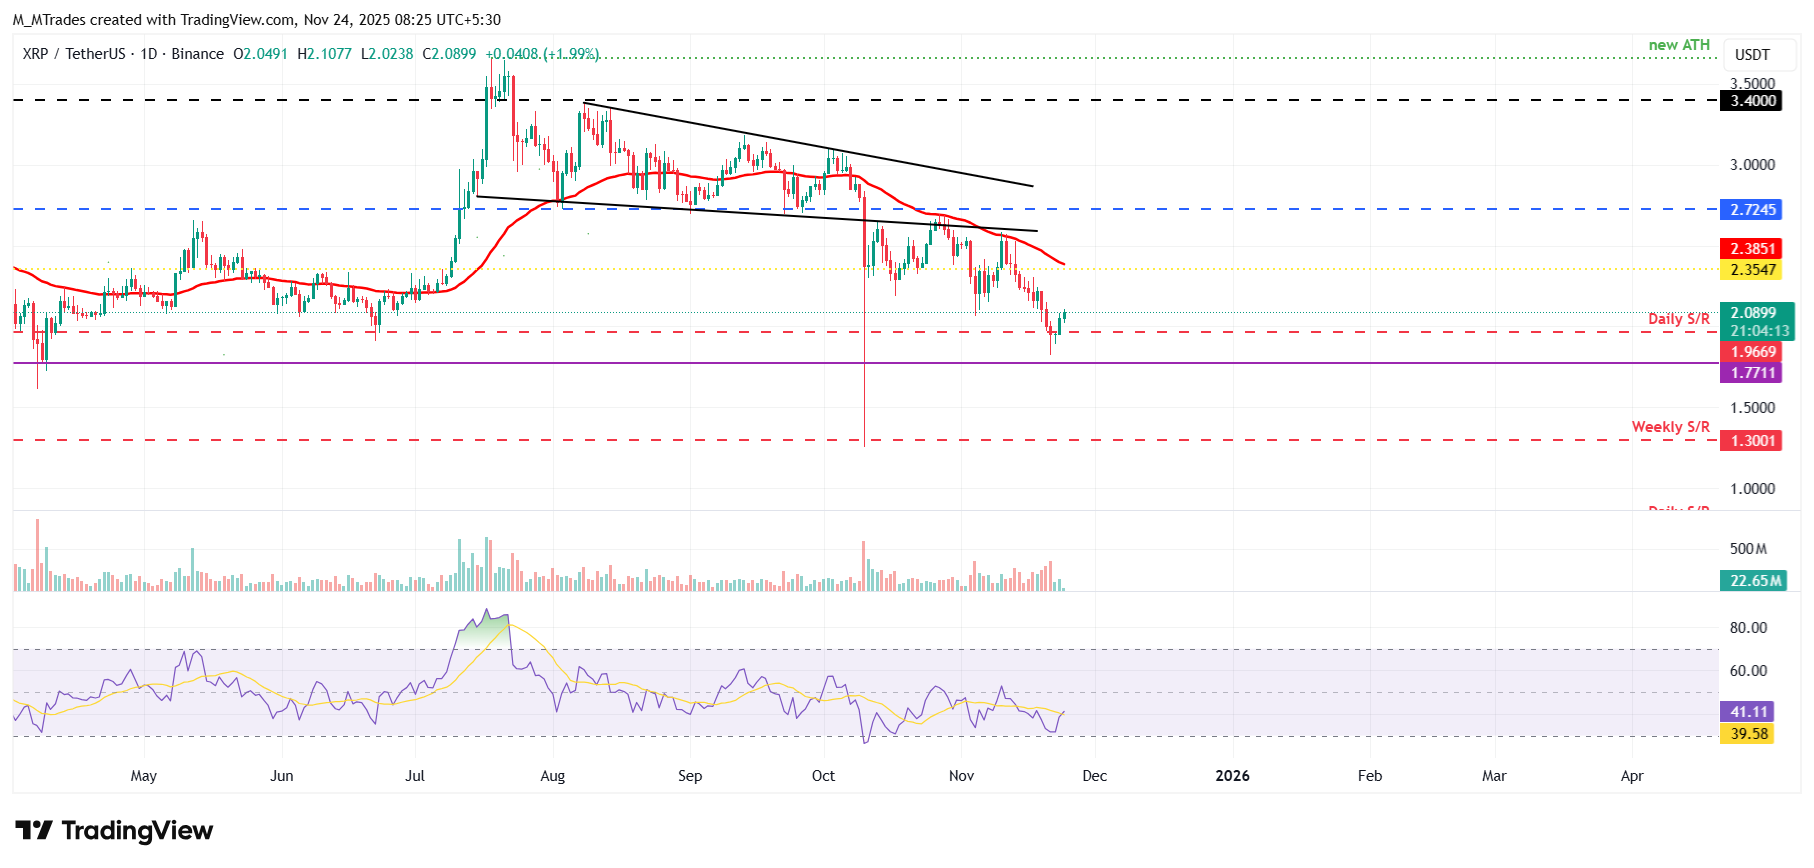
On the other hand, if XRP corrects, it could extend the decline toward the Friday low of $1.82.
Cryptocurrency metrics FAQs
The developer or creator of each cryptocurrency decides on the total number of tokens that can be minted or issued. Only a certain number of these assets can be minted by mining, staking or other mechanisms. This is defined by the algorithm of the underlying blockchain technology. On the other hand, circulating supply can also be decreased via actions such as burning tokens, or mistakenly sending assets to addresses of other incompatible blockchains.
Market capitalization is the result of multiplying the circulating supply of a certain asset by the asset’s current market value.
Trading volume refers to the total number of tokens for a specific asset that has been transacted or exchanged between buyers and sellers within set trading hours, for example, 24 hours. It is used to gauge market sentiment, this metric combines all volumes on centralized exchanges and decentralized exchanges. Increasing trading volume often denotes the demand for a certain asset as more people are buying and selling the cryptocurrency.
Funding rates are a concept designed to encourage traders to take positions and ensure perpetual contract prices match spot markets. It defines a mechanism by exchanges to ensure that future prices and index prices periodic payments regularly converge. When the funding rate is positive, the price of the perpetual contract is higher than the mark price. This means traders who are bullish and have opened long positions pay traders who are in short positions. On the other hand, a negative funding rate means perpetual prices are below the mark price, and hence traders with short positions pay traders who have opened long positions.

FXStreet
超過一百萬用戶依賴 FXStreet 獲取即時市場數據、圖表工具、專家洞見與外匯新聞。其全面的經濟日曆與教育網路研討會協助交易者保持資訊領先、做出審慎決策。FXStreet 擁有約 60 人的團隊,分布於巴塞隆納總部及全球各地。
Read More


