
Trade The World
Top Crypto Gainers: Kaspa, Flare and SPX6900 hold steady, signalling easing bearish momentum
作者 John Isige
發布日期: 27 Nov 2025 | 修改日期: 27 Nov 2025


POPULAR ARTICLES

Kaspa (KAS), Flare (FLR) and SPX6900 (SPX) are extending their recovery on Thursday, as Bitcoin (BTC), Ethereum (ETH) and major altcoins show weakness, weighed down by macroeconomic uncertainty and a lack of significant price catalysts.
- Kaspa extends recovery after breaking above the 50-day EMA and descending trendline resistance.
- Flare bulls push to regain control, supported by the RSI's move into the bullish region.
- SPX6900 bulls tighten their grip as technical indicators signal fading bearish momentum.
Kaspa (KAS), Flare (FLR) and SPX6900 (SPX) are extending their recovery on Thursday, as Bitcoin (BTC), Ethereum (ETH) and major altcoins show weakness, weighed down by macroeconomic uncertainty and a lack of significant price catalysts.
Kaspa reclaims support as bulls eye trend control
Kaspa has risen 67% from its floor price (local bottom) of $0.0358, which was tested on last Friday, and is trading at $0.0597 at the time of writing on Thursday. A break above the 50-day Exponential Moving Average (EMA) at $0.0536 bolstered the uptrend above a descending trendline on the daily chart.
The 100-day EMA at $0.0629 will likely cap price rebounds. However, the Relative Strength Index (RSI) is approaching the overbought territory, indicating that bullish momentum is increasing.
The Moving Average Convergence Divergence (MACD) indicator has maintained a buy signal on the daily chart, suggesting investors increase their risk exposure.
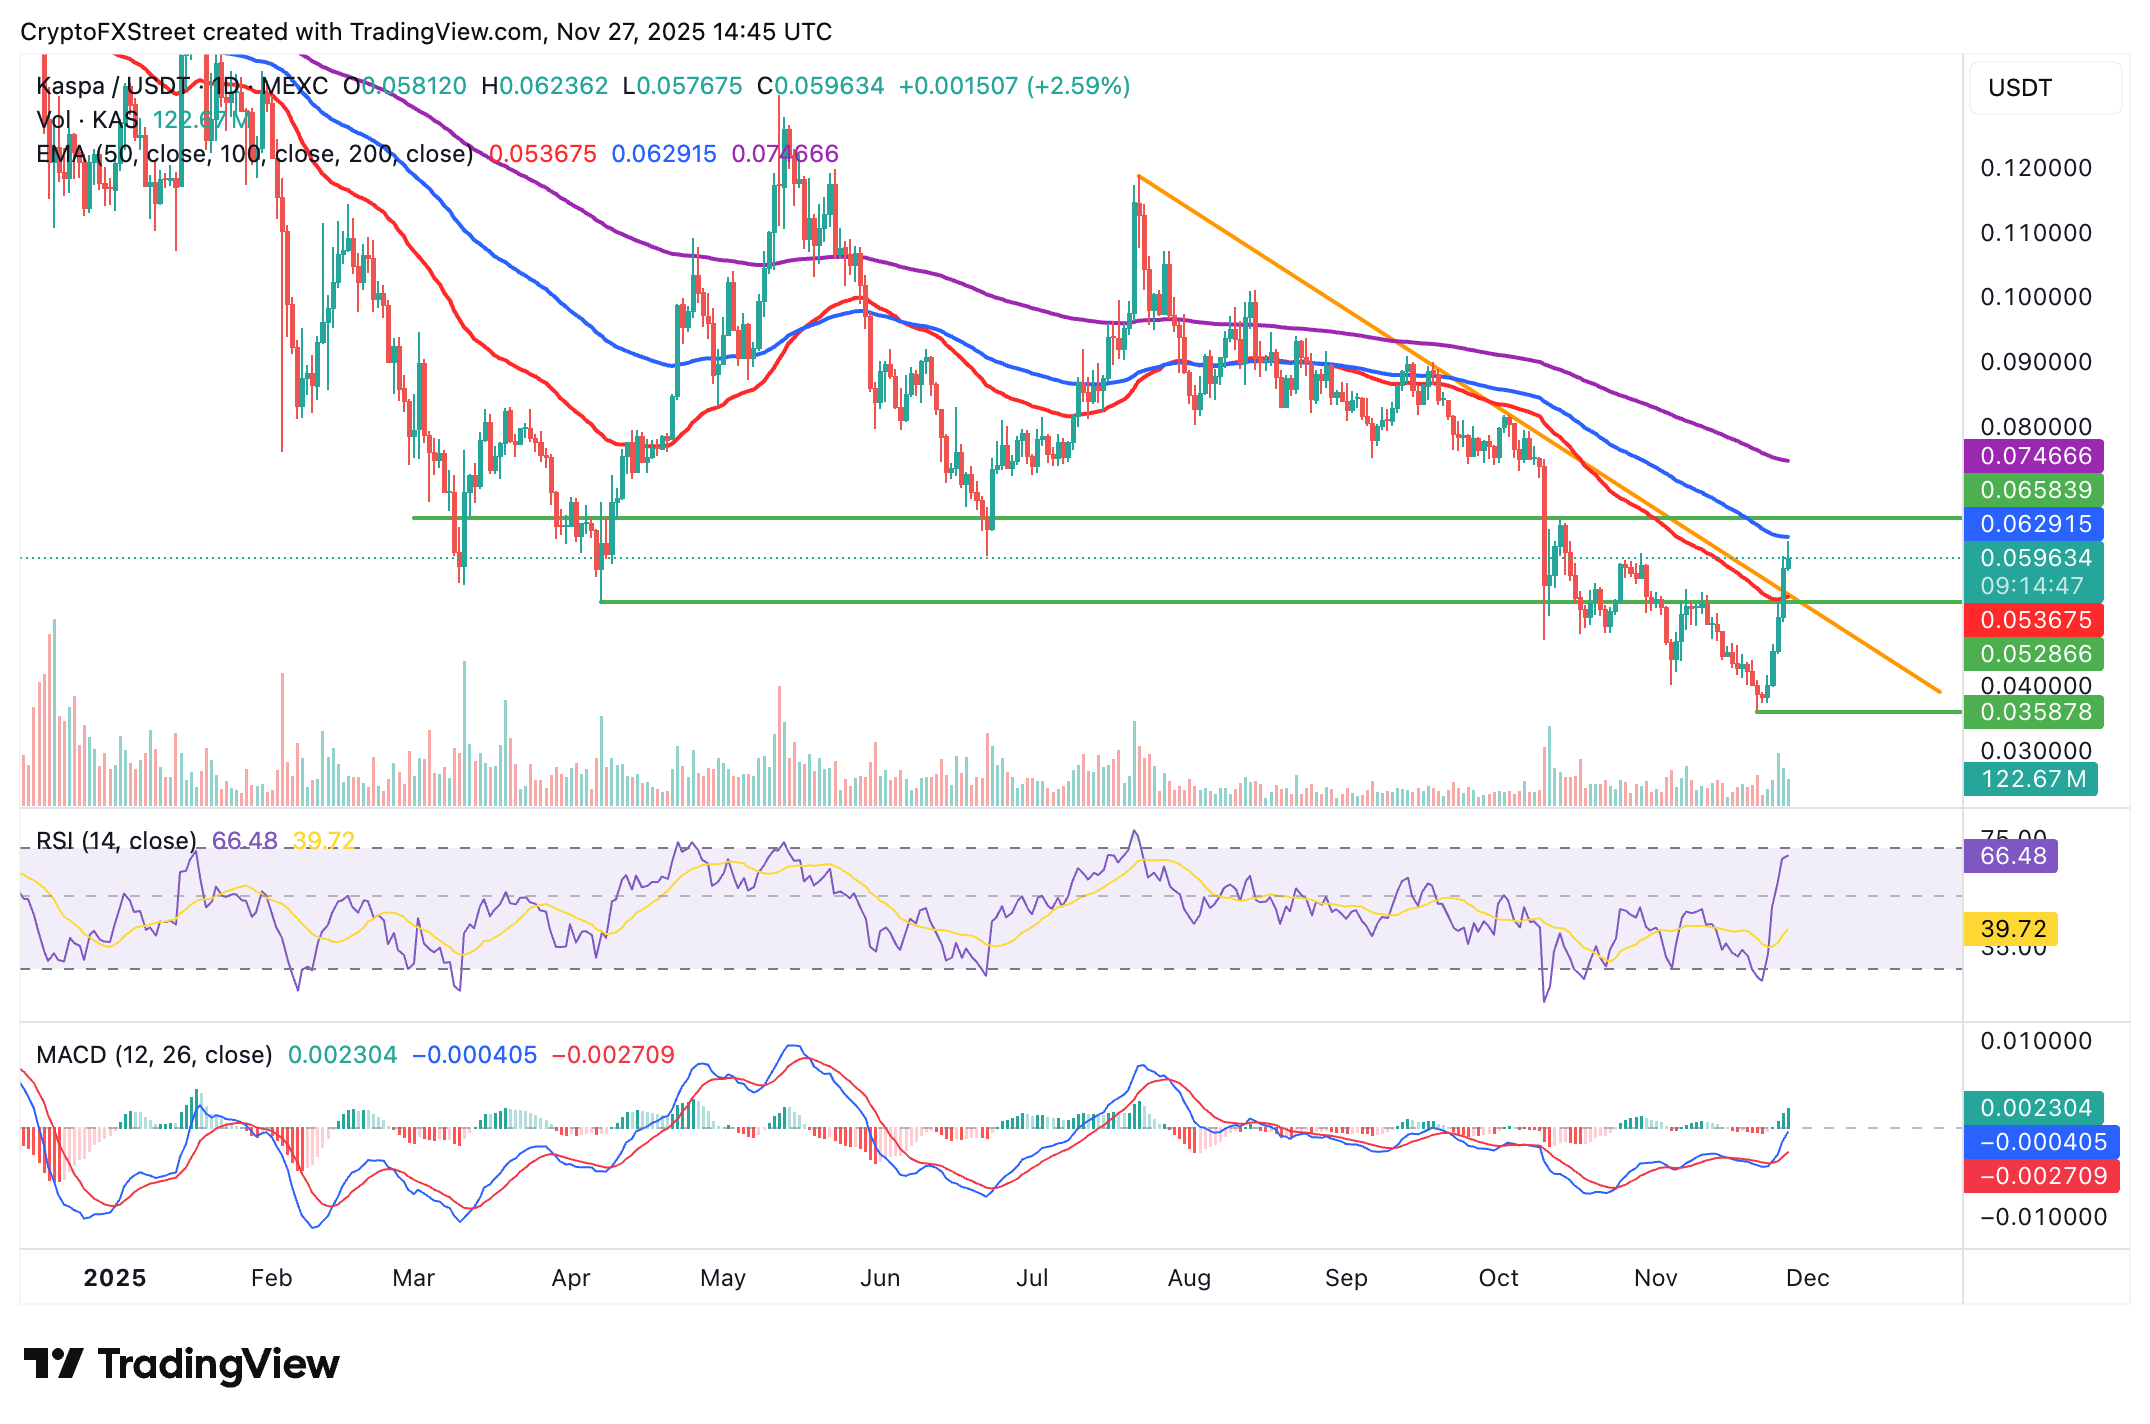
A sustained upswing above the 100-day EMA would boost Kaspa's recovery potential above the 200-day EMA at $0.0746. Still, breaching the descending and the 50-day EMA support could erase the progress made this week and accelerate a possible retracement toward the $0.0358 support.
Flare bulls tighten grip
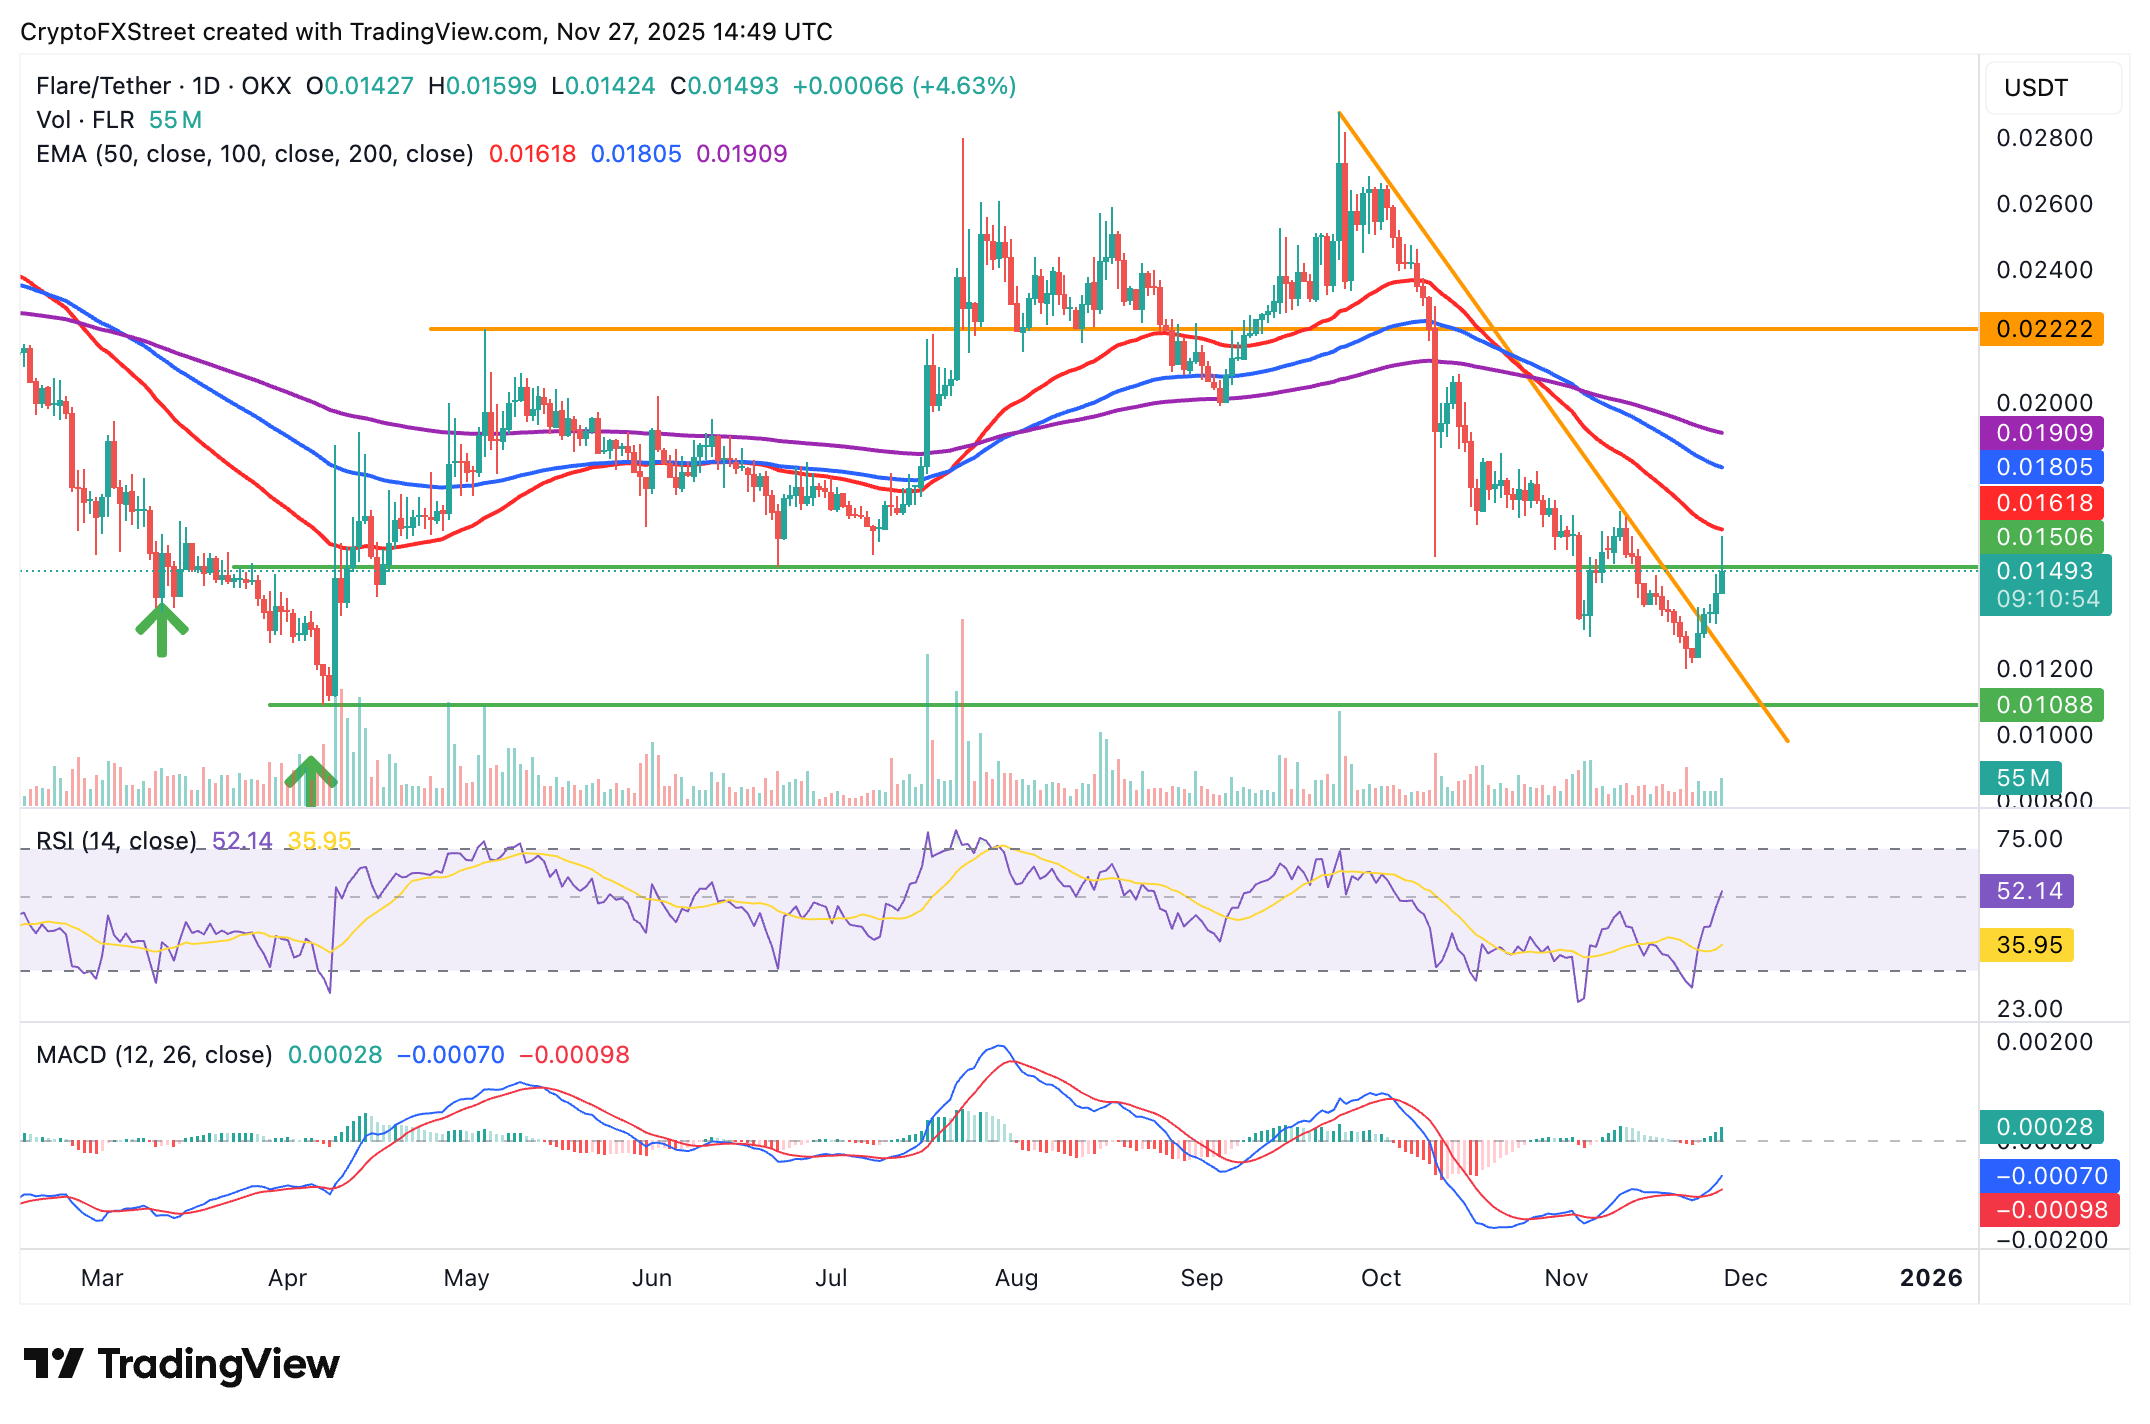
Flare is testing the resistance highlighted at $0.0150 on the daily chart after rising for the fifth consecutive day since Sunday. An uptrending RSI at 52 supports FLR's short-term bullish outlook, while the MACD indicator's buy signal since Monday is encouraging investors to increase their risk exposure.
A steady recovery above the immediate hurdle at $0.0150 is required to affirm Flare's recovery potential, targeting the 50-day EMA at $0.0161, the 100-day EMA at $0.0180 and the 200-day EMA at $0.0190.
Still, early profit-booking, coupled with uncertainty in the broader cryptocurrency market, may result in a trend reversal toward support between $0.0108 and $0.0120.
SPX6900 holds steady amid a bearish crypto market
SPX6900 is trading at $0.7267 at the time of writing on Thursday, bolstered by short-term technical indicators. The RSI at 54 on the daily chart suggests increasing bullish momentum.
At the same time, the MACD indicator rises toward the zero line, signaling that investors should increase their exposure, as the green histogram bars expand in the bullish region.
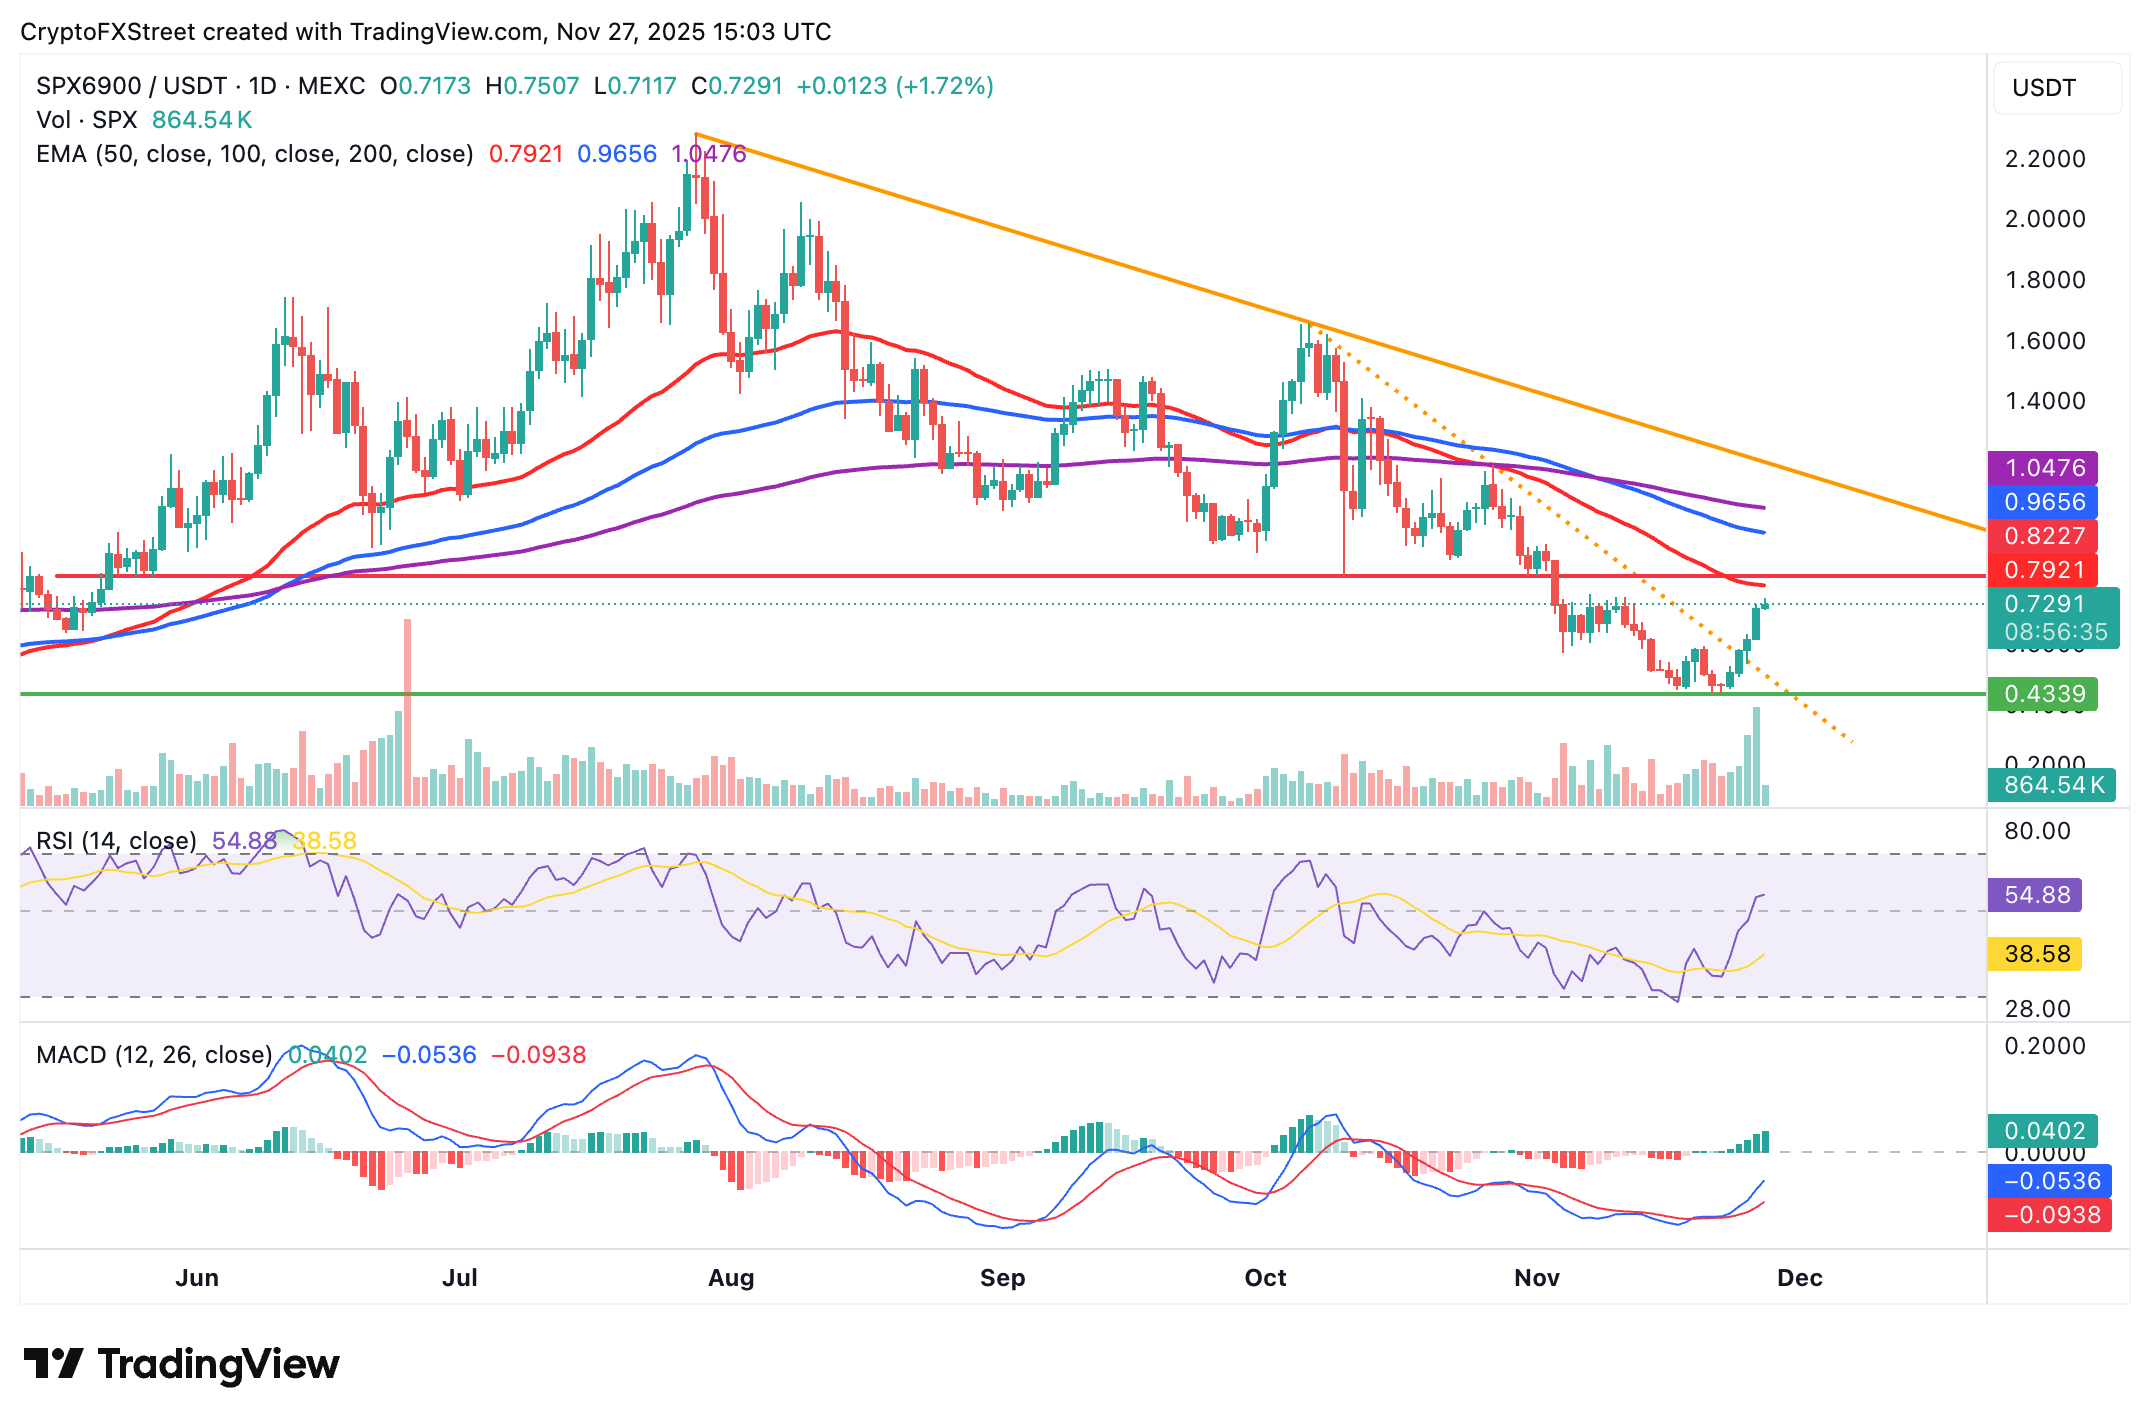
Traders will look for a successful breach of the 50-day EMA at $0.7921 to ascertain the bullish grip on SPX. Further movement north will target key hurdles at the 100-day EMA ($0.9656) and the 200-day EMA ($1.0476).
Cryptocurrency prices FAQs
Token launches influence demand and adoption among market participants. Listings on crypto exchanges deepen the liquidity for an asset and add new participants to an asset’s network. This is typically bullish for a digital asset.
A hack is an event in which an attacker captures a large volume of the asset from a DeFi bridge or hot wallet of an exchange or any other crypto platform via exploits, bugs or other methods. The exploiter then transfers these tokens out of the exchange platforms to ultimately sell or swap the assets for other cryptocurrencies or stablecoins. Such events often involve an en masse panic triggering a sell-off in the affected assets.
Macroeconomic events like the US Federal Reserve’s decision on interest rates influence crypto assets mainly through the direct impact they have on the US Dollar. An increase in interest rate typically negatively influences Bitcoin and altcoin prices, and vice versa. If the US Dollar index declines, risk assets and associated leverage for trading gets cheaper, in turn driving crypto prices higher.
Halvings are typically considered bullish events as they slash the block reward in half for miners, constricting the supply of the asset. At consistent demand if the supply reduces, the asset’s price climbs.

FXStreet
超過一百萬用戶依賴 FXStreet 獲取即時市場數據、圖表工具、專家洞見與外匯新聞。其全面的經濟日曆與教育網路研討會協助交易者保持資訊領先、做出審慎決策。FXStreet 擁有約 60 人的團隊,分布於巴塞隆納總部及全球各地。
Read More


