
Trade The World
Top Crypto Gainers: PancakeSwap, BNB, DeXe rally on token burns, on-chain inflows
作者 Vishal Dixit
發布日期: 8 Oct 2025 | 修改日期: 8 Oct 2025


POPULAR ARTICLES

PancakeSwap (CAKE), BNB (BNB), previously known as Binance Coin, and DeXe (DEXE) are emerging as top performers over the last 24 hours while the broader cryptocurrency market remains volatile, with Bitcoin (BTC) dropping under $122,000.
- PancakeSwap reaches a fresh 52-week high, challenging a key multi-year resistance zone.
- BNB extends higher into price discovery mode, fueled by rising inflows onto BNB Chain.
- DeXe holds steady above $13.00 on Wednesday following the nearly 8% gain from Tuesday.
PancakeSwap (CAKE), BNB (BNB), previously known as Binance Coin, and DeXe (DEXE) are emerging as top performers over the last 24 hours while the broader cryptocurrency market remains volatile, with Bitcoin (BTC) dropping under $122,000.
The native token of BNB Chain, BNB, and its top-performing protocol, PancakeSwap, rallied on the back of rising on-chain inflows and deflationary tokenomics. Meanwhile, DeXe extends the falling channel breakout rally on the daily chart.
PancakeSwap rally hits a multi-year resistance zone
The Decentralized Exchange (DEX) token, CAKE, is down 1% at press time on Wednesday, reflecting a breather phase after two consecutive days of gains, resulting in over 30% gains so far this week.
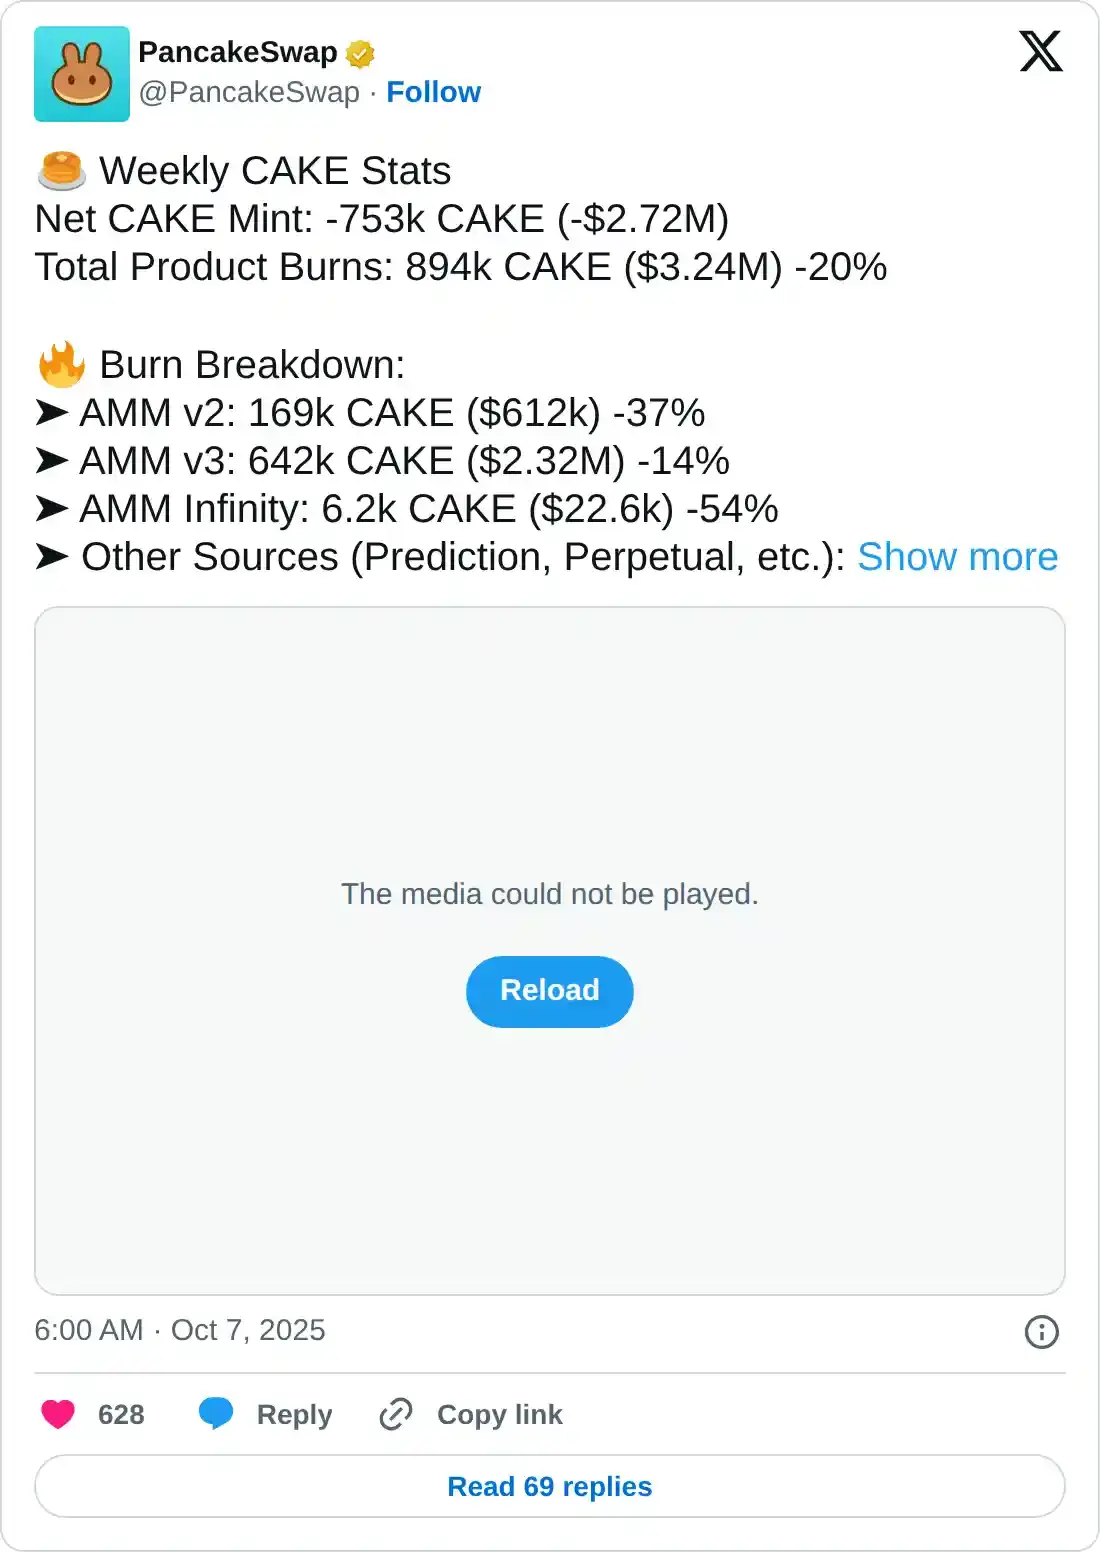
Fueling the recovery run, PancakeSwap announced in an X post on Tuesday that the weekly net token mint was -753k CAKE, burned from circulation alongside the total product burns of 894k CAKE, worth $3.24M. With the deflationary trend in motion, demand could experience linear growth, creating a positive feedback loop with the CAKE token price.
CAKE approaches the overhead resistance at $4.50, a multi-year supply zone marked from the close of May 15. A decisive weekly close above this level could unleash the trapped momentum on the upside.
Key resistance levels for the potential breakout rally are $6.603 and $10.709, which align with the 1.272 and 1.618 Fibonacci extension levels drawn from December’s monthly high of $4.515 to February’s monthly low at $1.116.
The indicators on the weekly chart suggest a rise in trend momentum as the Relative Strength Index (RSI) reads 70, approaching the overbought zone. Meanwhile, the Moving Average Convergence Divergence (MACD) bounces off its signal line, extending the upward trend and suggesting a rise in buying pressure.
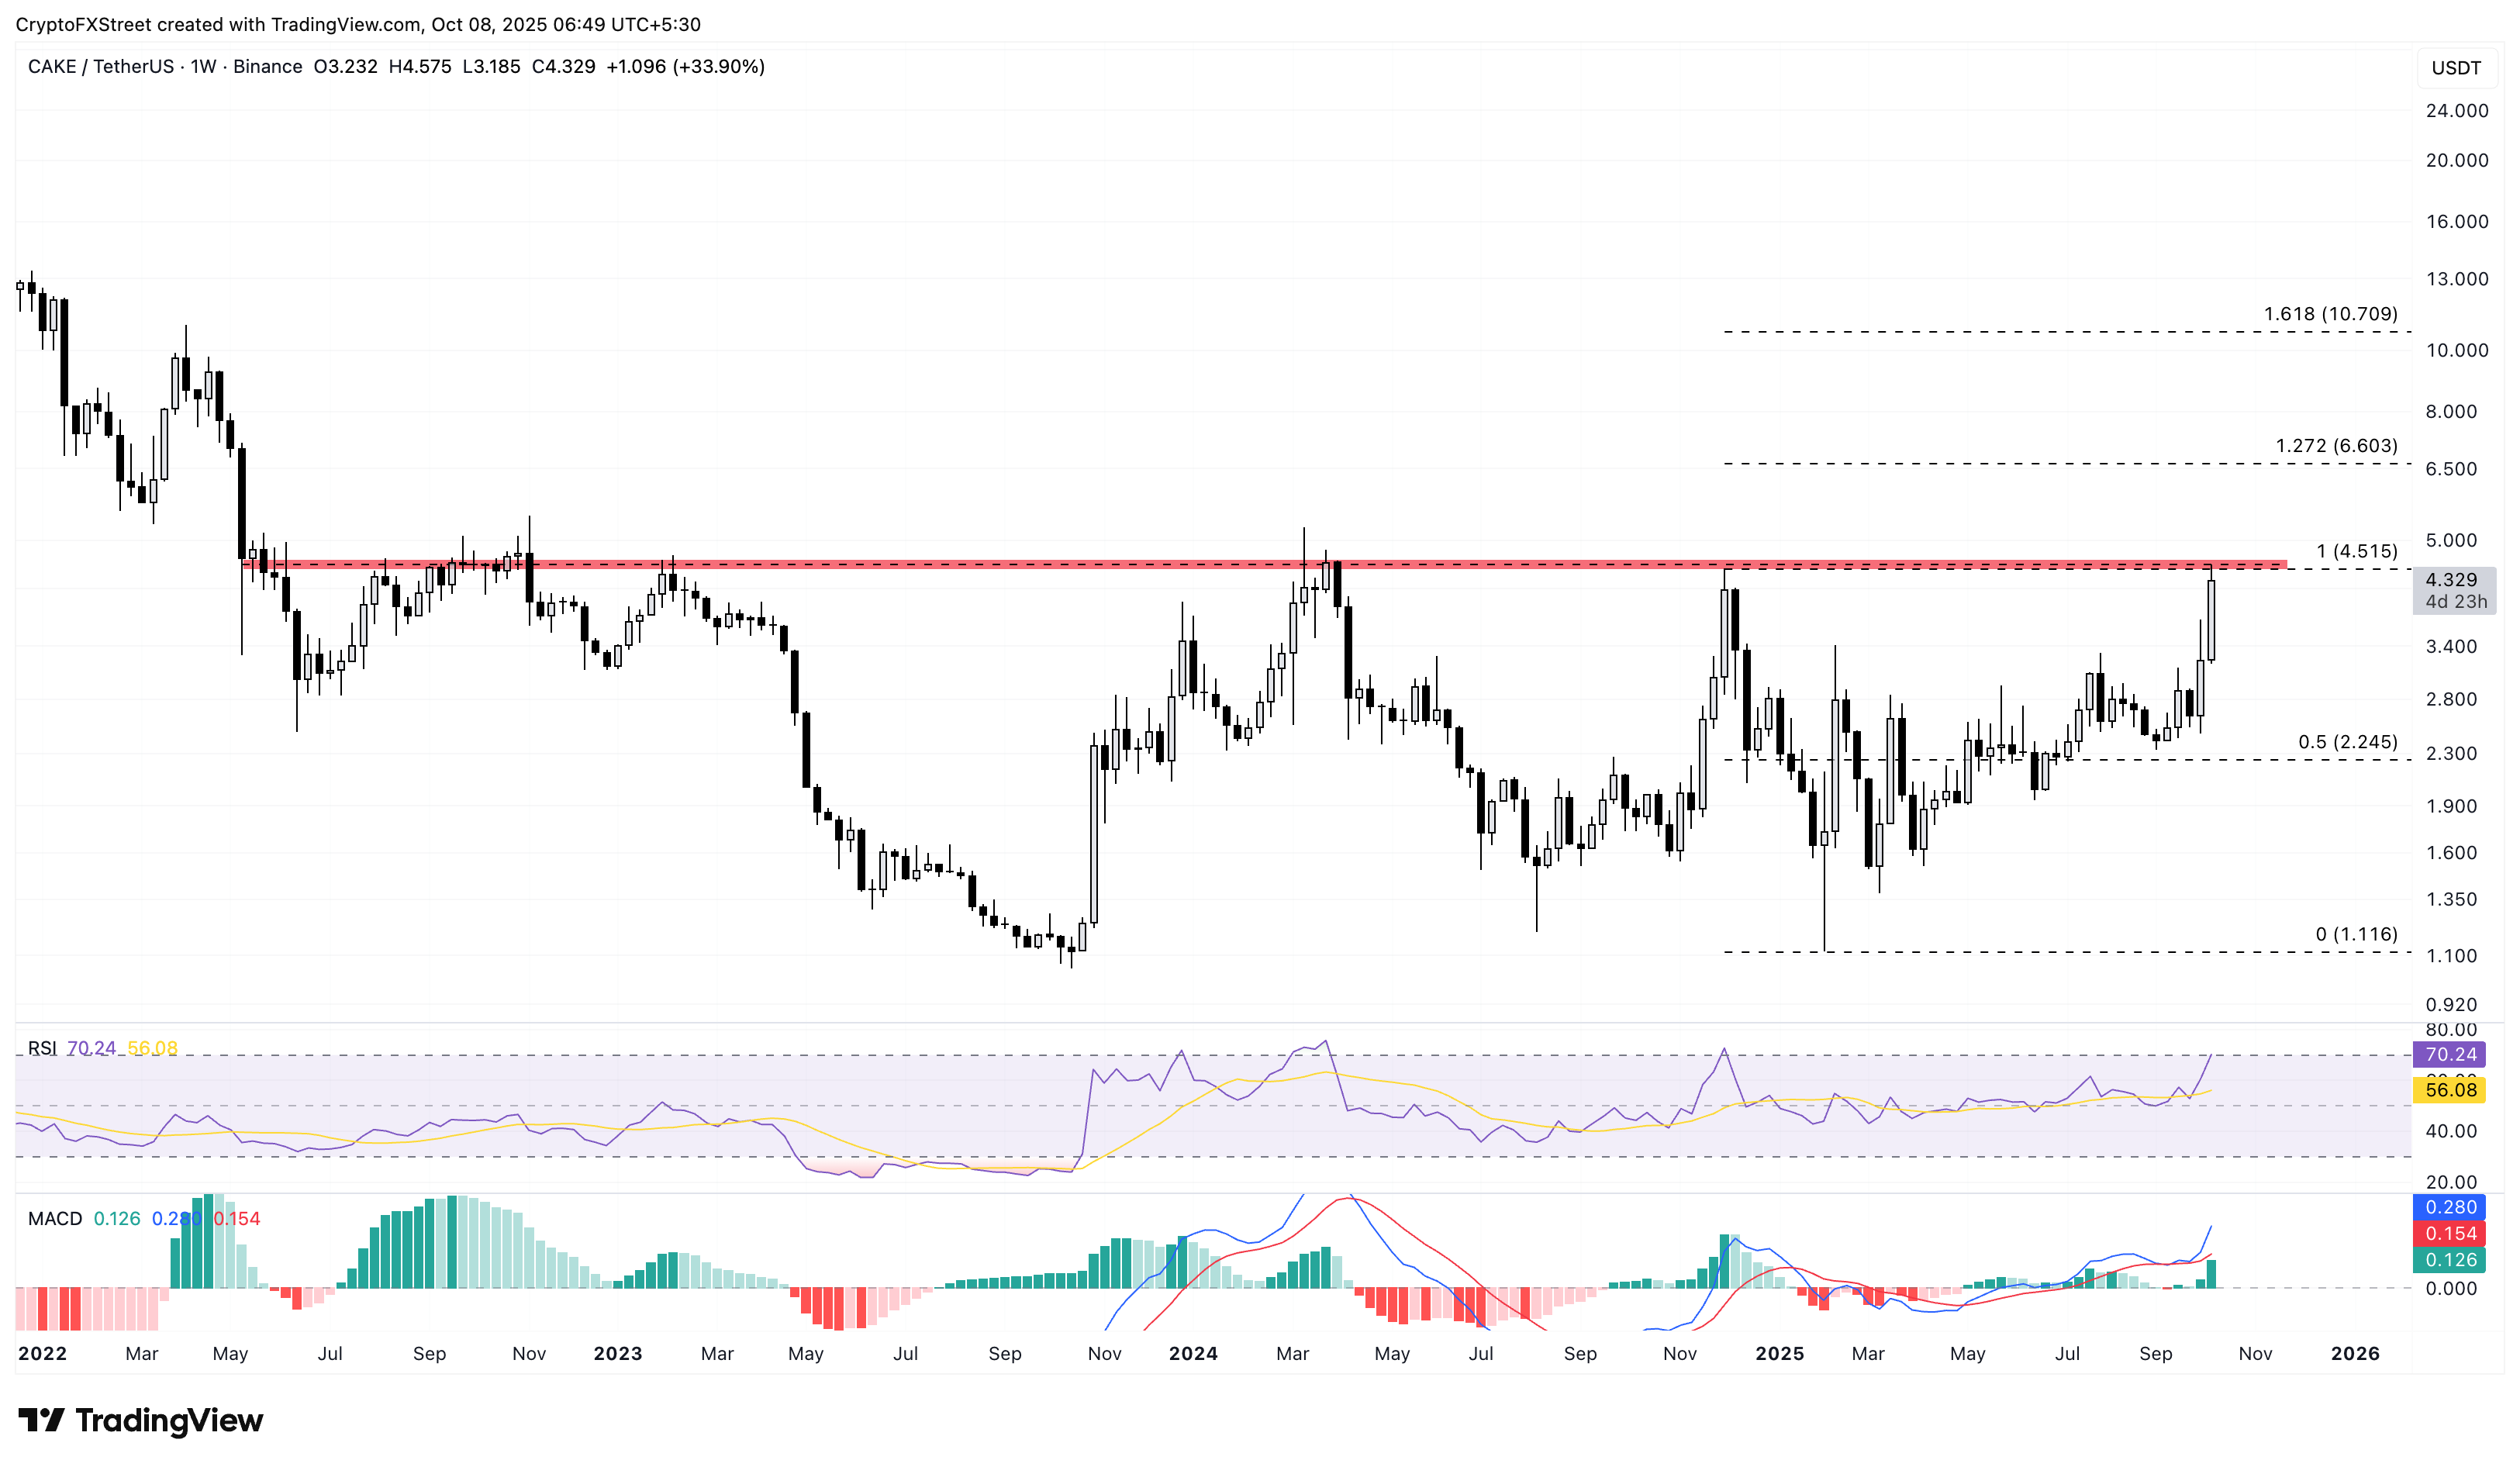
CAKE/USDT weekly price chart.
On the downside, a reversal from $4.50 could retest the $4.00 round figure.
BNB trend overheats, risks potential drop
BNB, previously called Binance Coin, edges higher by almost 1% at the time of writing on Wednesday, advancing on the 6.64% gains from the previous day. The native token of the Binance ecosystem, BNB, continues to rise for the fourth consecutive day, extending the upside breakout from a rising channel on the daily chart.
On-chain data shows a significant shift in capital from multiple chains to the BNB Chain. deBridge reveals that over $526 million worth of digital assets have moved to the BNB Chain in the last month, primarily from Ethereum (ETH), Solana (SOL), Arbitrum (ARB), and other chains. This indicates a surge in liquidity and demand over the BNB Chain, which could boost demand for its native token, BNB.
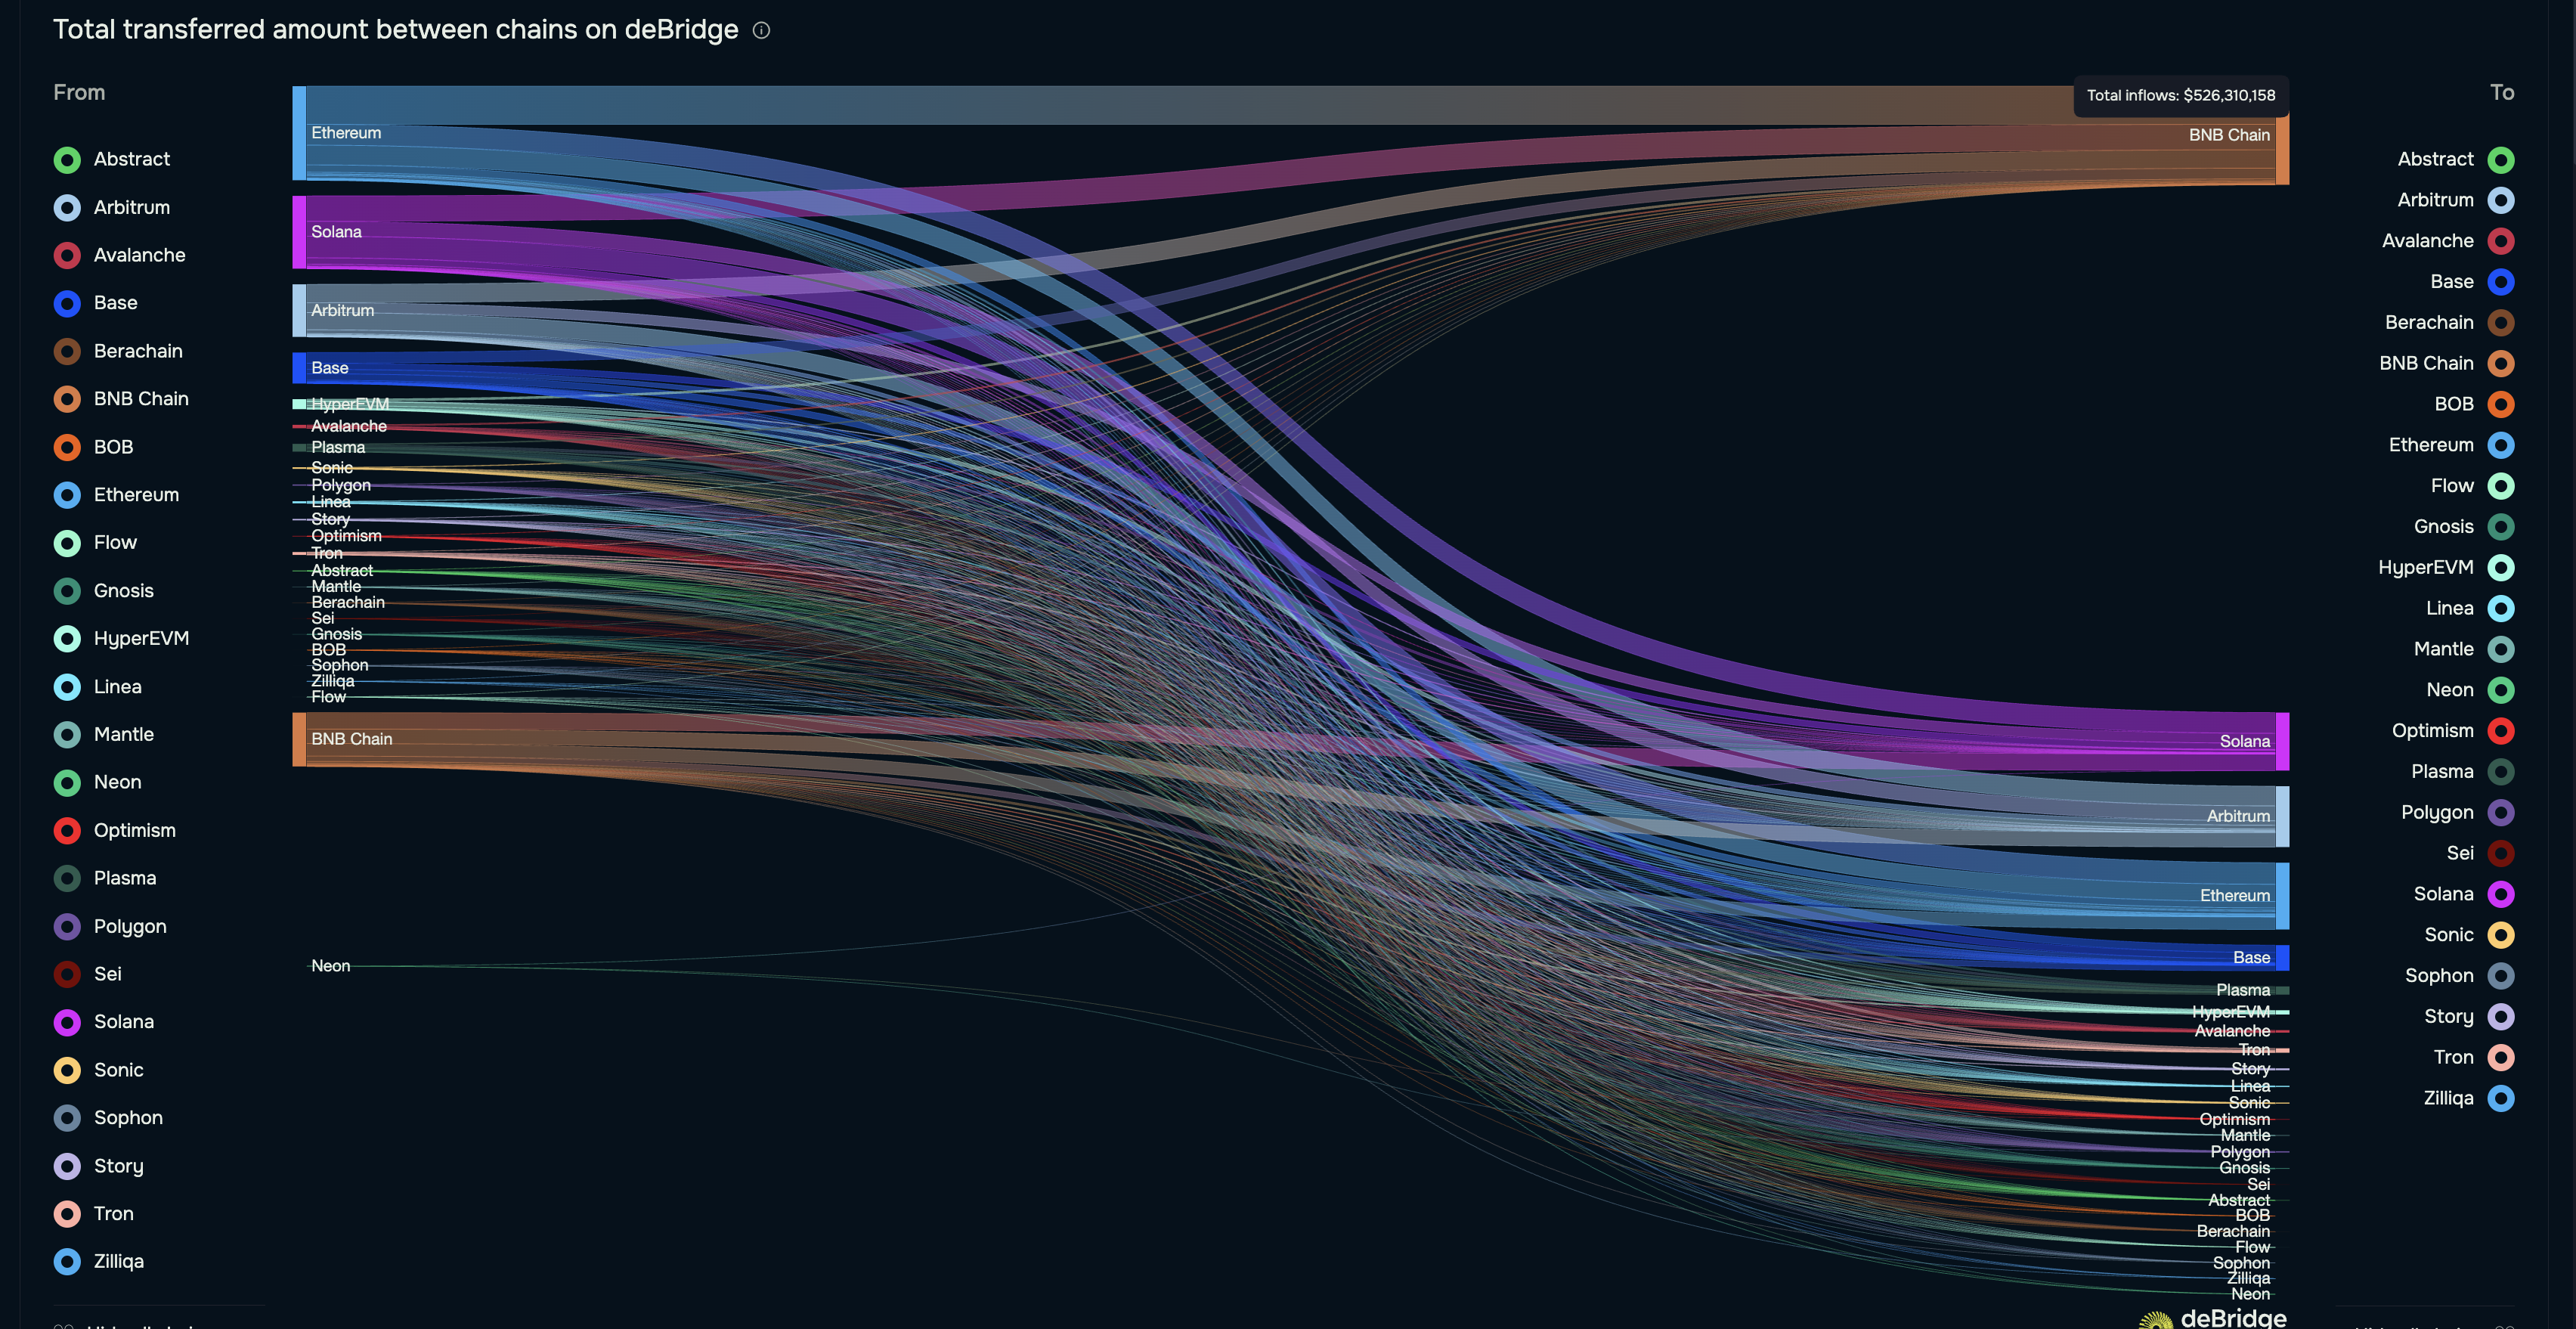
On-chain transfers. Source: deBridge
BNB retraced before reaching the R3 resistance pivot level at $1,358 but marked a fresh record high of $1,349 on Tuesday. If the altcoin exceeds this level, it could extend the rally to the R4 pivot level at $1,495.
The RSI at 78 on the 4-hour chart signals that the BNB rally is overbought and bears the risk of a potential pullback. Still, the successive rise in green histogram bars in the MACD indicator alongside the upward-trending average line suggests a strong bullish momentum.
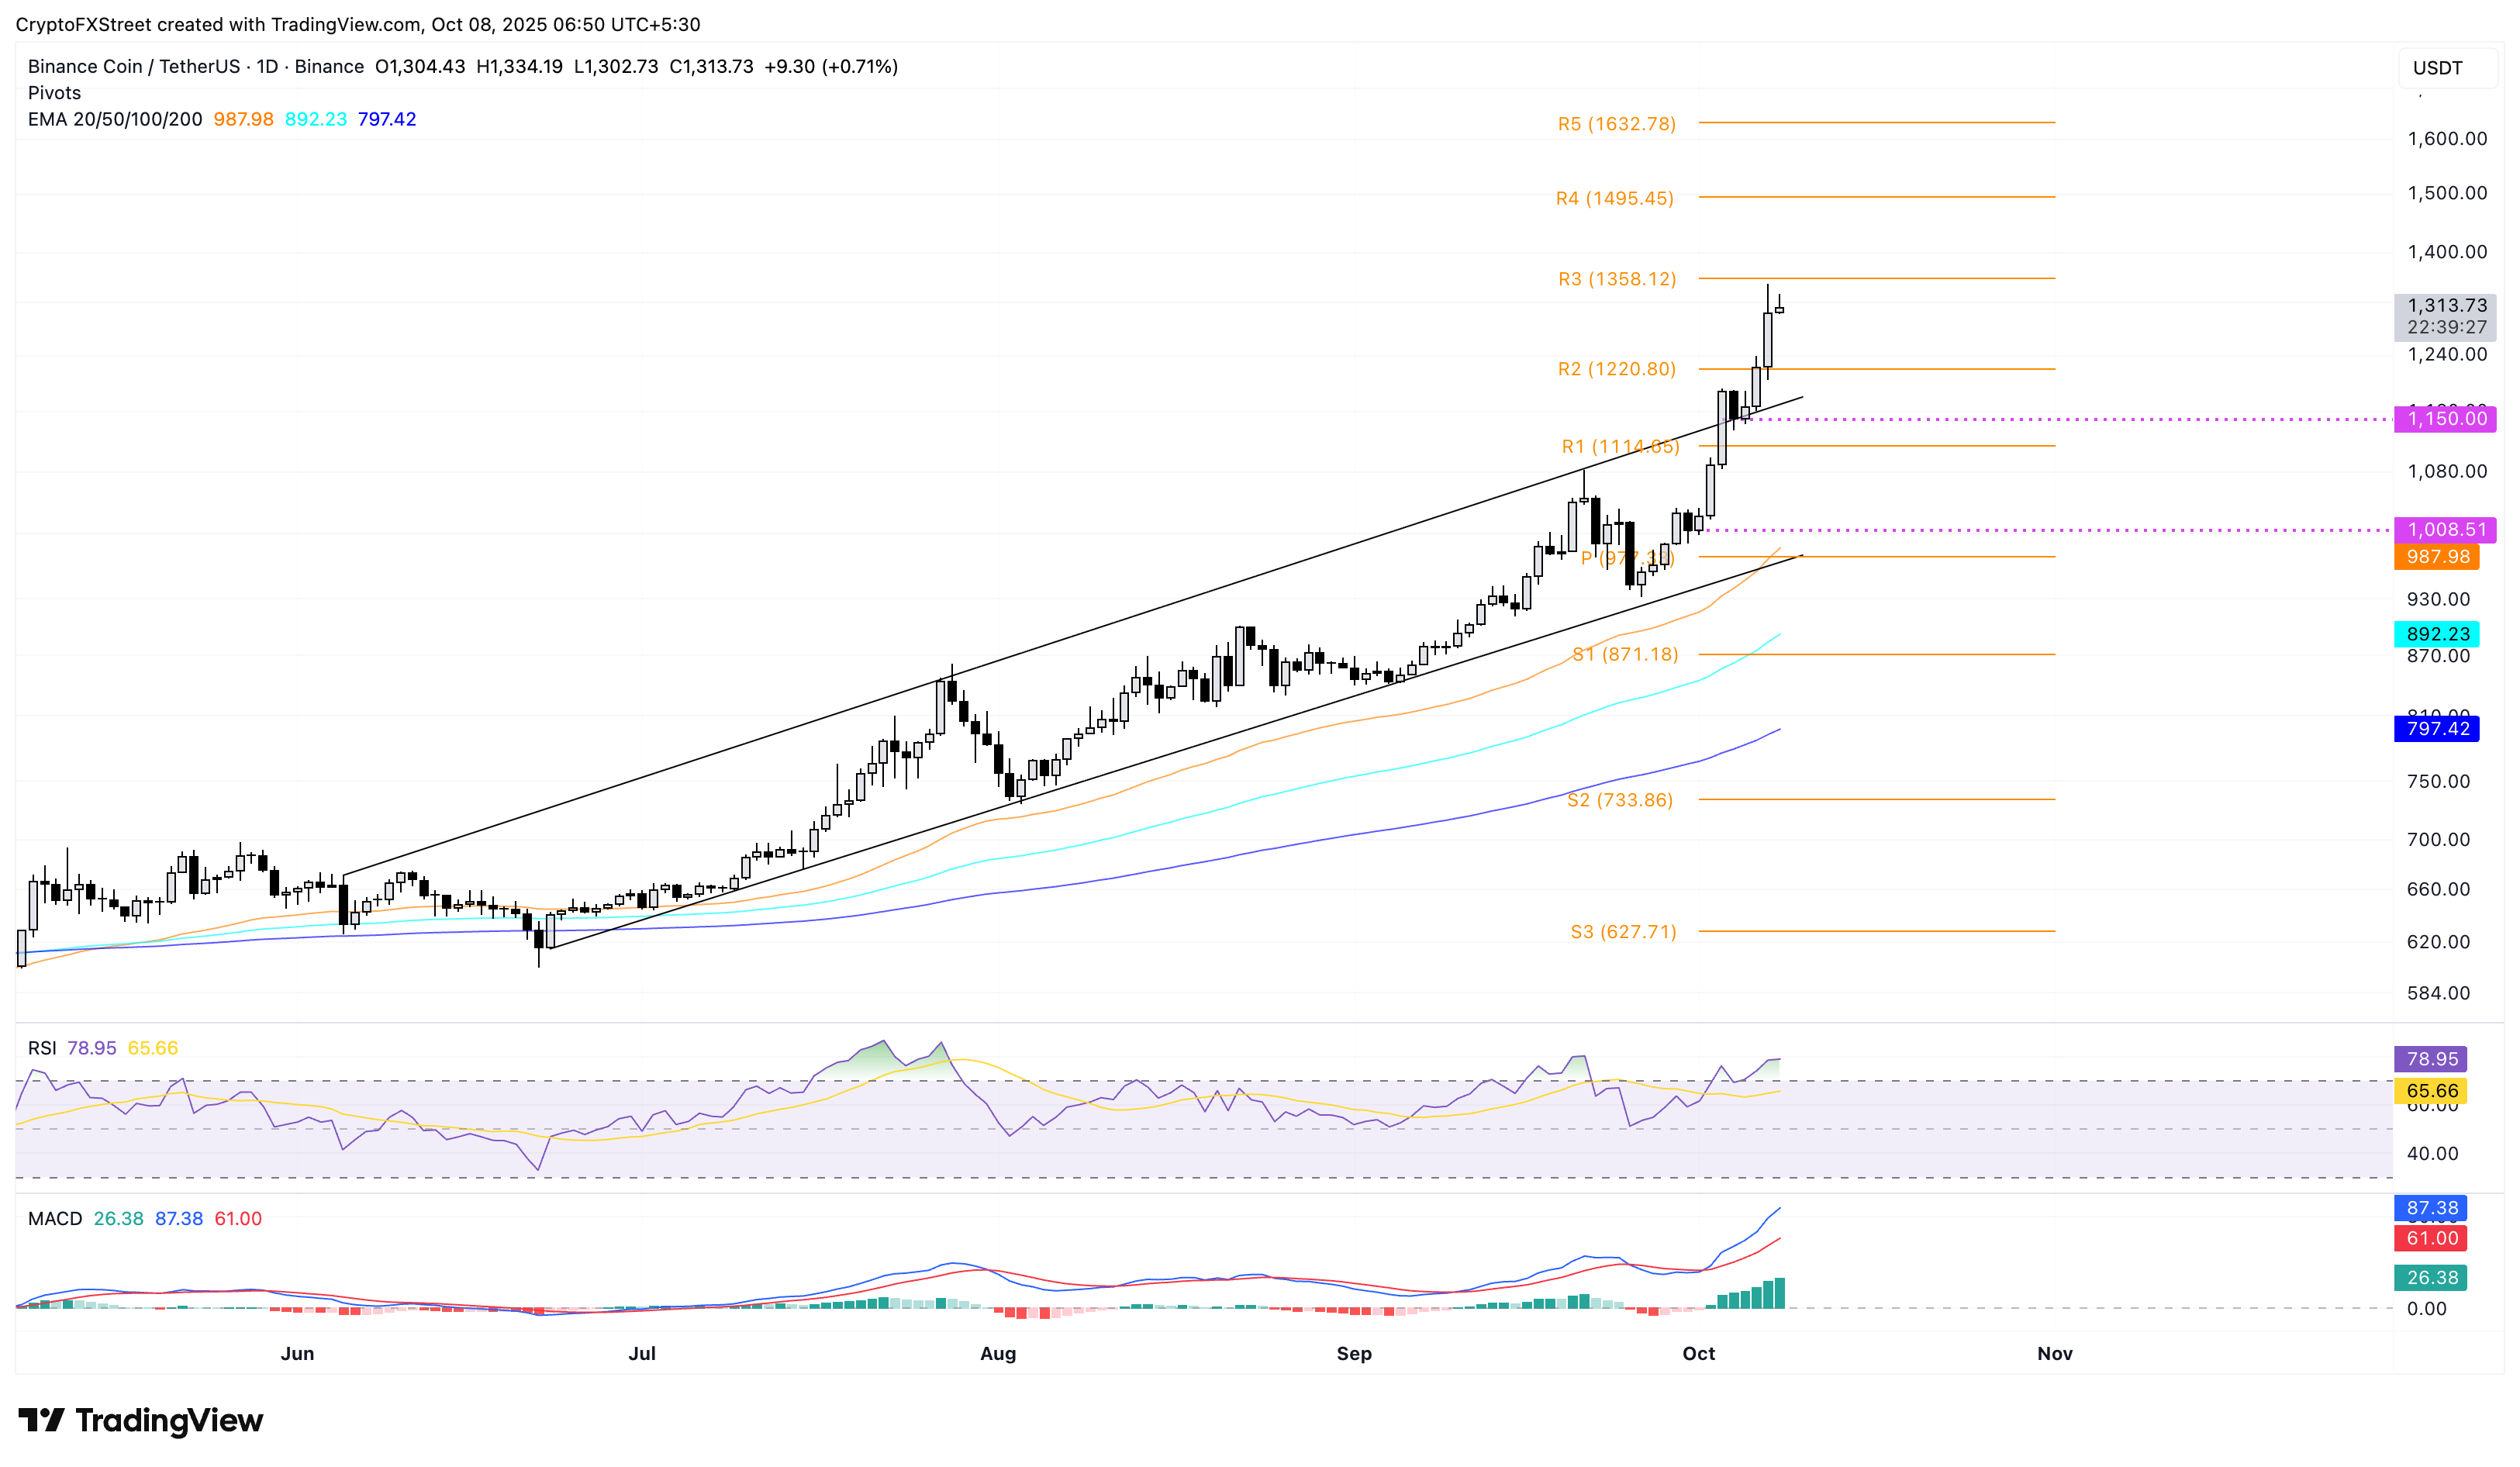
BNB/USDT daily price chart.
Looking down, a key support for BNB lies at the R2 resistance-turned-support level at $1,220.
DeXe trend holds above key level as indicators turn overbought
DeXe trades above $13.00 at the time of writing on Wednesday, after the nearly 8% gains from Tuesday. The Decentralized Finance (DeFi) token extends the falling channel breakout rally on the daily chart above the R1 resistance pivot level at $12.68, targeting the $14.22 level marked by the low of April 1, followed by the R2 pivot level at $15.88.
However, the dwindling RSI in the overbought zone, which reads 74 on the same chart, indicates a weakening in buying pressure. Still, the MACD and signal line continue their upward journey with successive rises in green histogram bars, suggesting underlying demand that could consolidate the DeXe token above its R1 pivot level.
The rising 50-day Exponential Moving Average (EMA) surpasses the 100-day EMA, signifying a bullish cross, which indicates a faster rate of short-term recovery compared to the prevailing trend.
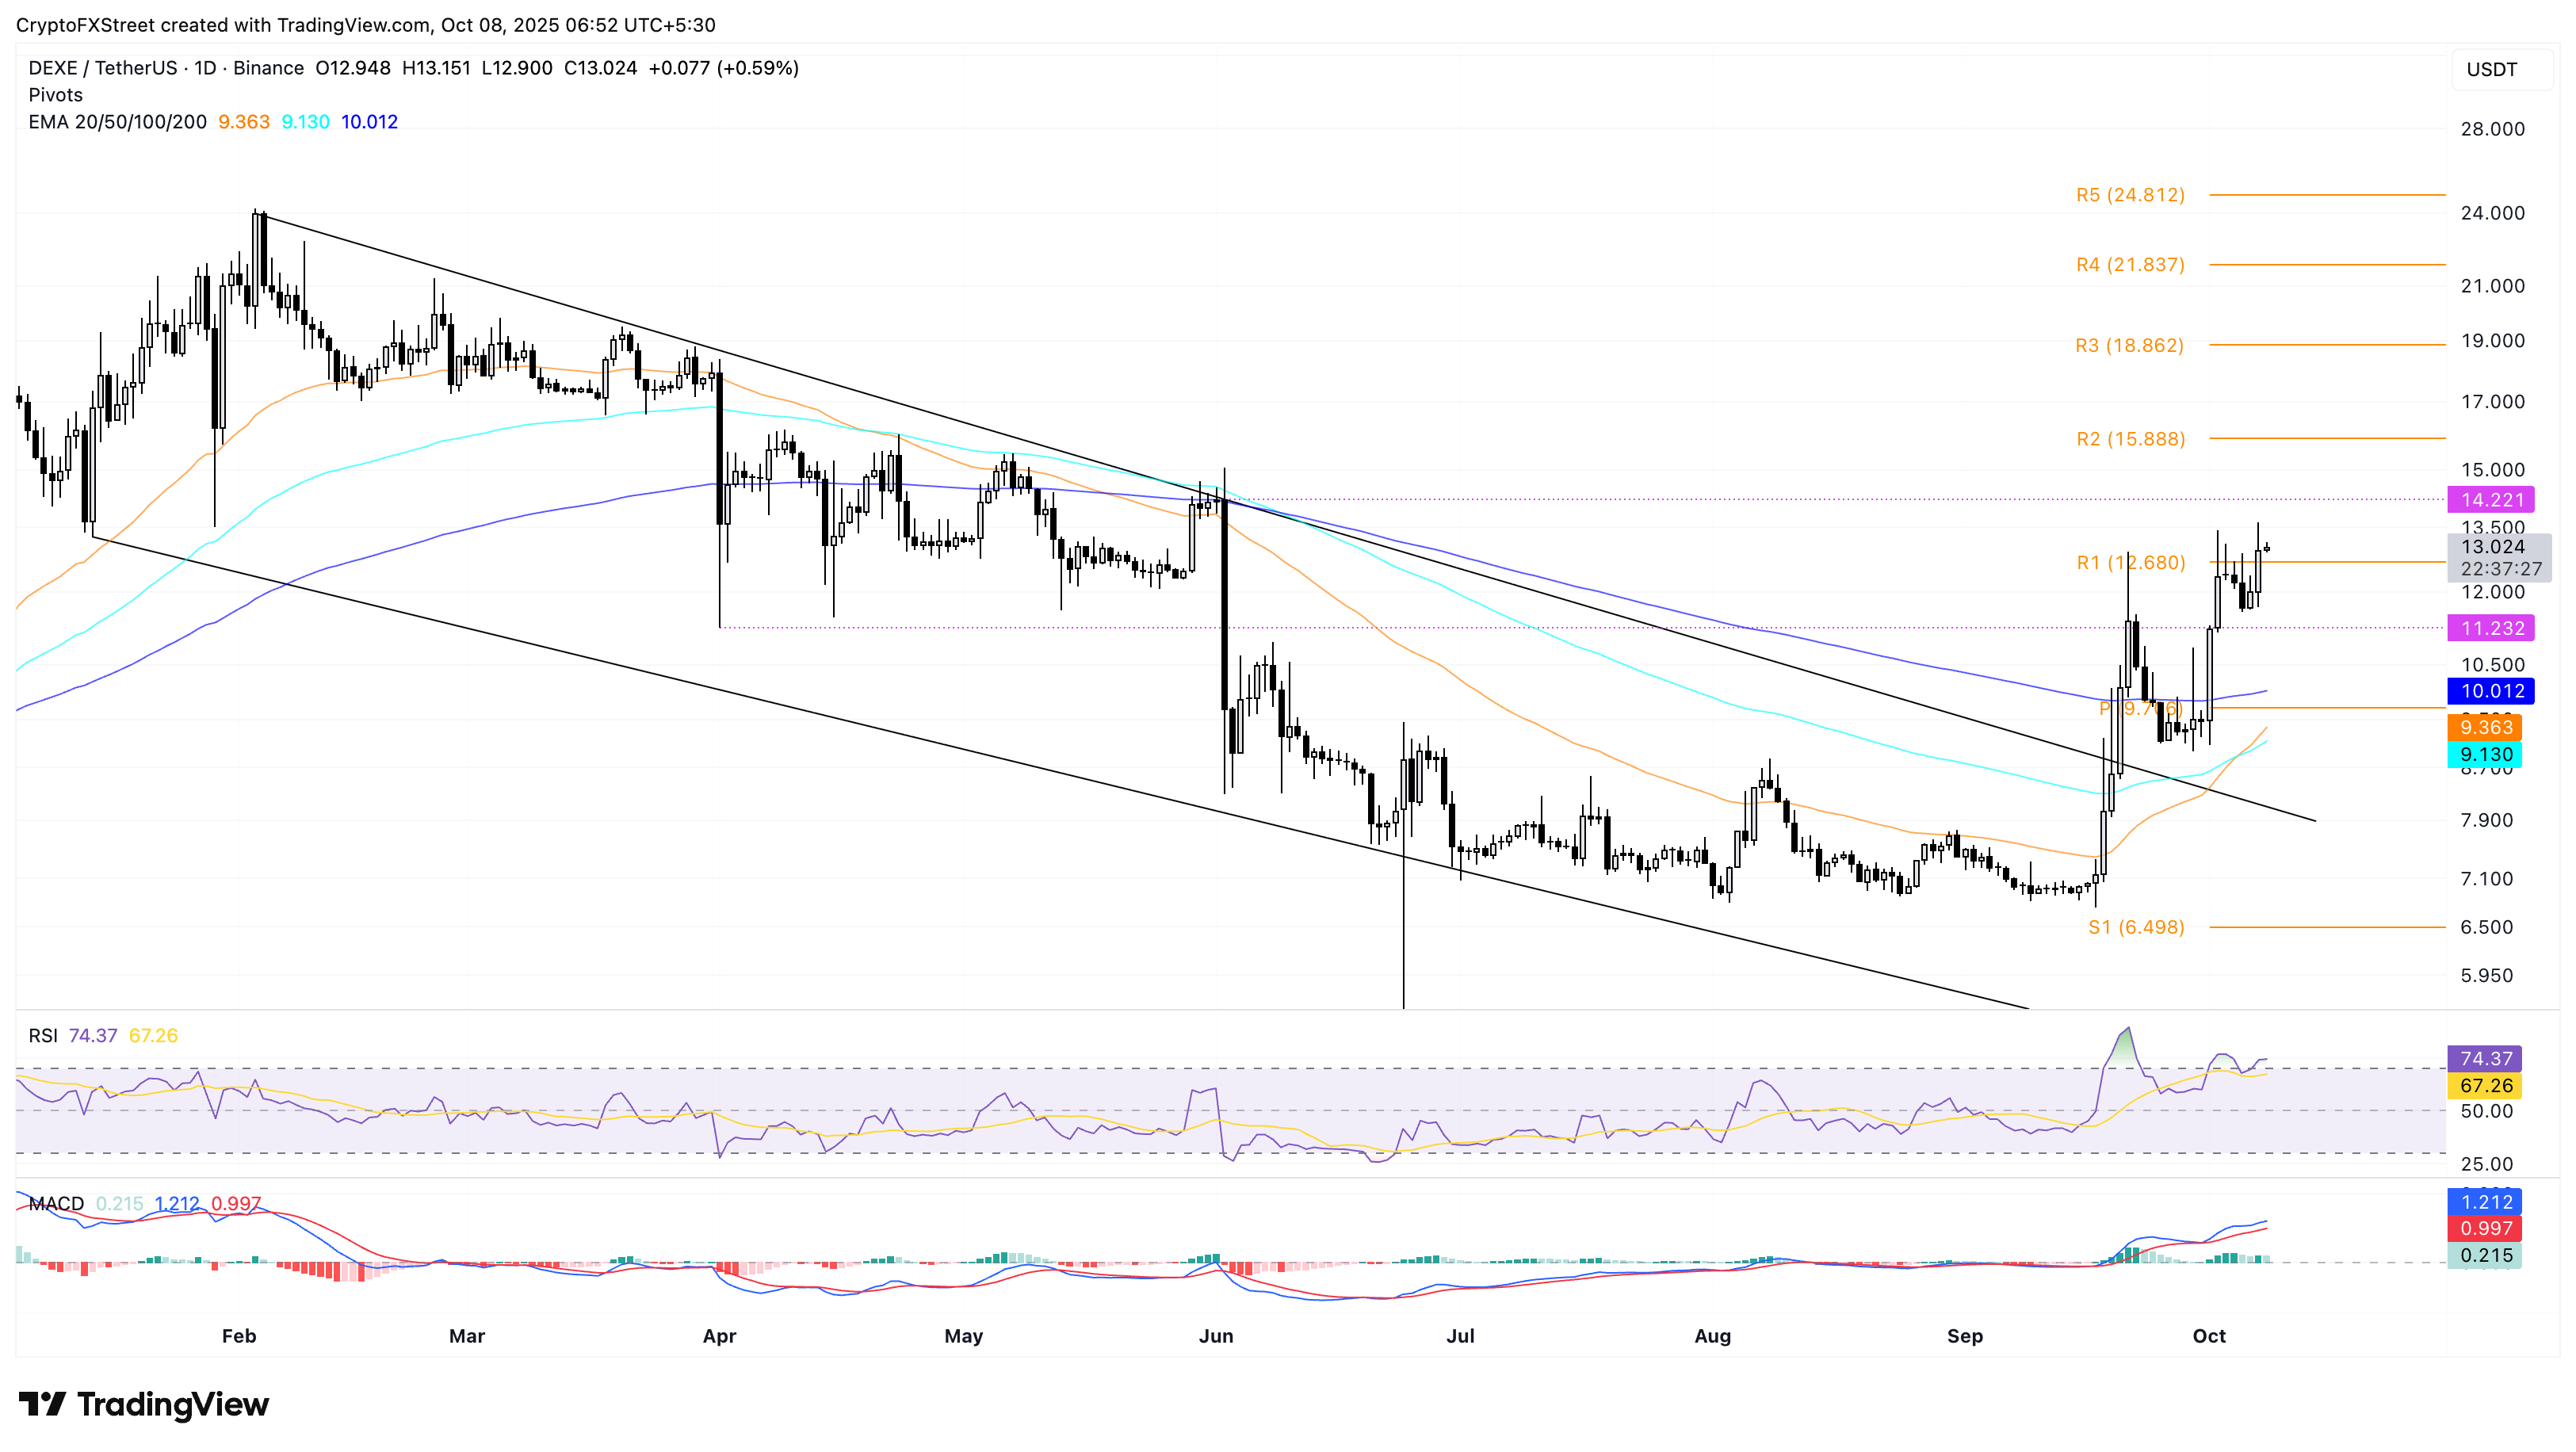
DEXE/USDT daily price chart.
If DeXe slips below $12.68, the 200-day EMA at $10.01 and the centre pivot level at $9.70 could act as the immediate support levels.

FXStreet
超過一百萬用戶依賴 FXStreet 獲取即時市場數據、圖表工具、專家洞見與外匯新聞。其全面的經濟日曆與教育網路研討會協助交易者保持資訊領先、做出審慎決策。FXStreet 擁有約 60 人的團隊,分布於巴塞隆納總部及全球各地。
Read More


