
Zcash Price Forecast: ZEC bears eye levels below $300 as bearish momentum builds
作者 Manish Chhetri
發布日期: 20 Jan 2026 | 修改日期: 20 Jan 2026


熱門文章

Zcash (ZEC) price is trading below $365 on Tuesday, after closing below the key support zone the previous day. The bearish narrative for ZEC strengthens as metrics show sell-side dominance rising and funding rates turning negative.
- Zcash price extends its losses on Tuesday after breaking below the key support zone on the previous day.
- On-chain and derivatives data paint a bearish picture with sell-side dominance increasing and funding rates turning negative.
- The technical outlook suggests a deeper correction, targeting levels below $300.
Zcash (ZEC) price is trading below $365 on Tuesday, after closing below the key support zone the previous day. The bearish narrative for ZEC strengthens as metrics show sell-side dominance rising and funding rates turning negative. On the technical side, suggest further correction, with bears targeting levels below $300 in the near term.
Zcash on-chain and derivatives show bearish bias
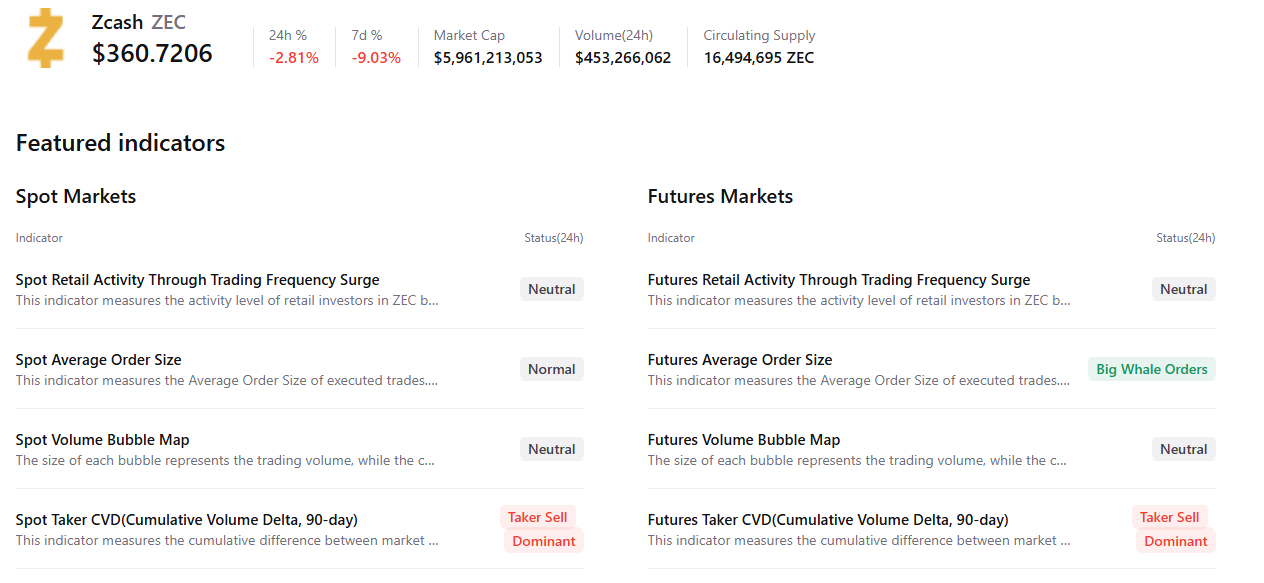
CryptoQuant’s summary data show that Zcash’s spot and futures markets show rising sell-side dominance, indicating a bearish outlook.
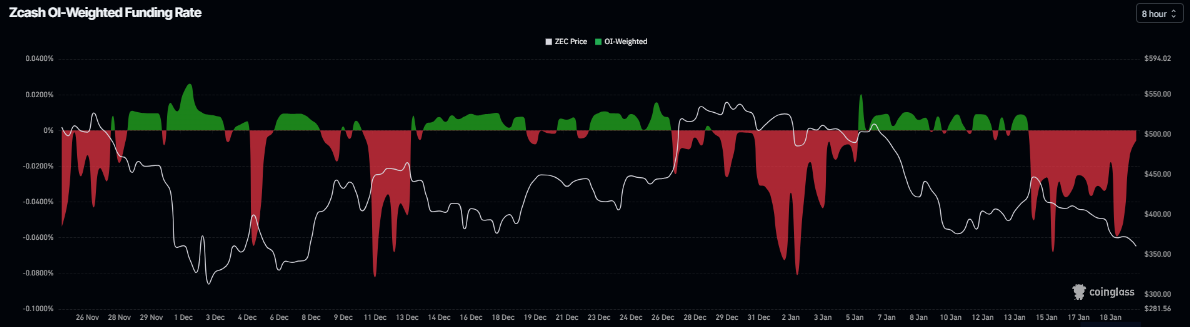
The derivatives also support a bearish outlook for ZEC. Coinglass’s OI-Weighted Funding Rate data shows that the number of traders betting that the price of Zcash will slide further is higher than those anticipating a price increase.
The metric has flipped to a negative rate and stands at -0.0057% on Tuesday, indicating shorts are paying longs, suggesting bearish sentiment toward ZEC.
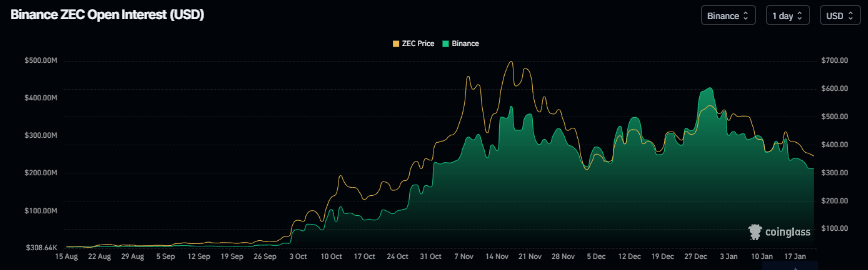
The bearish price action is further supported by Zcash’s declining open interest on Binance, which stood at $212.53 million on Tuesday, the lowest level since early December. This declining open interest indicates that traders are closing positions and speculative interest is fading, rather than fresh buying stepping in.
Zcash Price Forecast: ZEC bears are aiming for levels below $300
Zcash price broke below the ascending trendline (drawn by joining multiple lows since the end of October) on Sunday and declined nearly 2%, closing below the daily support at $372 on Monday. As of Tuesday, ZEC is trading down to $362.
If ZEC continues its downward trend, it could extend the decline toward the December 3 low of $302.58, which roughly coincides with the 200-day Exponential Moving Average (EMA) at $298.81.
The Relative Strength Index (RSI) on a daily chart is 36, below its neutral level of 50, pointing downward toward oversold territory, indicating strong bearish momentum. Moreover, the Moving Average Convergence Divergence (MACD) showed a bearish crossover on January 7, with rising red histogram bars below the neutral level, further supporting the negative outlook.
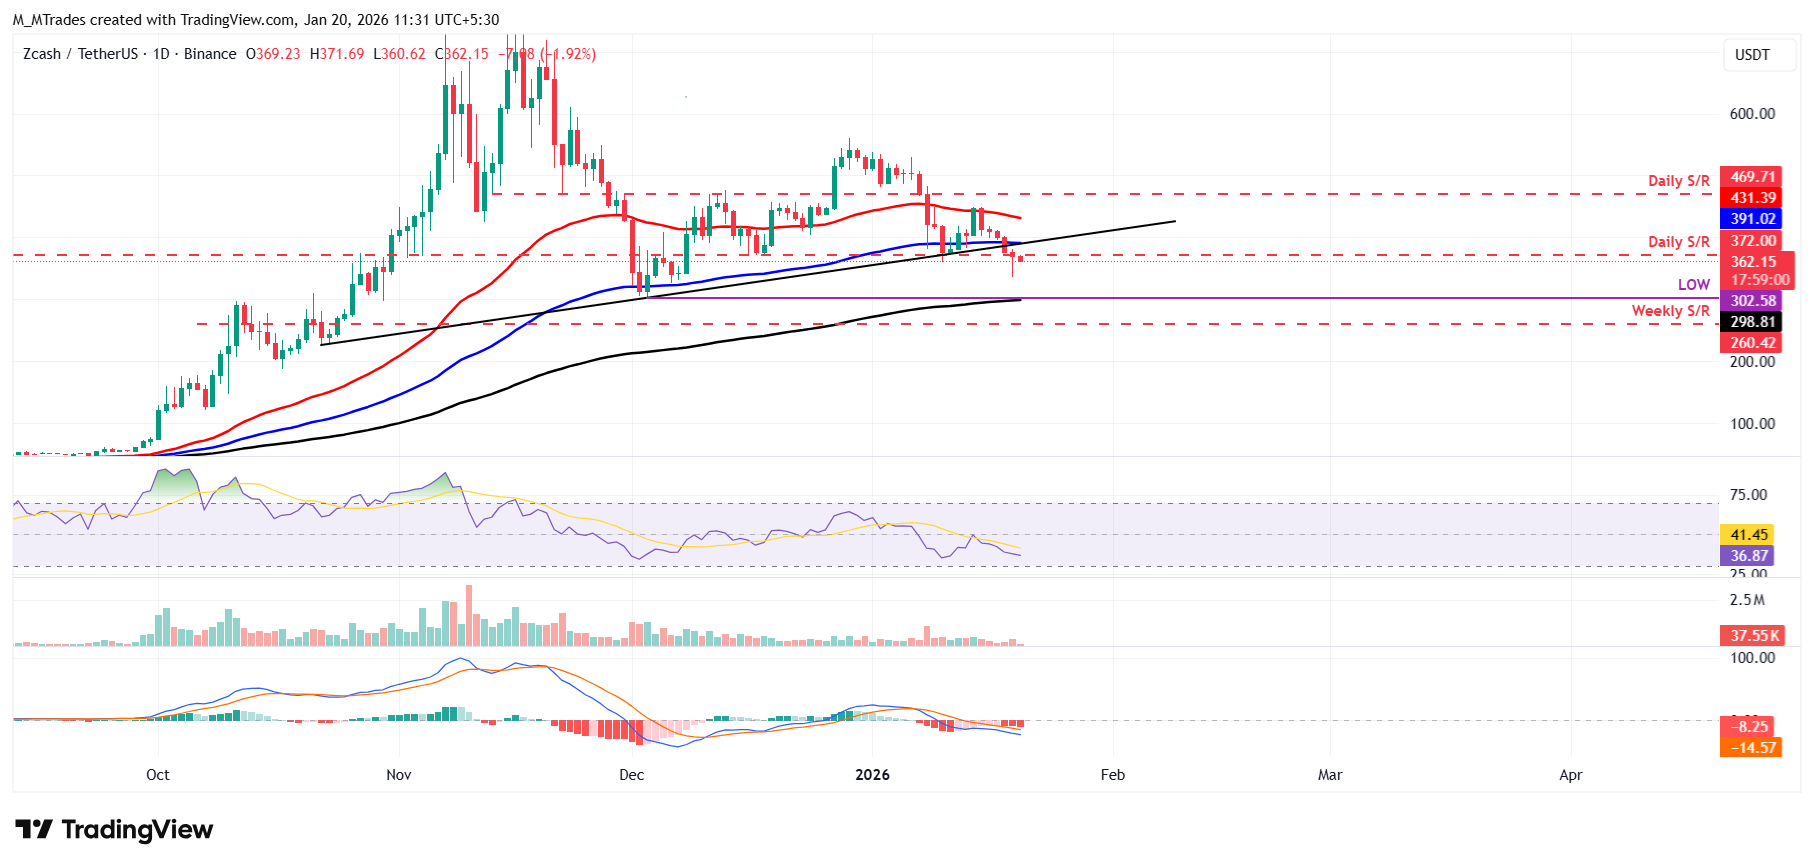
However, if ZEC recovers, it could extend its advance toward the 100-day EMA at $391.02.

超過一百萬用戶依賴 FXStreet 獲取即時市場數據、圖表工具、專家洞見與外匯新聞。其全面的經濟日曆與教育網路研討會協助交易者保持資訊領先、做出審慎決策。FXStreet 擁有約 60 人的團隊,分布於巴塞隆納總部及全球各地。
閱讀更多


