

XRP and XLM outlook: Extend corrective slide as mixed sentiment curbs recovery
- XRP trades in red on Tuesday, extending its previous week’s correction.
- XLM faces rejection after rebounding from the key support near $0.143.
- Mixed sentiment keeps recovery attempts in check, with traders remaining indecisive in the absence of a catalyst.
Ripple (XRP) and Stellar (XLM) are trading red on Tuesday as recovery momentum across both altcoins weakens. Mixed sentiment and broader market uncertainty continue to cap upside attempts, while traders remain indecisive amid the lack of a strong directional catalyst.
Mixed sentiment keeps traders cautious

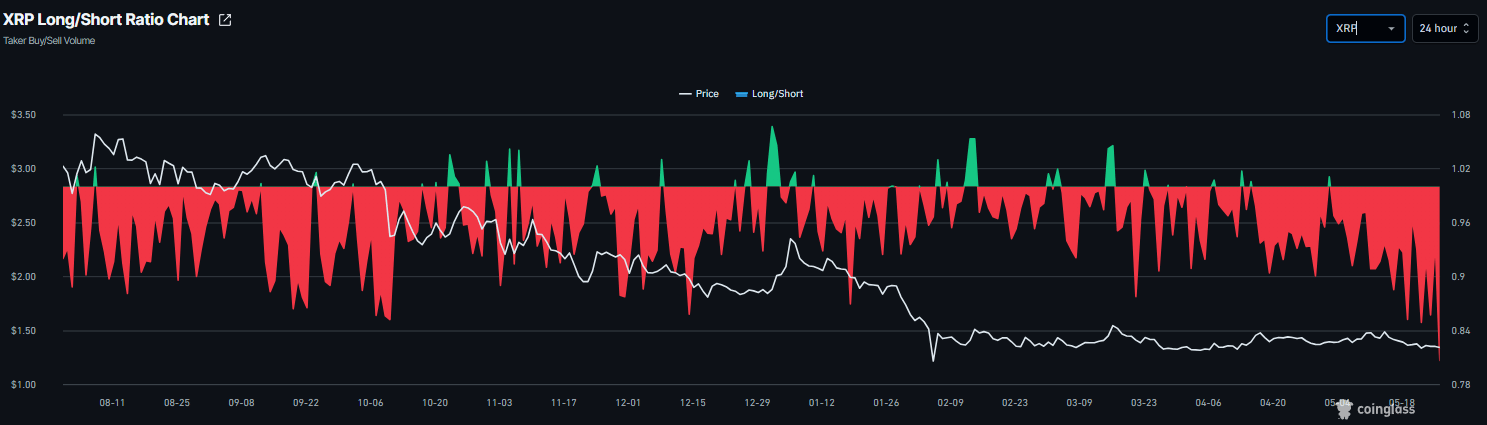
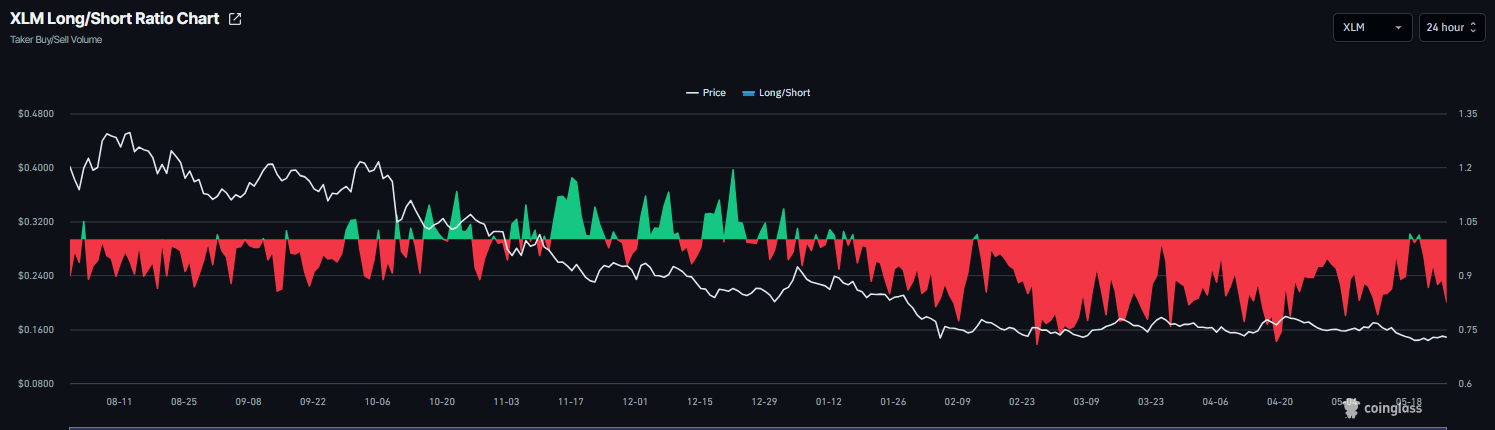
Derivatives data shows mixed sentiment with a slight bearish tilt. CoinGlass’ long-to-short ratio for both XRP and XLM reads 0.80 and 0.83, respectively, on Tuesday, the lowest levels over a month. The ratio being below one, indicates bearish sentiment, as traders are betting the assets' prices will fall.
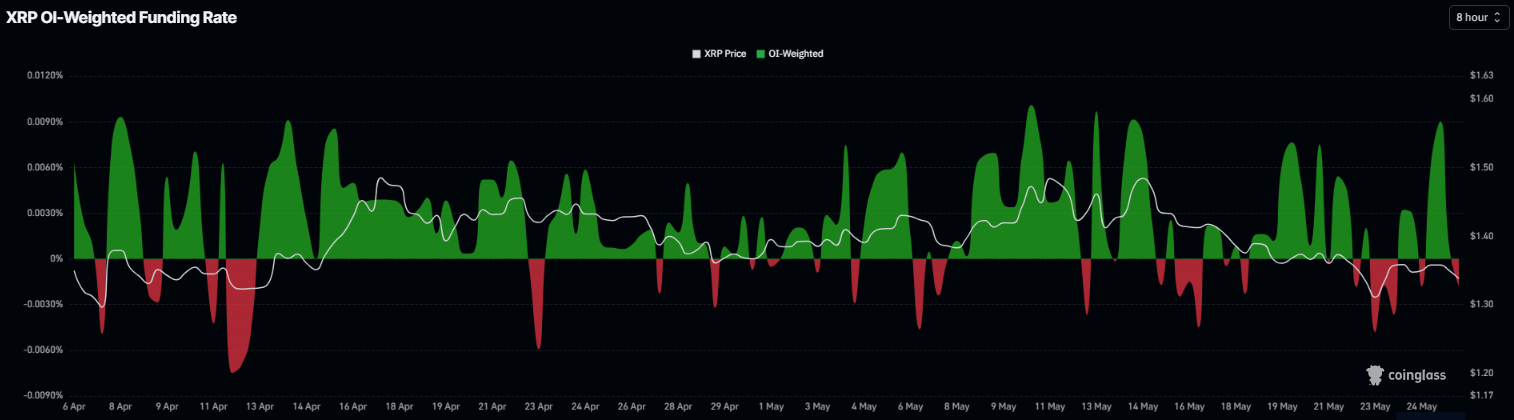
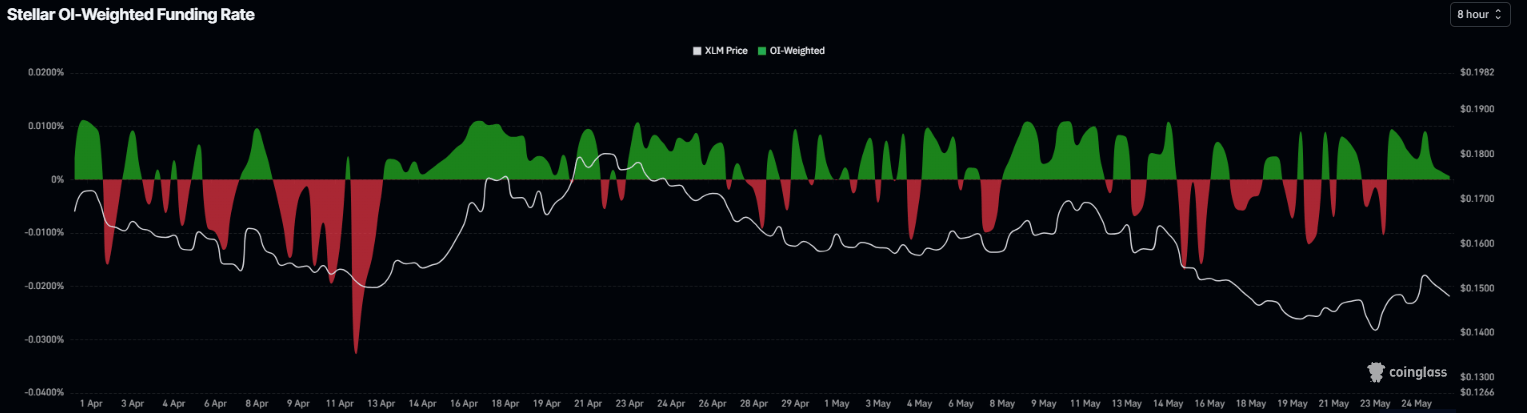
The funding rates also reflect a weakening outlook for both altcoins. XRP funding rates turned negative on Tuesday, while Stellar funding rates are drifting toward negative territory. These negative rates indicate that shorts are paying longs and project bearish sentiment.
Some signs of optimism
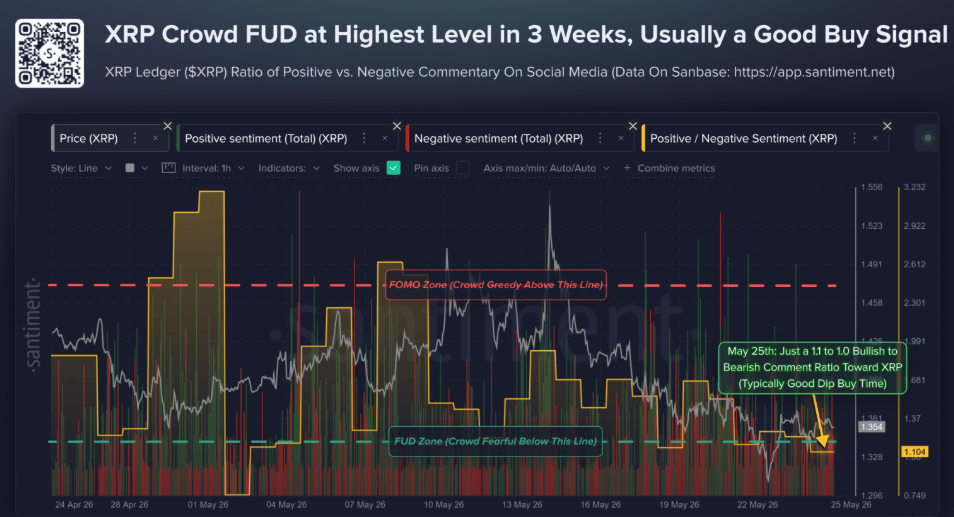
The Santiment chart below shows that the crowd’s fear, uncertainty and doubt (FUD) reached its highest level in three weeks. Historically, this kind of fear and skepticism has often acted as a contrarian signal for XRP’s price.
“When traders across social media become overly fearful, many weak hands have already sold, reducing selling pressure and creating conditions for a rebound,” noted the analyst.
The chart below shows that previous dips into the “FUD zone” were frequently followed by price stabilization or bounces shortly afterward.
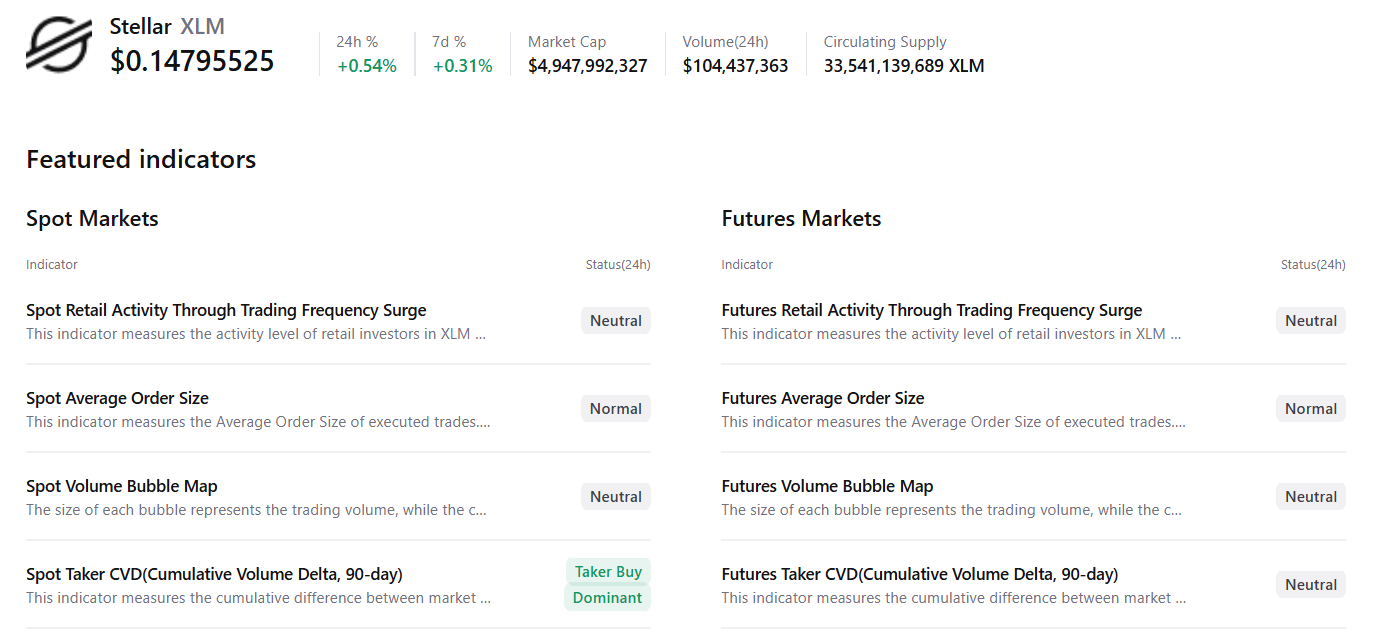
Meanwhile, CryptoQuant’s summary data shows a neutral to mildly bullish sentiment among XLM traders. XLM’s spot market shows buy-side dominance, with other altcoin metrics remaining largely neutral and hinting at mild signs of optimism.
XRP technical outlook: Holds a short-term bearish outlook
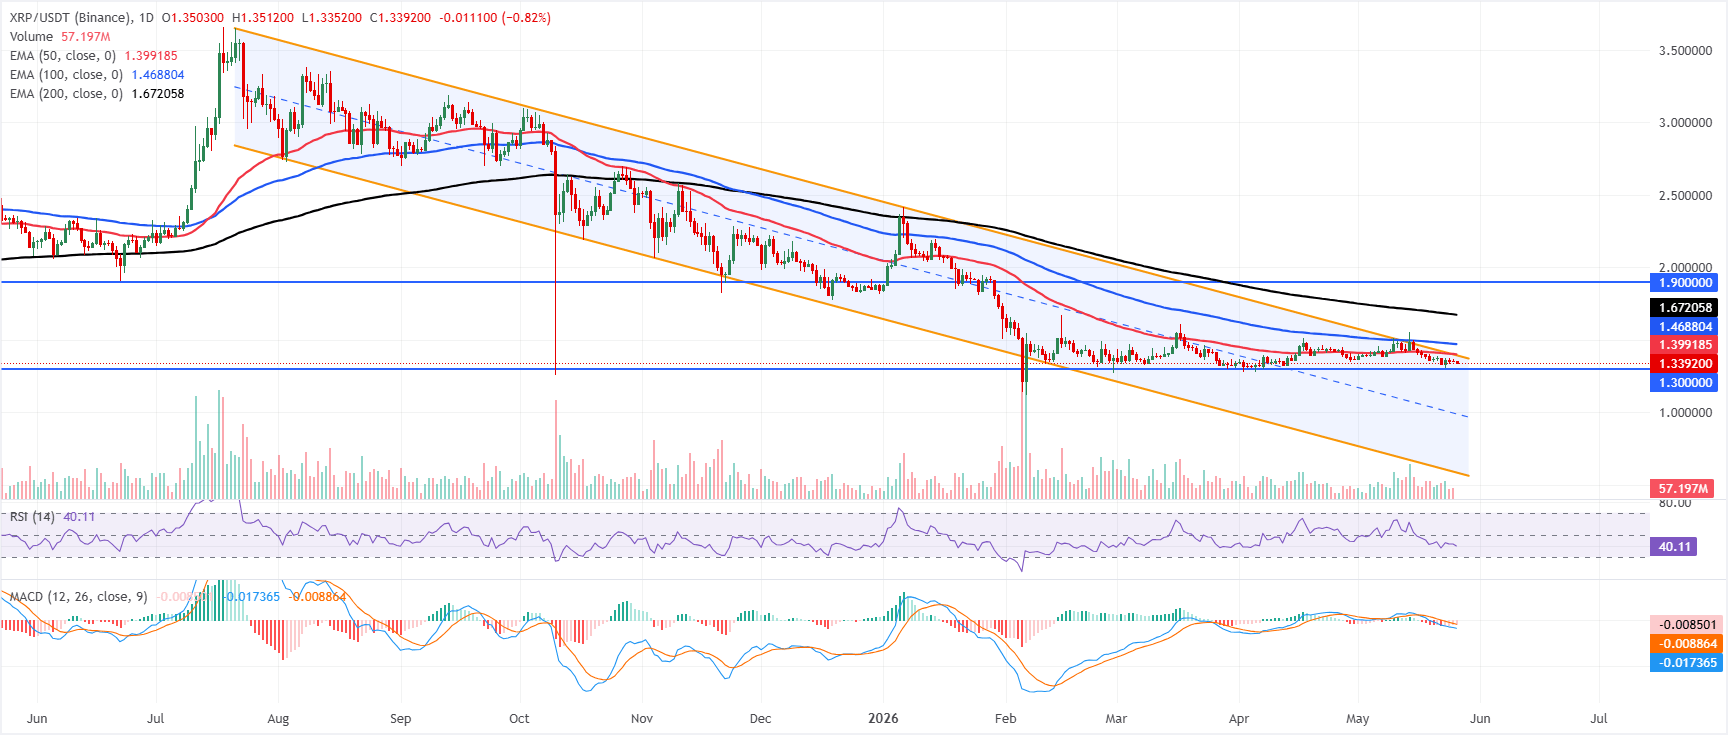
XRP price trades at $1.339, maintaining a bearish near-term bias as it sits well below the 50-day, 100-day, and 200-day Exponential Moving Averages (EMAs). XRP has slipped away from the downwards parallel channel reference around $1.391 and remains capped by clustered dynamic resistance starting at the 50-day EMA near $1.399, while the Relative Strength Index (RSI) is hovering close to 40. The Moving Average Convergence Divergence (MACD) lingering in negative territory both suggests persistent downside pressure rather than a decisive reversal.
On the topside, initial resistance is located around the former channel boundary at $1.391, followed by the 50-day EMA near $1.399, with additional barriers at the 100-day EMA around $1.468 and the 200-day EMA close to $1.672 before the more distant horizontal cap near $1.900.
On the downside, immediate support is only seen at the horizontal level around $1.300, and a clear break beneath this floor would likely open the door to a deeper extension of the prevailing corrective phase.
XLM technical outlook: Momentum indicators continue to weaken
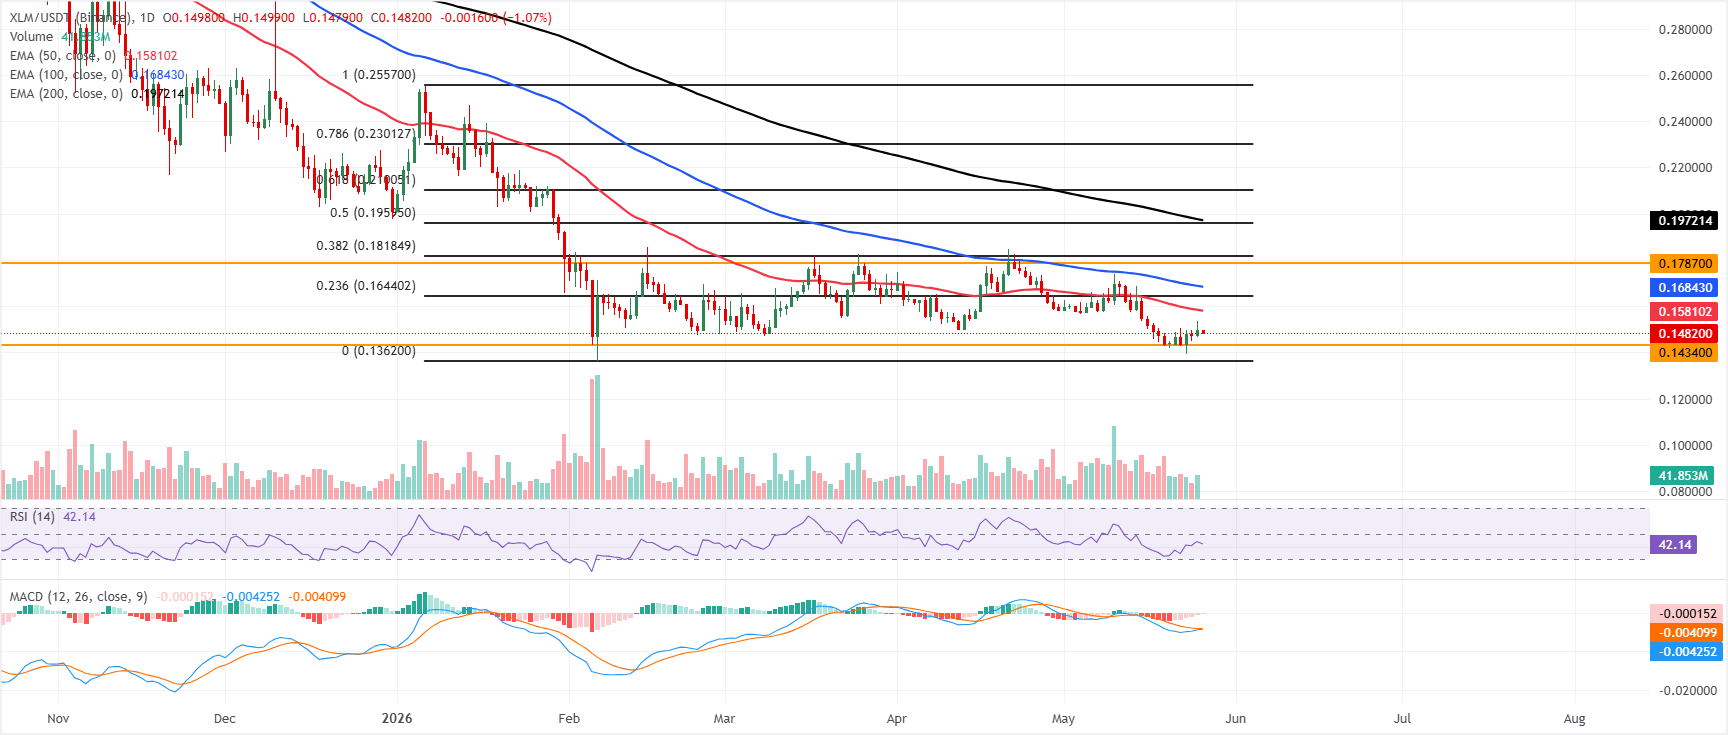
XLM trades at $0.148, holding within a broadly bearish configuration as it remains capped below the 50-day, 100-day, and 200-day EMAs at $0.158, $0.168, and $0.197, respectively. The RSI is near 42, and a slightly negative MACD reading suggests that downside pressure persists, even as the pair consolidates just above support.
On the downside, immediate attention sits on the nearby floor around the prior pivot zone near $0.148, ahead of horizontal support at $0.143; a break lower would expose the Fib anchor around $0.1362.
On the topside, initial resistance is seen at the 50-day EMA at $0.158, followed by the 23.6% Fibonacci retracement at $0.164 and the 100-day EMA at $0.168; beyond that, the horizontal barrier at $0.1787 and the 38.2% retracement at $0.181 guard the path toward the denser cluster around the 50% retracement at $0.195 and the 200-day EMA at $0.197, with the 61.8% retracement level higher up at $0.210.
(The technical analysis of this story was written with the help of an AI tool.)














