


Introduction
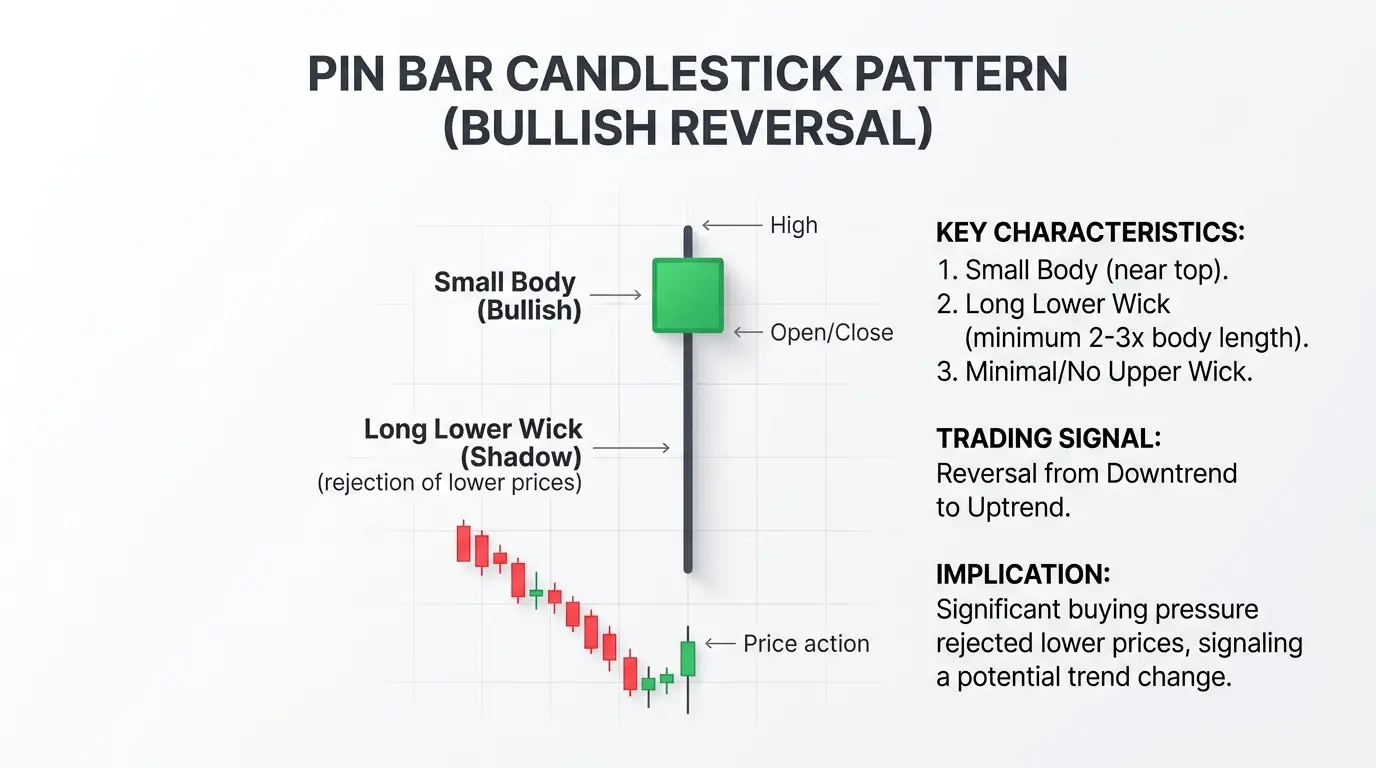
A pin bar candlestick pattern is a single candlestick pattern that shows strong rejection of a price area, usually through a long wick and a small body near one end of the candle. Traders use pin bars to spot potential reversals, confirm pullback continuation, and plan entries around support and resistance.
What Is a Pin Bar Candlestick Pattern?
A pin bar is a single candlestick pattern that shows the market tried to mov
e strongly in one direction, failed, and then closed back toward the opposite side of the candle. Its defining feature is a long rejection wick, also called the tail, paired with a small real body.
The pattern is popular in price action trading under technical analysis because it can reveal where order flow shifted quickly.
Some traders use pin bar as a broad price action term, while others classify similar candles more narrowly as a hammer or shooting star based on location and direction. In practice, traders use pin bar candlestick pattern across all markets like forex, gold, oil, stocks and so on.
How to Identify a Pin Bar Candlestick Pattern?
A valid pin bar candlestick pattern needs more than a long wick. The candle must show clear rejection and must form in a place where that rejection matters.
Use this checklist:
The rejection wick is clearly the largest part of the candle
The real body is small relative to the full range
The body closes near one end of the candle
The opposite wick is small or minimal
The pattern forms at support, resistance, a trend pullback zone, or a breakout retest
There is enough room to the next structure for acceptable reward to risk
For a bullish pin bar, the long wick is below price and the body closes near the high. For a bearish pin bar, the long wick is above price and the body closes near the low.
Important: A long wick alone is not a valid pin bar unless it rejects a meaningful price area and closes decisively away from that rejection.
How Does a Pin Bar Work in Price Action and What Signal Does It Give?
A pin bar reflects a failed trend. Price extends into one area, triggers breakout traders or stop losses, then strong opposing orders absorb the supply and force the candle to close back in the other direction.
That is why a pin bar often signals rejection, liquidity sweep, or short term control shifting from buyers to sellers or from sellers to buyers. The wick shows where the market probed, and the close shows which side regained control by the end of that candle.
Its trading significance depends on location. A bullish pin bar at higher timeframe support after a pullback can signal continuation higher, while a bearish pin bar at range resistance can signal rejection lower.
A pin bar in the middle of random consolidation has far less value. The pattern is a context driven signal, not a standalone trade command.
What Is the Difference Between a Bullish and Bearish Pin Bar?
The structural difference is simple, but the trading implication depends on where the candle forms.
| Feature | Bullish Pin Bar | Bearish Pin Bar |
|---|---|---|
| Main wick | Long lower wick | Long upper wick |
| Close location | Near the high | Near the low |
| Price Action | Buyers rejected lower prices | Sellers rejected higher prices |
| Context | Support, pullback in uptrend, failed breakdown | Resistance, rally in downtrend, failed breakout |
| Common Entry | Break above pin bar high or retrace entry | Break below pin bar low or retrace entry |
A bullish pin bar shows that sellers pushed lower but could not hold those prices into the close. A bearish pin bar shows that buyers pushed higher but failed to maintain the move.
Neither pattern is automatically a reversal signal.
Pro Tip: In strong trends, a pin bar often works better as a continuation entry after a pullback than as a countertrend reversal.
How to Trade a Pin Bar Candle Setup Step by Step?
In this example, price is in a clear downtrend, then prints a bullish pin bar near the lows.
Identify the location
The first step is to find the pin bar in the right location. In this chart, the bullish pin bar forms after a downtrend, which gives the pattern reversal potential. The long lower wick shows rejection of lower prices, while the small body near the upper part of the candle shows buyers regained control before the candle closed.
Wait for confirmation
The next step is to see whether the price responds to that rejection. In this example, confirmation comes as price begins to push higher after the pin bar and starts reclaiming nearby structures.
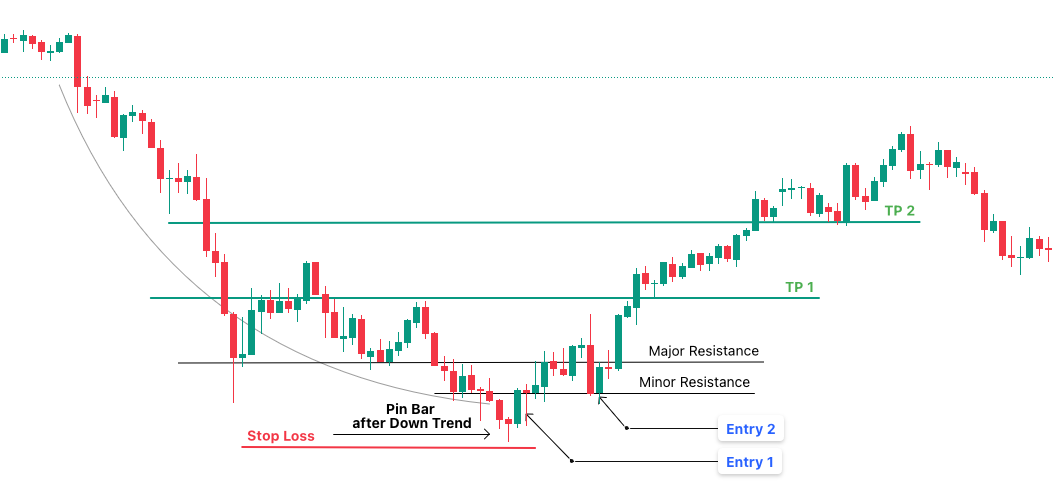
Plan the entry
Entry 1 is the more aggressive entry, taken earlier after the pin bar confirms and momentum starts to turn.
Entry 2 is the more conservative retest entry, taken after price pushes higher, reclaims structure, and then retests the breakout area before continuing up.
Place the stop loss
The stop loss is placed below the low of the pin bar. That is the logical invalidation level because if price breaks below the rejection tail, the bullish pin bar has failed and the reversal idea is no longer valid.
Map TP1 and TP2 before entry
The profit targets are based on chart structure, not fixed multiples alone. In this example, TP1 is drawn from a minor resistance level based on recent candle action, so it acts as the first realistic reaction zone. TP2 is drawn from a stronger resistance area built from price reactions across a much larger part of the chart, which makes it the more meaningful higher target.
Real World Example:
This USDJPY daily chart from August to November 2024 shows a classic bullish pin bar reversal sequence. Price sells off in a downtrend, forms a bullish pin bar, then turns higher. An aggressive trader can use Entry 1 to participate earlier, while a more conservative trader can wait for Entry 2, where price retests reclaimed structure before continuing higher. In both cases, the stop sits below the pin bar low, TP1 is based on the nearer minor resistance formed by recent candles, and TP2 is based on the stronger resistance level that has held across the wider chart.
How to Use a Pin Bar Candle With Support/Resistance and Indicators?
Using the same USDJPY daily chart from August to November 2024, you can clearly see how support and resistance explain where the trade makes sense, while technical indicators like MACD and RSI help confirm whether momentum is beginning to support the reversal. That combination gives traders a stronger decision framework than the pin bar alone.
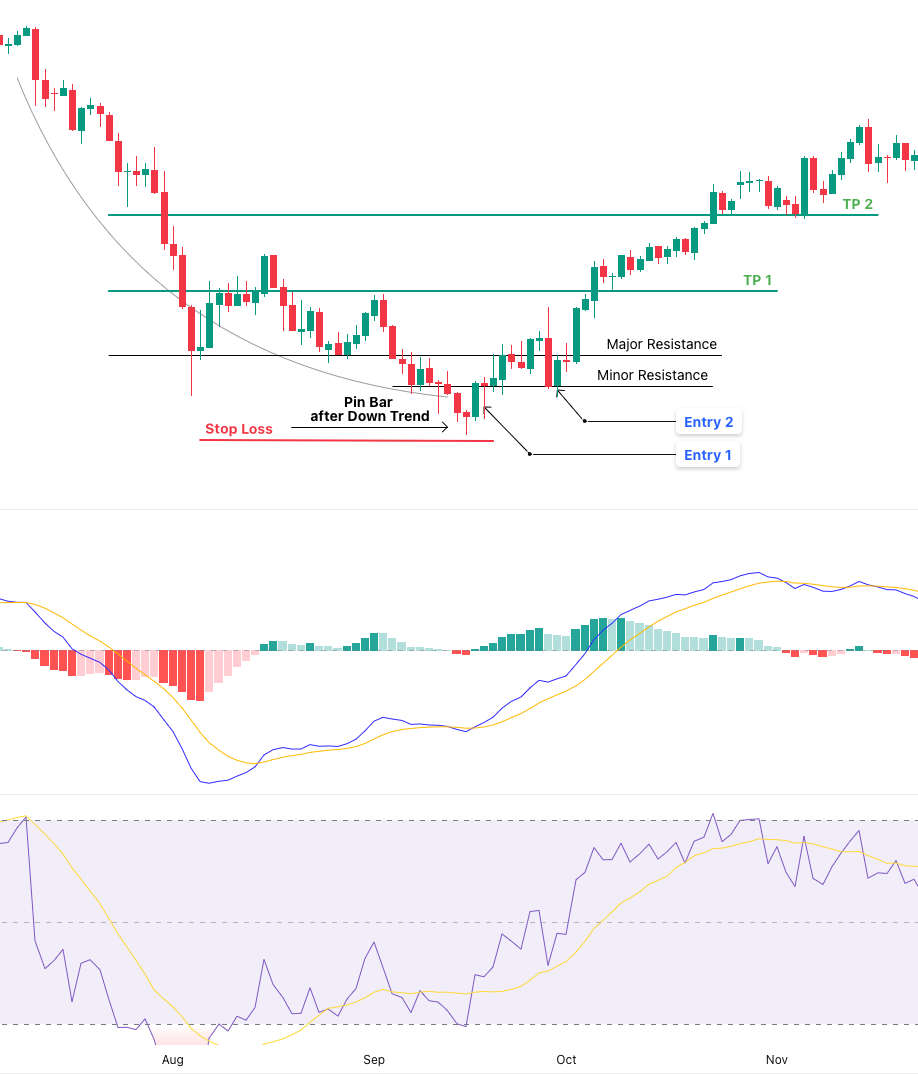
The first layer of confluence comes from support and resistance. After the bullish pin bar forms, price pushes into a nearby structure area marked by minor resistance and major resistance. Support and Resistance being major or minor helps you decide whether the reversal has enough strength to reclaim resistance.
The second layer of confluence comes from MACD. Around the pin bar and the candle right after it, the histogram flips from red to green, which shows bearish momentum is fading and bullish momentum is starting to build. At the same time, the MACD line crosses above the signal line, giving an early bullish crossover that supports the reversal attempt.
The third layer of confluence comes from RSI 14 with 14 SMA. Around the same area, RSI also begins to shift upward in strength, which suggests the bearish move is losing pressure.
This is especially useful when you can only see the pin bar and perhaps one candle after it. The pin bar itself shows price rejection, but the indicators help answer the next question, which is whether momentum is actually starting to turn. In this chart, MACD and RSI both support the idea that buyers are beginning to take control, which makes the setup more credible.
You can then use that confluence in two ways. An aggressive trader may take the earlier entry once the pin bar and immediate indicator shift appear, while a more conservative trader may wait for the reclaim and retest entry after structure is broken. In both cases, the stop loss remains below the pin bar low, TP1 is based on the nearer minor resistance formed by recent candles, and TP2 is based on the stronger resistance area built across a larger section of the chart.
Pro Tip: Use indicators to confirm that momentum agrees with the pin bar, not to justify a weak setup in poor location.
How Can Traders Improve Pin Bar Setup Reliability?
The first improvement is selectivity. Most weak results come from trading too many average setups instead of a small number of high quality setups.
Focus on these practices:
Trade pin bars at obvious chart levels, not inside clutter
Align the setup with the higher timeframe trend when possible
Prefer strong candle closes near the edge of the range
Make sure the rejection wick clearly stands out from nearby candles
Check that price has enough space to reach TP1 and TP2
Avoid entries directly into major news events
Review the instrument and session behavior because some markets print cleaner pin bars than others
Reliability also improves when the pattern matches market structure. A pin bar rejecting a pullback in trend often has more edge than a pin bar trying to reverse a strong impulsive move without support.
What Are the Risks and Limitations of Pin Bar Setups?
A pin bar candlestick can fail even when it looks clean.
The main limitations are:
False signals: A pin bar can form, trigger entries, then reverse again if larger participants are still pushing the original trend
Market noise: Lower timeframes often produce insignificant wicks (noise) caused by thin liquidity, spread effects, or short term stop runs
Timeframe variability: Daily and four hour pin bars usually carry more weight than very low timeframe pin bars
Subjectivity: One trader may classify a candle as a pin bar while another rejects it based on wick ratio, body size, or location
Execution risk: News volatility can cause slippage, wide spreads, and poor fills even when the setup idea is correct
This is why tyou need predefined rules. If the criteria for wick size, close location, and trade context are vague, the pattern becomes too flexible to test properly.
What Mistakes Do Traders Make With Pin Bars?
The most common mistake is treating every long wick as a trade. A pin bar only has edge when it forms at a level that matters and fits the broader structure.
Common mistakes include:
Entering before the candle closes
Ignoring the higher timeframe trend
Taking a countertrend pin bar straight into strong momentum
Placing the stop loss too tight inside the wick
Trading directly into nearby support or resistance
Forcing confluence with too many indicators
Taking setups with weak reward to risk just because the candle looks good
The single biggest mistake is failing to separate reversal setups from continuation setups. A pin bar rejecting a pullback in trend and a pin bar trying to fade a strong breakout require different expectations, targets, and management.
Pro Tips to Trade Pin Bars More Effectively
Professional improvement usually comes from process, not prediction. Traders who handle pin bar trading well tend to use the same repeatable framework every time.
Use these pro level practices:
Start top down
Mark higher timeframe structure first, then look for pin bars on the execution timeframe.Choose the right entry model
Breakout entries confirm momentum, while retrace entries improve reward to risk. Use the one that fits volatility and nearby structure.Scale the exit plan
TP1 can reduce risk and lock partial profit, while TP2 lets the trade capture a larger structural move.Track MFE and MAE in a journal
Measuring maximum favorable excursion and maximum adverse excursion helps refine stop placement and target logic.Grade setups, do not just label them
Score each trade by location, trend alignment, wick quality, confirmation, and available space. This creates a testable model instead of a vague pattern habit.
The edge in a price action strategy does not come from spotting more pin bars. It comes from filtering aggressively and managing risk with discipline.


