


Key Takeaways:
The MACD (Moving Average Convergence Divergence) is a trend and momentum indicator that compares short and long exponential moving averages to generate crossover, divergence and histogram signals, which traders can combine with moving averages, RSI, volume, Fibonacci levels and trendlines across different timeframes to confirm entries and exits, manage risk and practice strategies on demo.
MACD is calculated by subtracting the 26 period EMA from the 12 period EMA to form the MACD line, then taking a 9 period EMA of that line as the signal line, and finally plotting the histogram as the difference between the MACD and signal lines so traders can see trend shifts and momentum strength through these three components.
Traders often combine MACD with other tools by using it alongside moving averages, RSI, volume analysis, Fibonacci retracements, and trendline trading strategies to confirm trends, momentum, and potential reversals.
Traders should treat MACD as a support tool by choosing timeframes that match their strategy, combining MACD with other indicators, avoiding sideways markets, applying strict risk management, and first testing setups on a demo account before trading live.
You can practice MACD strategies without risking real capital by using a demo account and experimenting with different indicator combinations and timeframes until you feel confident.
You can practice MACD strategies risk free by using paper trading or demo accounts to test setups with virtual funds in real time and by backtesting your rules on historical price data, allowing you to refine MACD settings, get comfortable with the platform, and assess performance metrics like win rate, risk reward, and drawdown across different market conditions without risking actual capital.
What is MACD Indicator?
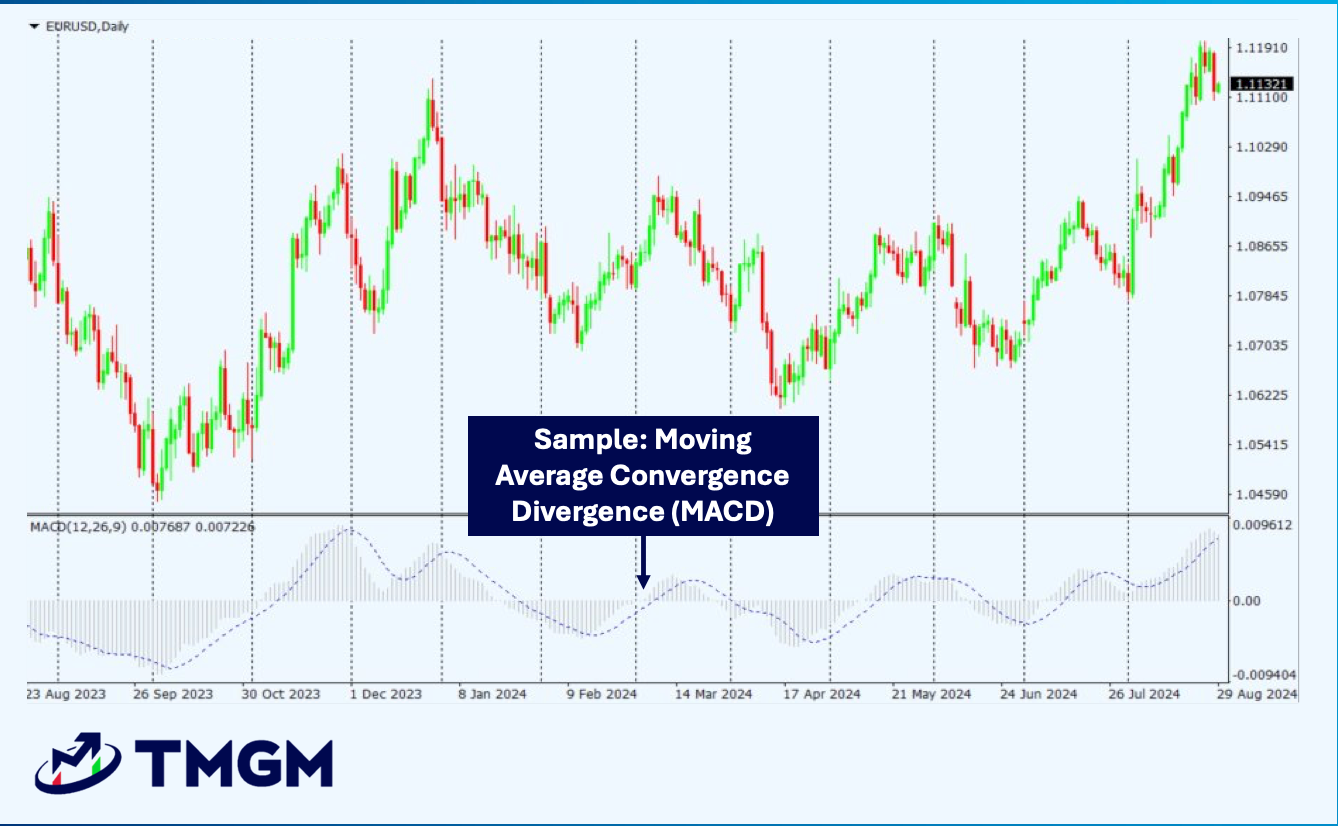
The MACD (Moving Average Convergence Divergence) is a technical analysis indicator that reveals changes in the strength, direction, and momentum of a trend in a security's price. It is calculated by subtracting a longer-term exponential moving average (EMA) from a shorter-term EMA, with default settings typically being the 12-period and 26-period EMAs. A third line, which is a 9-period EMA (Signal Line) of the MACD line itself, is plotted on top asto help identify potential buy and sell signals through crossovers.
How is MACD Calculated?
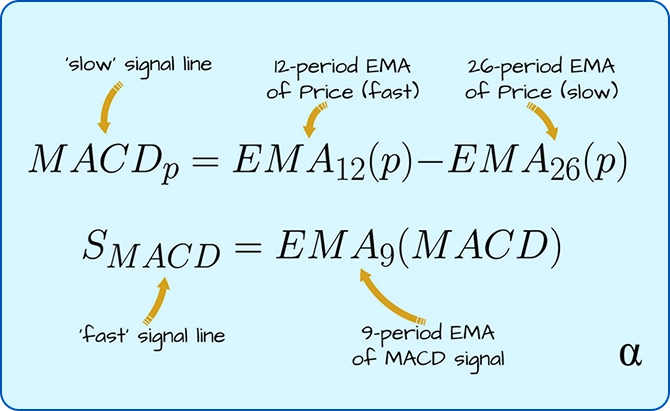
MACD is calculated in three steps: first, subtract the 26-period exponential moving average (EMA) from the 12-period EMA to get the MACD line. Second, calculate the 9-period EMA of the MACD line to get the signal line. Third, subtract the signal line from the MACD line to create the histogram.
The Three Key Components of MACD:
MACD Line: The difference between the short-term and long-term EMAs, signaling trend changes.
Signal Line: A 9-day EMA of the MACD line, which generates buy or sell signals.
Histogram/Price Chart: A visual representation of the difference between the MACD and signal lines, indicating momentum strength.
Histogram: Difference between the MACD and signal lines
How to Identify MACD Crossovers & MACD Divergence?
1. MACD Crossovers:
MACD crossovers are a technical analysis signal that occurs when the MACD line intersects its signal line, indicating a potential change in momentum. A bullish crossover happens when the MACD line crosses above the signal line, suggesting an upward trend, while a bearish crossover happens when it crosses below the signal line, suggesting a downward trend.
Bullish Crossover: The MACD line crosses above the signal line — may suggest upward momentum.
Bearish Crossover: The MACD line crosses below the signal line — may indicate downward momentum.
2. MACD Divergence:
MACD divergence is a trading signal that occurs when the price of a security and the Moving Average Convergence Divergence (MACD) indicator move in opposite directions. It suggests a potential reversal in the asset's price trend because momentum is diverging from the price action.
Positive Divergence: Price forms lower lows while the MACD forms higher lows — could signal a bullish reversal.
Negative Divergence: Price forms higher highs while the MACD forms lower highs — could indicate a bearish reversal.
How to use MACD Indicator with other Indicators?
How to combine MACD with Moving Averages
To combine MACD with moving averages, use the moving average to identify the primary trend and MACD for entry and momentum confirmation.
Buy signal – Wait for the price to be above the moving average and the MACD line to cross above its signal line, ideally with the histogram turning green and moving above zero.
Sell signal – The price should be below the moving average, and the MACD line should cross below its signal line, with the histogram turning red and moving below zero.
How to use MACD and RSI (Relative Strength Index)
To use the MACD and RSI together, use the MACD to confirm the trend's strength and direction, and the RSI (Relative Strength Indicator) to identify overbought or oversold conditions for potential entry and exit points.
A bullish trade can be confirmed when the MACD shows upward momentum and the RSI is moving out of the oversold zone (below 30)
Bearish trade is suggested when the MACD indicates downward momentum and the RSI is exiting the overbought zone (above 70).
How to use MACD with Volume Analysis
Volume can also be used to confirm breakouts and validate divergences in the MACD, which might signal trend changes. To use MACD with volume analysis, combine MACD signals with volume to confirm trends and identify potential reversals.:
Look for rising volume during a bullish MACD crossover to confirm a stronger uptrend
Look for falling volume during a bearish crossover to confirm a weakening trend.
Combining MACD with Fibonacci Retracement
To use MACD with Fibonacci retracement, plot the Fibonacci tool on a clear price trend to identify potential support and resistance levels, then look for a MACD crossover at these Fibonacci retracement levels to confirm a trade entry in the direction of the trend.
Identify key levels: Focus on the key retracement levels like 38.2%, 50%, and 61.8% as potential areas of support (in an uptrend) or resistance (in a downtrend).
Use MACD for confirmation: Wait for the price to pull back to a key Fibonacci level (like 38.2%, 50%, or 61.8%) and use a bullish MACD crossover (MACD line crossing above the signal line) to confirm a potential long entry.
How do I use MACD with Trendline Trading Strategy?
To use the MACD with a trendline strategy, first identify the trend and draw trend lines on the price chart. Then, use MACD signals for confirmation: look for a bullish MACD crossover (line crossing above signal line or zero line) during an uptrend, or a bearish crossover during a downtrend.
A MACD crossover that aligns with a trendline trading signal or opportunity increases confidence in a trade entry.
Trendline breaks combined with MACD divergence can suggest early signs of trend reversal.
Important Notes & Limitations of MACD
Choose the Right Timeframe: TMGM’s flexible charting options allow you to select timeframes that align with your trading strategy, whether short-term or long-term.
Combine Indicators: To confirm MACD signals, use TMGM’s extensive technical tools, such as Bollinger Bands or Fibonacci retracements.
Avoid Sideways Markets: TMGM’s real-time market data helps identify clear trends, avoiding unreliable MACD signals in choppy markets.
Implement Risk Management: Use TMGM’s stop-loss and take-profit features to protect your capital and secure gains.
Practice with a Demo Account: You can test MACD strategies risk-free on TMGM’s demo account before applying them to live markets.
How to Practice MACD Strategies Risk-Free?
You can practice MACD strategies risk-free using demo accounts (paper trading) and backtesting. These methods allow you to apply your strategies to real-time or historical market data without risking any actual capital.
1. Paper Trading (Demo Accounts)
Paper trading, or simulated trading, is the most common way to practice in a risk-free environment. Most brokers and trading platforms offer free demo accounts with virtual funds.
How it works: You get access to a full suite of features, including real-time market data and advanced charting tools, but you trade with virtual money. This mimics the actual trading experience without financial exposure.
Benefits: It helps you get comfortable with the trading platform, test various MACD settings, and understand how the indicator performs in current market conditions. It also helps in managing the psychological aspect of trading, though the emotional response may differ from using real money.
2. Backtesting
Backtesting involves applying your MACD strategy to historical market data to see how it would have performed in the past.
How it works: You use specialized software or even manual analysis on historical charts to identify past trade signals and track hypothetical profits and losses.
Benefits: This method allows you to evaluate the effectiveness and reliability of a strategy across diverse market conditions (trending, sideways, volatile) over long periods. It helps identify flaws in the strategy and determine key metrics like win rate, average win/loss ratio, and maximum drawdown.
Why Trade with TMGM?
TMGM offers a suite of tools and resources to maximize the effectiveness of your trading strategies:
Advanced Charting Tools: Customize your MACD analysis with detailed charts and overlays.
Diverse Asset Selection: Trade forex, indices, commodities, and more, including popular cryptocurrencies.
Fast Execution: Experience lightning-fast trade execution for optimal entry and exit.
Educational Resources: Access webinars, tutorials, and guides to improve your trading skills.


