


Double Top and Double Bottom at a Glance
A double top is a bearish chart pattern that forms after an uptrend.
A double bottom is a bullish chart pattern that forms after a downtrend.
The most important pattern features are two tests of a key level, a clear prior trend, a visible neckline, and confirmation on the breakout.
Higher time frames usually produce cleaner signals.
What are Double Top and Double Bottom Patterns?
Double top and double bottom patterns are trend reversal chart patterns. A reversal pattern signals that the prior trend is losing control and a move in the opposite direction may begin.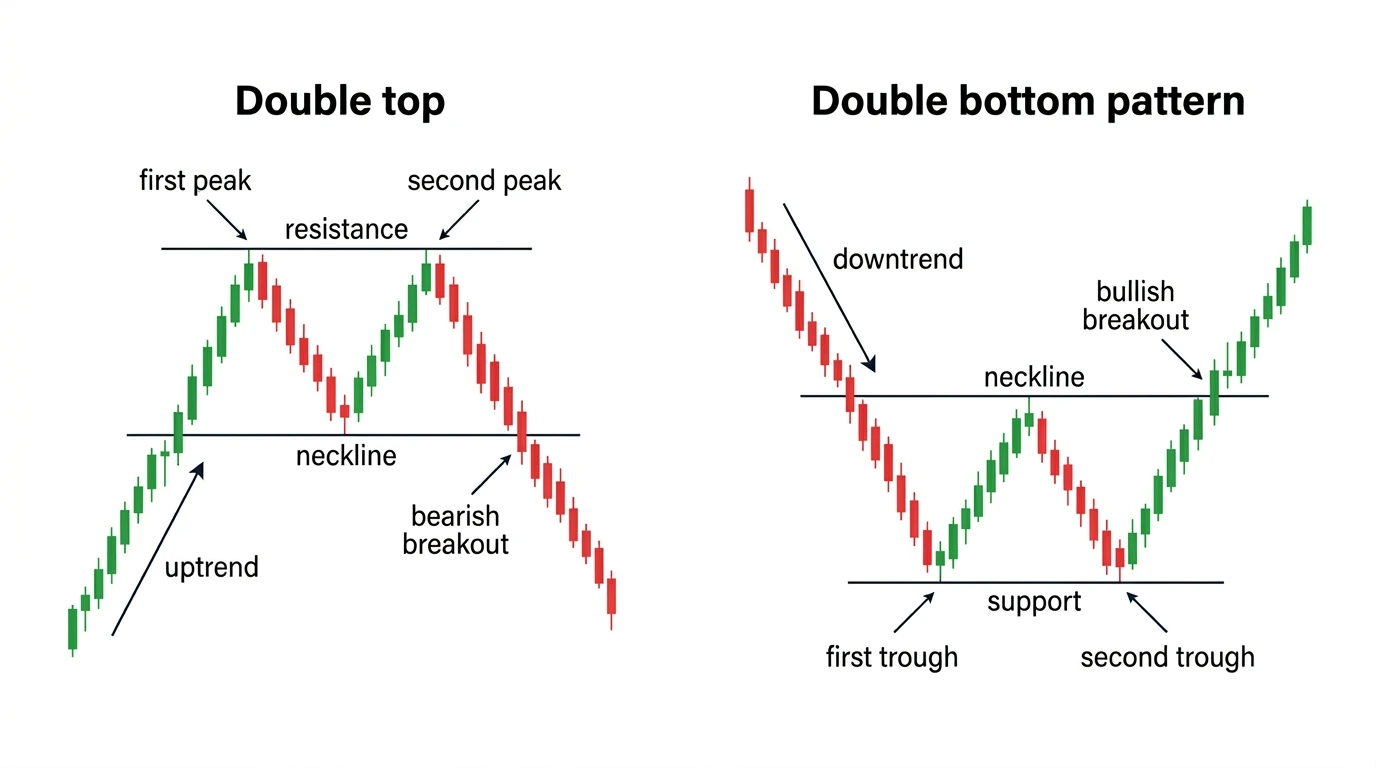
Double top pattern explained
A double top is a bearish reversal chart pattern that forms after an uptrend. It looks like an M shape because the price reaches a resistance area twice, fails both times, and then starts to turn lower.
Double bottom pattern explained
A double bottom is a bullish reversal chart pattern that forms after a downtrend. It looks like a W shape because price reaches a support area twice, holds both times, and then starts to turn higher.
Why are these considered reversal patterns?
These patterns are considered reversal patterns because they both show the price action mechanism of the current trend losing strength at a key price level. A double top shows buyers failing to break resistance on the second test. A double bottom shows sellers failing to break support on the second test.
How to Identify Double Top and Double Bottom Patterns on a Chart
How a double top forms in five steps
A double top becomes valid only after the structure forms and price confirms the break.
Confirm a clear uptrend before the first peak.
Mark the first peak and the pullback that follows it.
Watch for a second peak near the same resistance level rather than a clean breakout above it.
Draw the neckline at the pullback low between the two peaks.
Treat the setup as a potential double top until the neckline breaks.
How a double bottom forms in five steps
A double bottom follows the same logic in reverse.
Confirm a clear downtrend before the first trough.
Mark the first trough and the rebound that follows it.
Watch for a second trough near the same support level rather than a clean break below it.
Draw the neckline at the rebound high between the two troughs.
Treat the setup as a potential double bottom until the neckline breaks.
Double Top vs Double Bottom: Quick Comparison
Trading Double Top Pattern (Bearish)
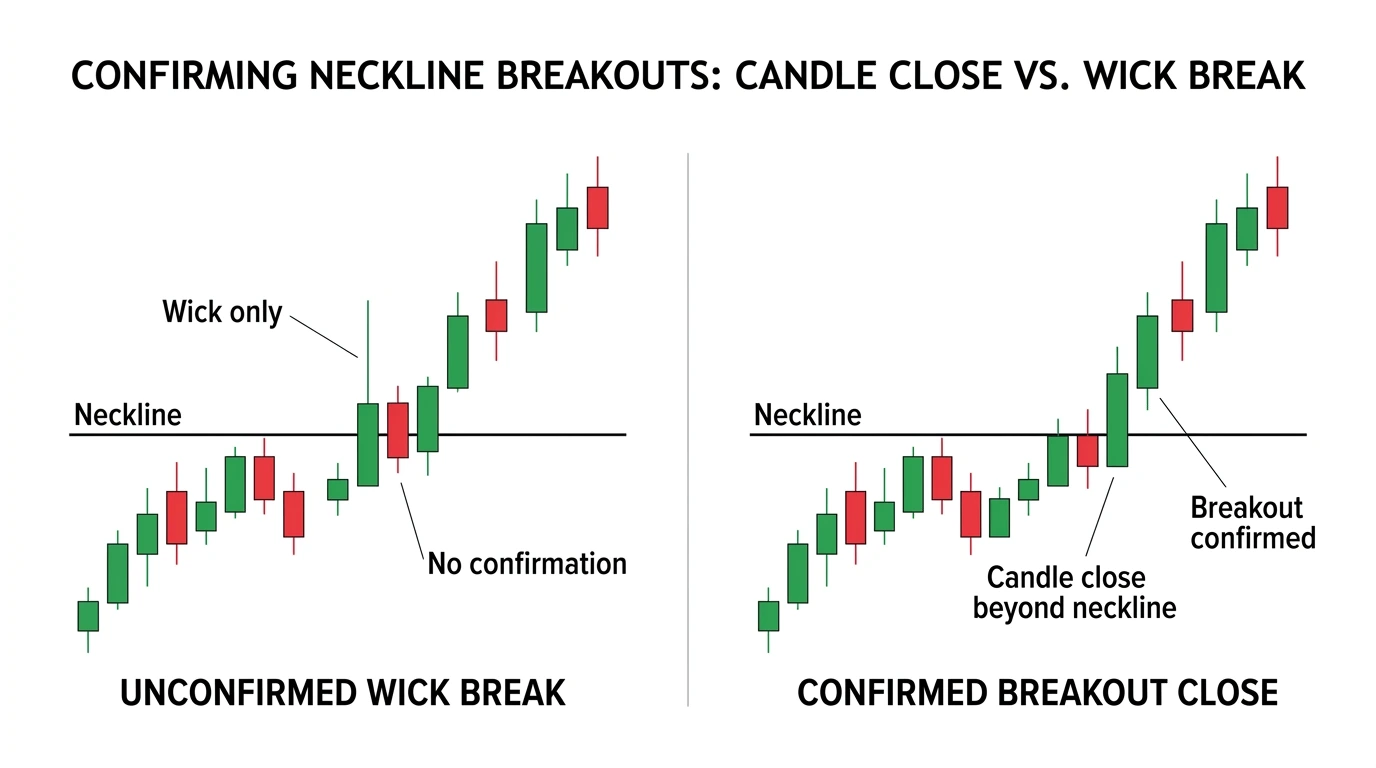
When the bearish signal is confirmed
The bearish signal is confirmed when price closes below the neckline. A wick below the neckline does not confirm the pattern because price can reverse before the candle ends.
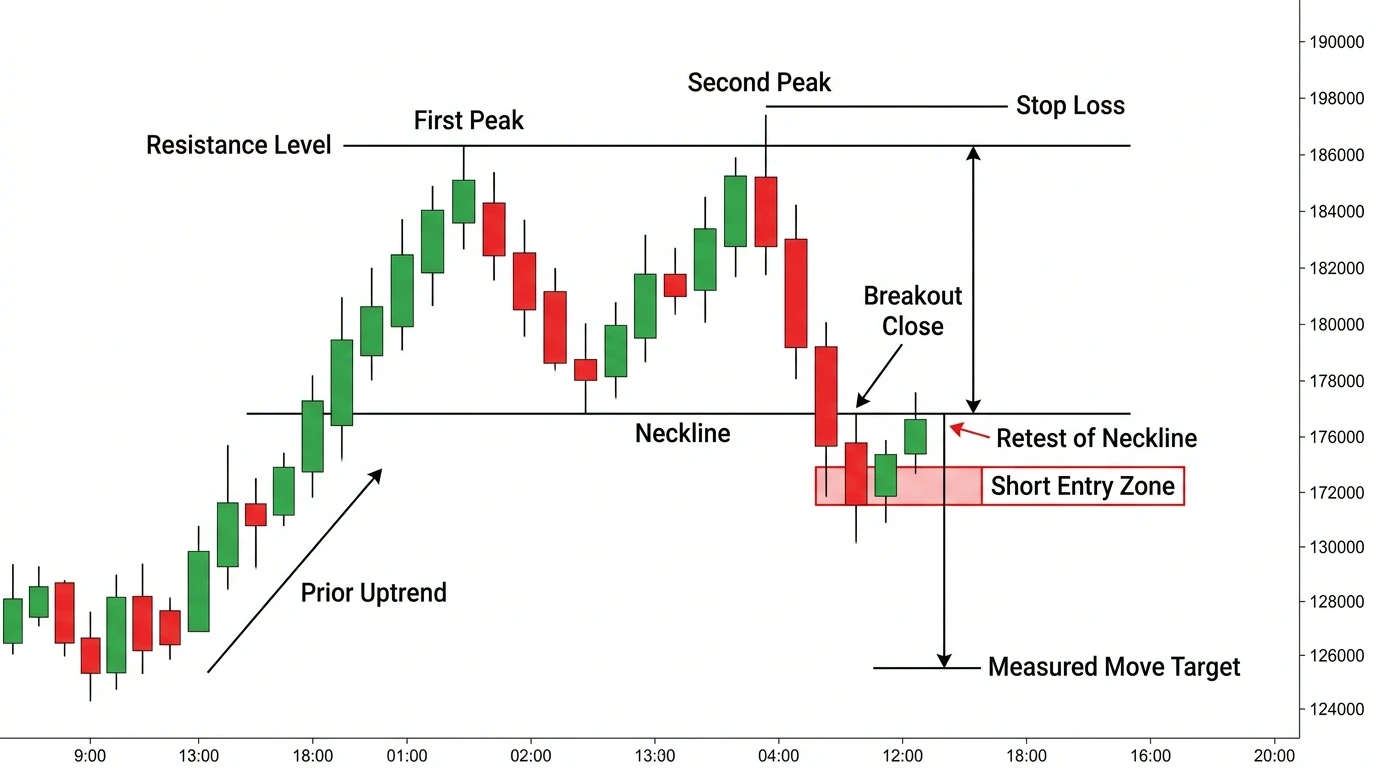
Entry point
You can enter on the breakout candle close or on a retest of the neckline from below. The breakout close gives earlier participation. However, the retest can offer lower risk but may not occur.
Stop loss placement
Stop loss level can be placed above the second peak. That level invalidates the bearish setup if buyers regain control.
Profit target projection (measured-move formula)
The profit target is based on the height of the pattern. Measure the distance from the neckline to the highest peak. Project that same distance downward from the neckline. The result is the minimum expected move after the breakout.
Formula: Target = Neckline − (Peak − Neckline)
Example: Neckline at 100, peak at 110. The distance is 10. The target is 90.
Pro Tip: The measured-move target is a minimum, not a ceiling. Many traders take partial profits at the target and trail the stop on the remainder.
Trading Double Bottom Pattern (Bullish)
When the bullish signal is confirmed
A double bottom confirms when price closes above the neckline. A wick above the neckline does not confirm the pattern because price can still fail before the candle ends.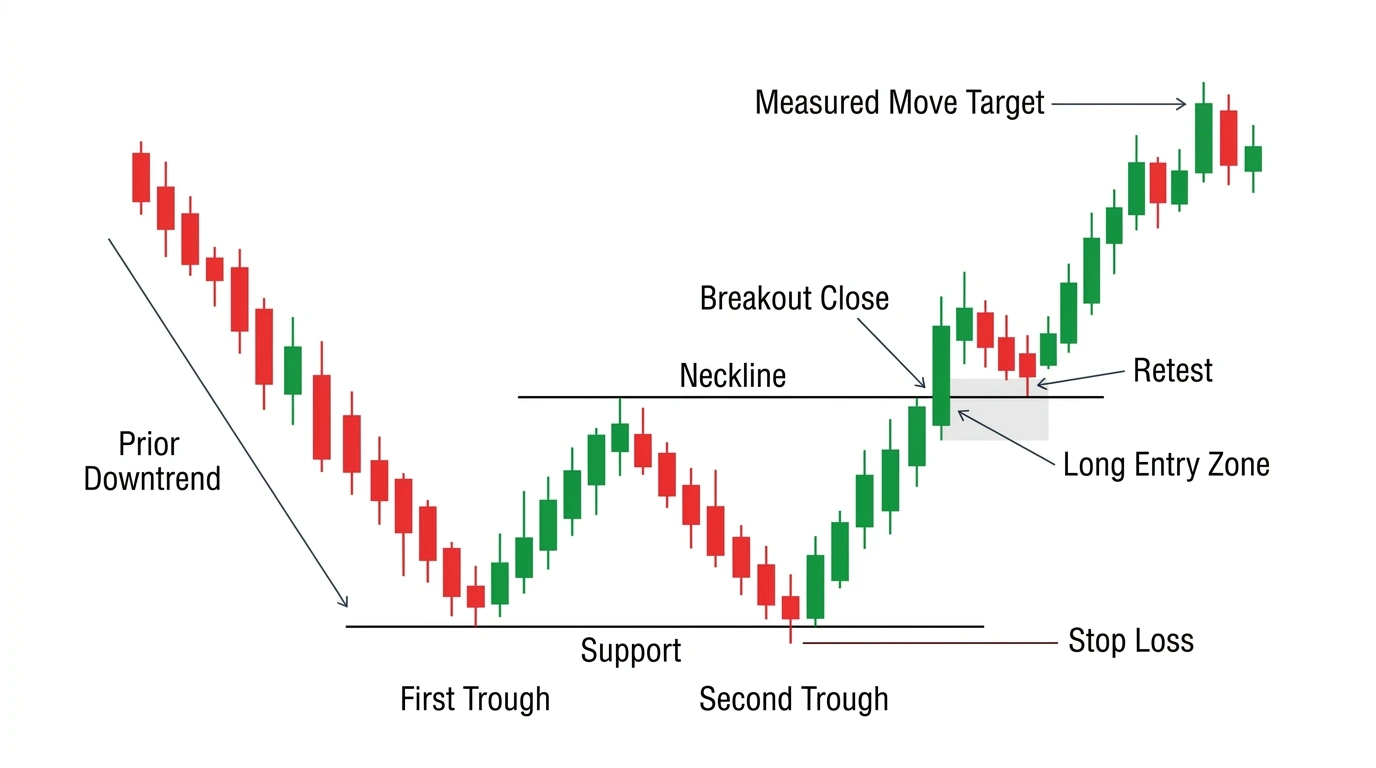
Entry point
Traders usually enter on the breakout candle close or on a retest of the neckline from above. The breakout close enters earlier. The retest can reduce risk but may not happen.
Stop loss placement
The standard stop loss sits just below the second trough. That level invalidates the bullish setup if sellers break support again.
Profit target projection (measured-move formula)
The profit target uses the same logic as the double top, applied in reverse. Measure the distance from the trough to the neckline. Project that same distance upward from the neckline. That gives the minimum expected move after the bullish breakout.
Formula: Target = Neckline + (Neckline − Trough)
Example: Trough at 90, neckline at 100. The distance is 10. The target is 110.
Trading Considerations
Timeframe Reliability
Higher time frames usually produce more reliable double top and double bottom patterns because daily and weekly charts contain less noise than intraday charts. A pattern on a daily or weekly chart usually carries more weight than the same shape on a five minute chart.
RSI and Volume Confirmation
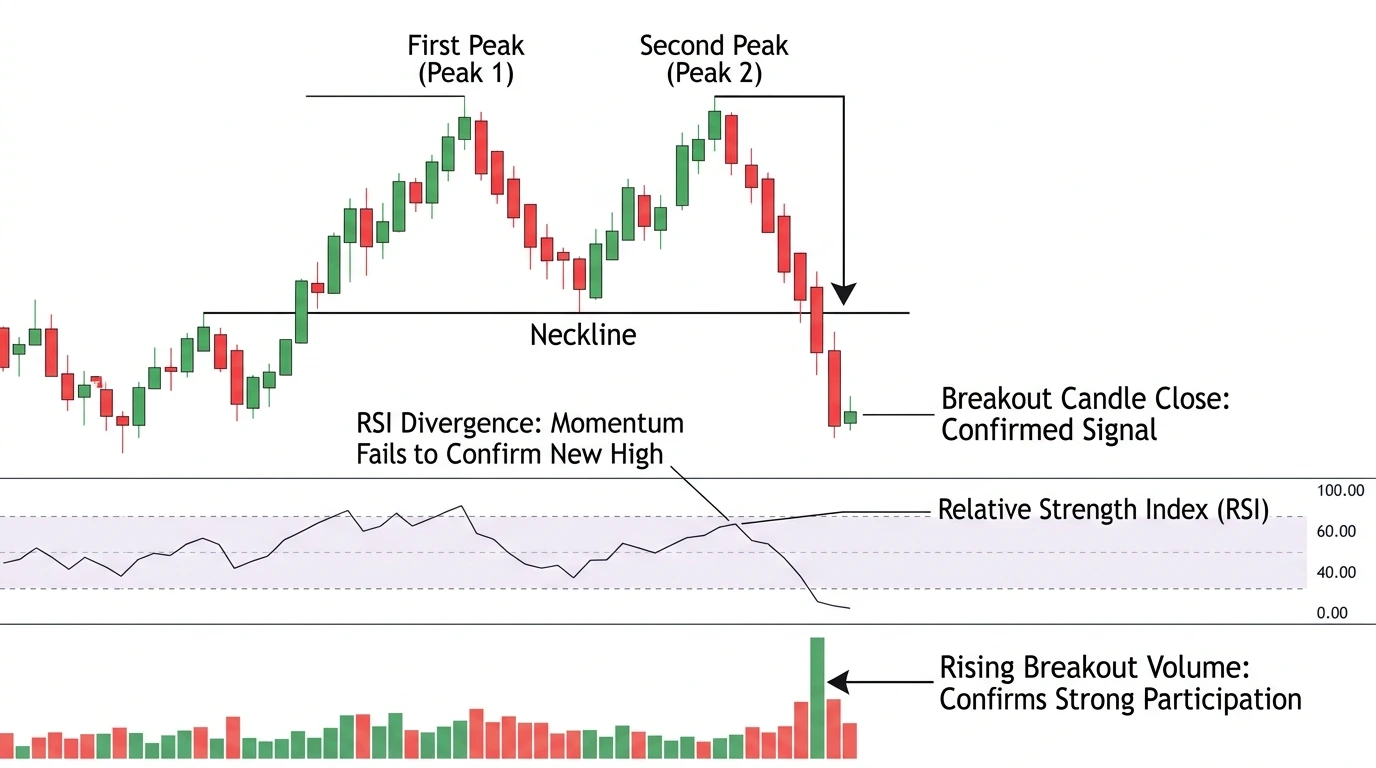 RSI divergence on the second peak or second trough strengthens the setup because momentum fails to confirm price. A volume surge on the neckline break adds confirmation because the breakout has broader participation.
Support and Resistance After the Breakout
The neckline changes role after the break. A broken neckline can become new resistance after a double top or new support after a double bottom. Traders often use that level for new entries, stop adjustment, or failed breakout checks.
Pro Tip
A clean retest of the flipped neckline often offers a better risk to reward entry than chasing a large breakout candle.
What Are the Pros and Cons of Trading Double Top and Double Bottom Patterns?
Double top and double bottom patterns are useful because they give traders a clear reversal structure, a visible invalidation level, and a measured target. However, they also confirm late, can produce false breakouts, and tend to be less reliable in noisy market conditions.
Pros of Trading Double Top and Double Bottom Patterns
Clear pattern structure
These patterns are easy to recognize because they form around two visible tests of the same level and a clear neckline.
Defined trade planning
The neckline, second peak or trough, and measured move give traders a clear framework for entry, stop loss, and target placement.
Works across multiple markets
Double tops and double bottoms appear in forex, stocks, indices, commodities, and crypto, so the pattern is widely usable.
Easy to combine with confirmation tools
RSI divergence, volume expansion, and nearby support or resistance can help traders filter stronger setups from weaker ones.
Useful for reversal trading
These patterns help traders identify trend exhaustion and prepare for a possible change in direction.
Cons of Trading Double Top and Double Bottom Patterns
Confirmation comes after the move starts
Because the pattern confirms only on the neckline break, part of the reversal may already be gone before the trade is entered.
False breakouts are common
Price can break the neckline, trigger the trade, and then reverse back into the pattern. This is more common in lower time frames and choppy conditions.
Not every M or W shape is valid
A similar shape inside a sideways range is not enough. The pattern still needs a clear prior trend and a meaningful neckline.
Measured move targets are guides, not guarantees
The projected target is a planning tool, not a promise. Some moves stall before reaching it, while others extend beyond it.
Strong trends can override the setup
In a powerful trend, the second peak or second trough may be only a pause before the original trend resumes.
Risk Management When Trading These Patterns
How much should traders risk per trade?
Many traders cap risk at 1 to 2% of account equity on one trade. On a $1,000 account, a hard ceiling is $20 per trade. Position size should shrink if the stop loss distance is wide.
How to set a risk reward ratio
A double top or double bottom trade should usually offer at least a 1:2 risk to reward ratio. If the trade risks $20, the minimum realistic target is $40. The measured move target from the neckline and the peak or trough helps traders test that ratio before entry.
What to do if the trade fails
Traders should honour the stop loss and exit the trade without adjustment. Moving your stop loss is the most common way beginners turn a small loss into a large one.
Important: Bulkowski's research on busted double tops found that when a confirmed pattern reverses back above the neckline, the subsequent move upward averages 38%, meaning a failed double top can itself become a tradable setup in the opposite direction [Bulkowski, T.N. Encyclopedia of Chart Patterns, 3rd ed., Wiley — thepatternsite.com/BustDoubleTops.html ]
Common Mistakes Beginners Make With Double Top and Double Bottom Patterns
Entering before confirmation
Many beginners enter as soon as the second peak or second trough appears. That increases the chance of trading a setup that never confirms. Wait for a candle close beyond the neckline, or use additional confirmation before entering.
Mistaking a Sideways Range for a Reversal Pattern
A double top needs a clear uptrend. A double bottom needs a clear downtrend. Many beginners see two peaks or two troughs inside a sideways range and label them as reversal patterns. Before marking the setup, check whether price was moving clearly in one direction before the two turning points. If the market has been moving sideways for weeks, the pattern is invalid regardless of shape.
Placing the stop loss in the wrong area
A double top stop loss belongs above the second peak. A double bottom stop loss belongs below the second trough. Position size should then adjust so total account risk stays inside the percentage limit set in the risk management plan.
Trading Tips for Beginners
Wait for neckline confirmation: Always wait for the neckline candle close before entering. Patience is the edge in pattern trading.
Use higher timeframes: Start with the daily or weekly chart, then drop lower only if the same structure is still clear.
Keep a trading journal: Log every pattern you spot, whether you trade it or not. Pattern recognition improves faster with written review.


