


Fundamentaldaten: Warum hat Silber 2026 ein Rekordhoch erreicht?
Der aktuelle Silber-Boom von 2024 bis 2026 wird hauptsächlich durch Bewertungs-Hype angetrieben. Dies geschah aufgrund einer Rotation von Goldinvestoren mit dem Ziel der Absicherung. Das Verständnis des Ungleichgewichts zwischen Angebot und Nachfrage ist entscheidend, um diese Bewegung von einem vorübergehenden Preissprung zu unterscheiden.
1. Die Nachfrage der Investoren’
Der aktuelle Zyklus begann Ende 2024. Zunächst führte Gold die Rally an, angetrieben durch Käufe der Zentralbanken. Als Gold sich 2025 konsolidierte, "rotierte" das Momentum in Silber—ein klassisches Marktphänomen, bei dem risikoaverses Kapital von dem überbewerteten (nun mit höherem Rückschlagsrisiko behafteten) Gold in das unterbewertete Schwester-Metall Silber umgeschichtet wurde.
Dies wird durch die Tatsache deutlich, dass die vermeintlichen fundamentalen Kräfte, die eine gesunde Rally antreiben sollten, nämlich die physische Silbernachfrage, durch den World Silver Survey 2025 des Silver Institute’ widerlegt wurden.
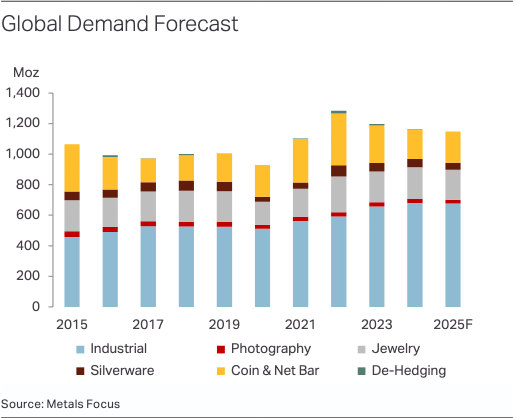
Nachfolgend ist ein Diagramm von Metals Focus zur globalen Nachfrageprognose nach Sektoren dargestellt, das zeigt, dass die wichtigsten Treiber der physischen Nachfrage, Industrie und Münzen, zurückgegangen sind und sich stabilisiert haben, anstatt zuzunehmen.
Während die physische Nachfrage also schwach ist, ist die Absicherungsnachfrage stark, begleitet von einem Rückgang des frei verfügbaren Angebots am Markt sowohl an Chinas Shanghai Gold Exchange (SGE) als auch an der London Bullion Market Association.
2. Metals Focus: Die Angebotsklippe
Während die Absicherungsnachfrage steigt, fällt das Angebot.
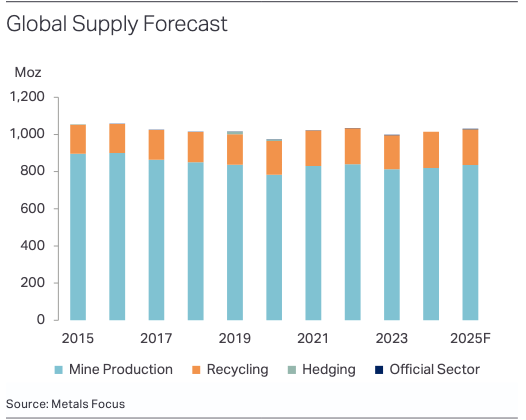
Stagnation der Minenproduktion: Die Daten von Metals Focus zeigen, dass die globale Minenproduktion seit fünf Jahren stagnierend bis rückläufig ist. Große Produzenten wie Mexiko und Peru sehen sich mit sinkenden Erzgehalten und einem Mangel an neuen Investitionen konfrontiert.
Das Defizit: Der Markt befindet sich seit sechs aufeinanderfolgenden Jahren in einem strukturellen Defizit . Das kumulierte Defizit (2021–2026) hat mehr als 800 Millionen Unzen aus den globalen Lagerbeständen entfernt—und damit den in den letzten zehn Jahren aufgebauten Überschuss faktisch ausgelöscht.
Das World Silver Institute – ”2025 wird das fünfte Jahr in Folge markieren, in dem Silber ein erhebliches Defizit verzeichnet, das sich für 2021–25 auf fast 800 Moz (25.000 t) summiert. Das ist eindeutig nicht nachhaltig, und deshalb erläutern wir nachfolgend, was bevorstehen könnte.”
3. Der "Squeeze": Shanghai vs. London (LBMA)
Dies ist, wie bereits erwähnt, der eigentliche "rauchende Colt" für die Rally 2026.
Shanghai-Prämie: Physisches Silber wird in Shanghai mit einem Aufschlag von fast 10 USD/oz (ca. 11 %) über den Londoner Benchmarks gehandelt. Diese Arbitrage-Lücke bestätigt, dass die durch den Einzelhandel getriebene Knappheit real ist—asiatische Industriegiganten und Einzelhandelsmärkte zahlen jeden Preis, um sich Metall zu sichern.
Abfluss aus den Tresoren: Gleichzeitig sind die Bestände in den LBMA- (London) Tresoren auf Mehrjahrestiefs gefallen. Da Goldinvestoren in Silber-ETFs (wie SLV) rotieren, werden Barren dem "frei verfügbaren Bestand" entzogen, was die Leasingsätze nach oben treibt und Leerverkäufer zum Eindecken zwingt.
Diese hohe Nachfrage in Verbindung mit dem Angebotsmangel treibt den aktuellen Silber-Boom an.
Technische Analyse: Sollte man 2026 jetzt noch Silber kaufen?
Kurz gesagt zeigt die technische Analyse, dass die Silberpreise derzeit weiterhin stark sind, sich aber bereits in der überkauften Zone befinden. Überkaufte Vermögenswerte bedeuten jedoch nicht immer zwangsläufig einen sicheren und unmittelbaren Rücksetzer; tatsächlich bleiben viele starke Assets, insbesondere solche in einem sogenannten 'Superzyklus', lange Zeit in der überkauften Zone.
Die jüngste Kursentwicklung von Silber’ stützt diese Sicht ebenfalls: Nach einer Rally bis auf etwa 121 USD schien das Momentum nachzulassen und der Preis fiel auf rund 106 USD zurück, bevor er sich bis zum 30. Jan. 2026 wieder auf etwa 116 USD erholte. Diese Art von Rückgang und Erholung ist in starken Aufwärtstrends üblich, in denen überkaufte Bedingungen anhalten können, während sich der Markt durch Konsolidierung statt durch eine tiefe Umkehr “neu ausrichtet”.
Dennoch ist es weiterhin sinnvoll, mit einem 'vorsichtig bullischen' Ansatz vorzugehen.
1. Gold/Silber-Ratio (GSR)
Die GSR bewegt sich derzeit nahe 50:1, nach einem Rückgang von 80:1.
Historisches Extrem: In starken Bullenmärkten fällt dieses Verhältnis oft über das Ziel hinaus bis auf 30:1 oder sogar 15:1 (das bedeutet, dass 1 Goldbarren nur 15 Silberbarren kaufen kann).
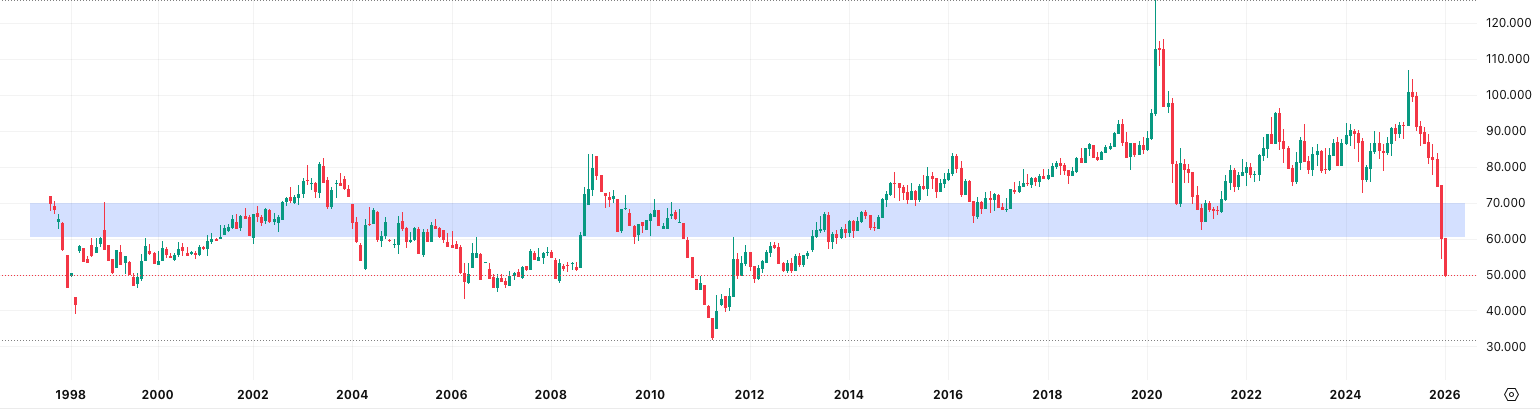
Das Signal: Der Gold/Silber-Index war der wichtigste Frühindikator. Historisch stabilisiert sich die Gold/Silber-Ratio (GSR) in einer mittleren Spanne von 60:1 bis 70:1. Derzeit fällt das Verhältnis in Richtung 50:1. Wenn sich dieser Trend aufgrund fundamentaler Kräfte fortsetzt, muss Silber Gold deutlich outperformen, um historische Normen wiederherzustellen.
Wenn Sie mehr über die Preisbeziehung zwischen Gold und Silber erfahren möchten, lesen Sie unseren Artikel über die Gold/Silber-Ratio , um sich auf Ihren nächsten Gold- oder Silber-Trade vorzubereiten.
Ausblick der technischen Analyse: Angesichts der aktuellen Kursentwicklung und Marktstruktur gibt es weder eine Verlangsamung des Momentums noch auch nur einen vorübergehenden Rücksetzer. Daher hat diese Rally aus Sicht der technischen Analyse bislang keine Anzeichen von Schwäche gezeigt und stützt damit einen bullischen Ausblick.
2. Silber-Wochenchart: Die "Überkauft"-Warnung
Im Wochenzeitraum haben XAG/USD -Investoren den Chart nahezu vertikal gemacht. Der Relative-Stärke-Index (RSI) liegt jedoch deutlich über 80, was trotz fehlender Anzeichen einer Momentum-Abschwächung für eine Haltung ‘bullisch mit Vorsicht” spricht.
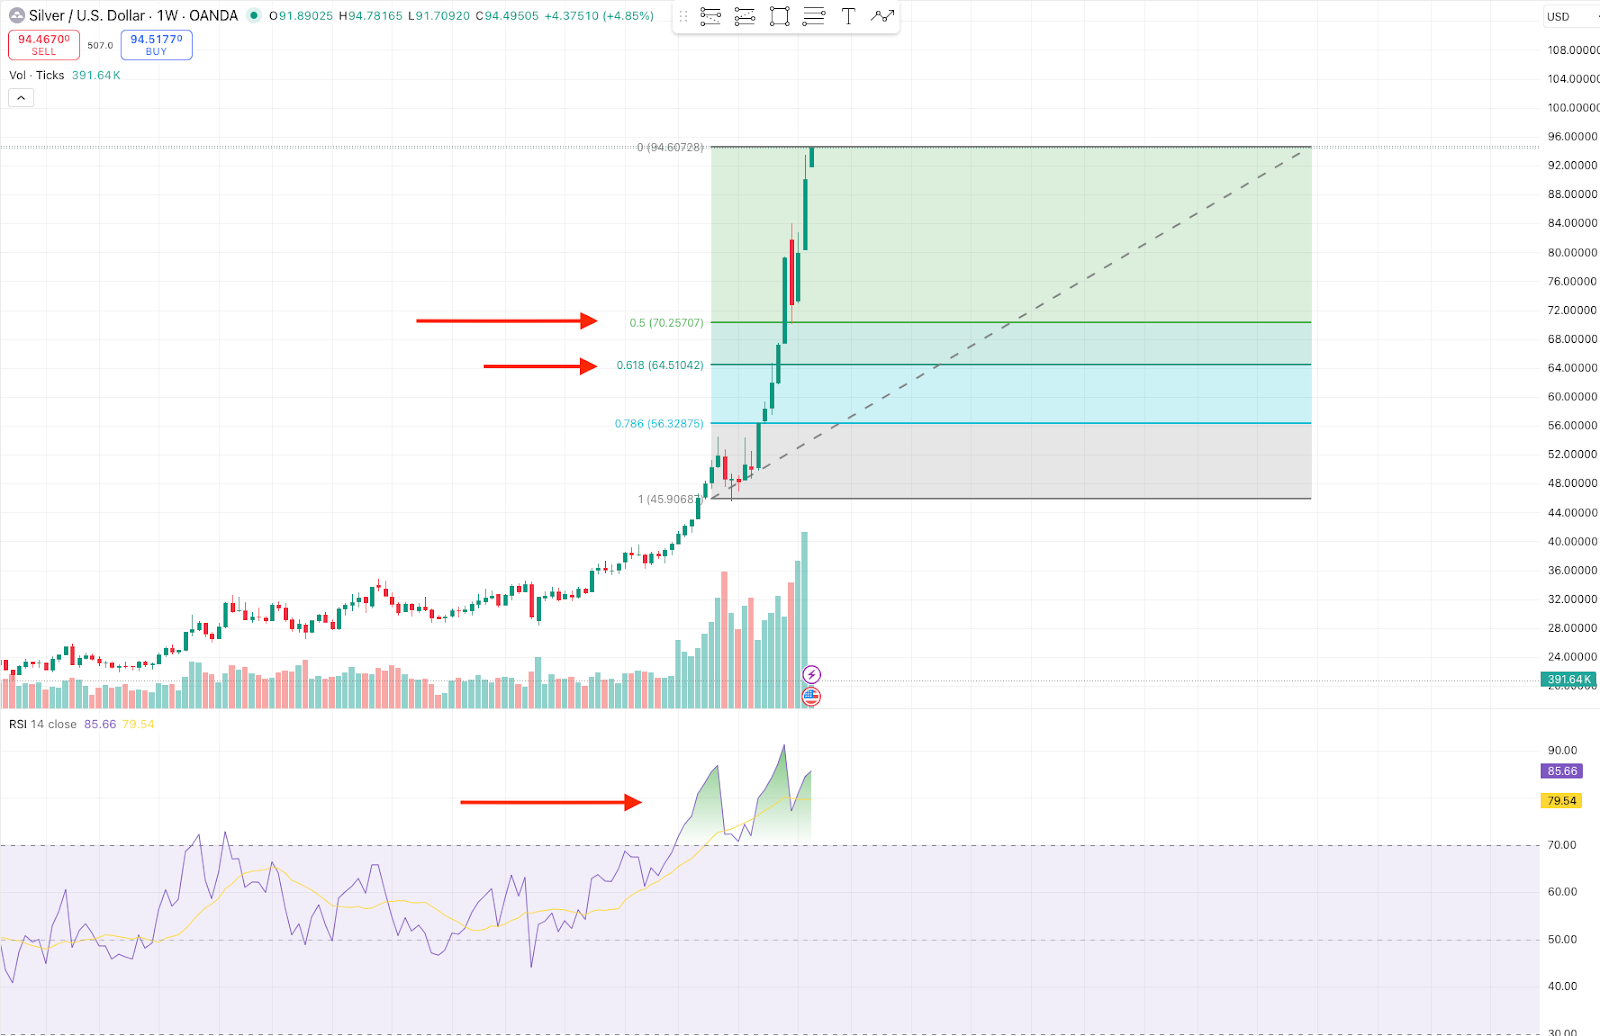
Warum vorsichtig sein? Historisch betrachtet ist ein wöchentlicher RSI > über 80 eine "Verkaufszone" für Swing-Trader. Das bedeutet nicht, dass der Trend vorbei ist, aber es kann hohe Volatilität und "Washout"-Ereignisse auslösen, bei denen späte Long-Positionen liquidiert werden.
Nächste Unterstützungszone: Ein Wochenschluss unter 86 USD wäre das erste Signal für eine mögliche Pullback-Umkehr. In diesem Fall sollte das frühere Widerstandsniveau bei 70 USD beobachtet werden, wobei ein tieferer Rücksetzer Unterstützung im Bereich von 56 USD bis 64 USD suchen könnte.
3. Silberminen Weekly: Die verborgene Chance
Hier liegt der "Profi-"Trade. Silberminenwerte (ETF: SIL/SILJ) haben gegenüber dem Kassapreis von Silber hinterhergehinkt.
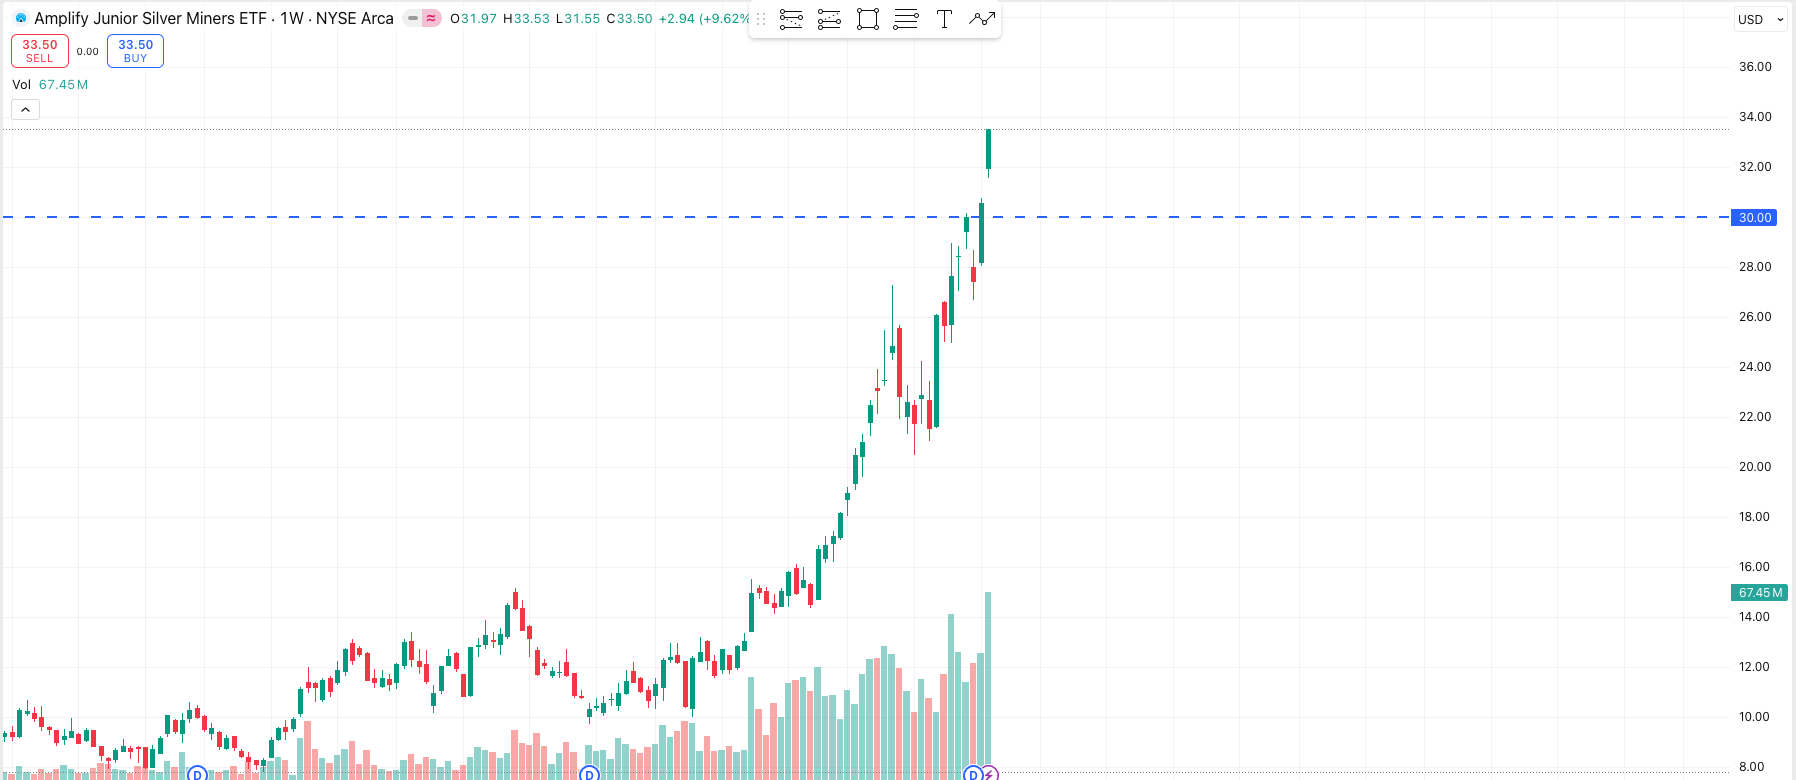
SILJ ist kürzlich aus einer zweiten Akkumulationsbasis ausgebrochen und in die Phase der Preisfindung eingetreten. Traditionell verlangsamt sich eine Kursentwicklung, die in die Preisfindungsphase übergeht, nicht, es sei denn, die Fundamentaldaten haben sich verändert oder institutionelle Investoren haben das Interesse an dem Asset verloren.
Risikohinweis: Minenaktien bergen operative Risiken. Ein Streik in einer Mine oder eine Steuererhöhung kann eine Aktie einbrechen lassen, selbst wenn die Silberpreise steigen. Nutzen Sie ETFs, um dieses Risiko zu diversifizieren.
Silber-Ausblick 2026 vs. das langfristige Spiel
Fazit: Die von Angst und Gier getriebene Silber-Rally wird sich 2026 fortsetzen, aber ein Rücksetzer ist unvermeidlich. Das aktuelle exponentielle Wachstum wird langfristig nicht nachhaltig sein, wobei sich die Preisbewegung am Median der Gold/Silber-Ratio stabilisieren wird.
Dennoch bleibt der sehr langfristige Ausblick bullisch, bedingt durch die künftige Nachfrage in bestimmten Sektoren wie Solar und der KI-Industrie.
Metals Focus: Der Nachfrageschock (Solar & KI)
Während sich die allgemeine Industrienachfrage abschwächt, erreicht die Hightech-Nachfrage (Solar/KI) Rekordhöhen. Das untermauert den Ausblick auf einen soliden und stabilen Preisboden in der langfristigen Zukunft.
Solar: “Die Nachfrage wurde auch durch Anwendungen im Zusammenhang mit künstlicher Intelligenz (KI) gestützt, die zum Wachstum der Auslieferungen von Unterhaltungselektronik beigetragen haben. Infolgedessen erreichte die Nachfrage aus Elektronik und Elektrotechnik 2024 erneut ein Rekordhoch. Auch die Automobil- und Luftfahrtindustrie stützten unter anderem das Nachfragewachstum bei Hartloten.” – aus dem World Silver Survey 2025 des Silver Institute’.
KI: “Weitere Unterstützung könnte auch entstehen, wenn KI-Entwicklungen den Absatz neuartiger elektronischer Geräte steigern und weiterhin energieintensive Rechenzentren gebaut werden.” Referenz: The World Silver Survey 2025.
Solar-PV: Der Umstieg auf N-Typ-Solarzellen (TOPCon) hat den Verbrauch von Silberpaste pro Watt erhöht. Trotz "Thrifting"-Bemühungen bedeutet das schiere Volumen an Gigawatt-Installationen, dass der Solarsektor inzwischen fast 20 % des gesamten jährlichen Angebots (~232 Moz) verbraucht.
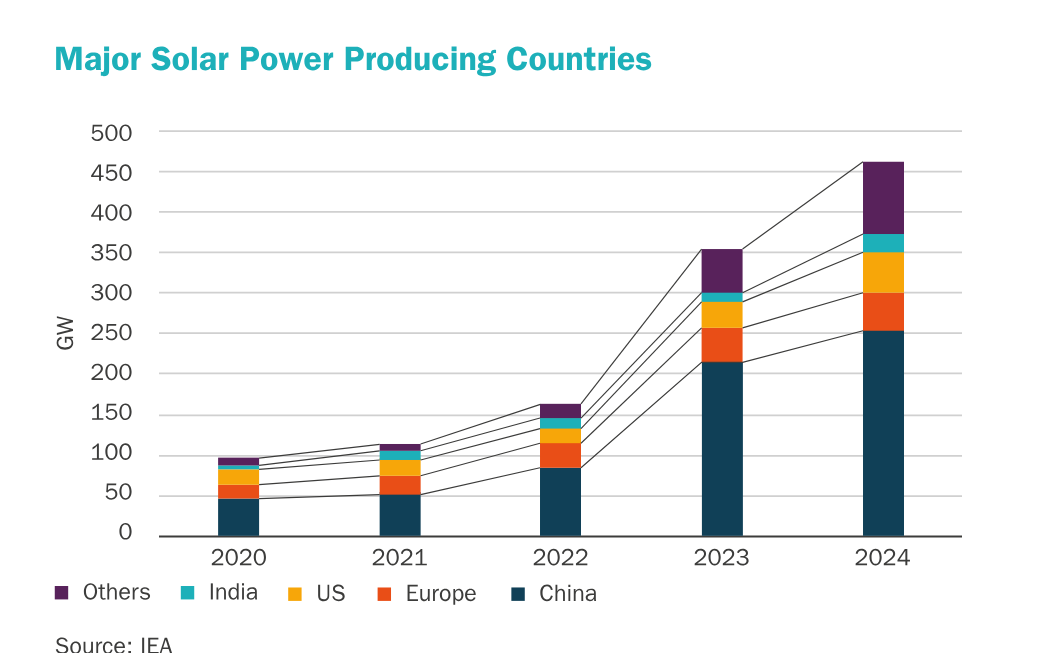
Abbildung: Silbernachfrage in der Solarphotovoltaik in den vergangenen 5 Jahren laut LBMA (London Bullion Market Association). Referenz: Facing Facts: Silver Demand in Solar Photovoltaics to Leapfrog in the Next Five Years
Der "KI"-Faktor: Ein neuer, unerwarteter Treiber ist Künstliche Intelligenz. KI-Rechenzentren und Hochleistungsrechner benötigen enorme Mengen Silber für hochleitfähige Steckverbinder und Leistungsschalter. Dieser Sektor war 2023 noch vernachlässigbar, ist nun aber ein bedeutender industrieller Wettbewerber.
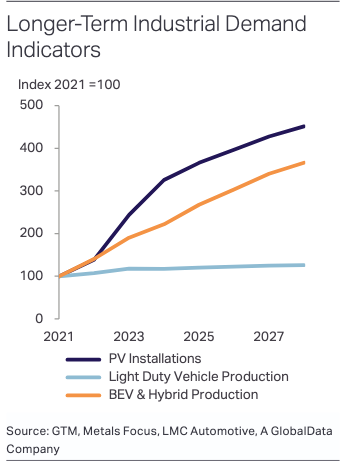
Langfristig sollte die Silbernachfrage jedoch aufgrund des Anstiegs der Industrienachfrage (Solar) und der Künstlichen Intelligenz, bei der photovoltaische Infrastruktur mit Silberbedarf exponentiell wachsen wird, stetig und deutlich zunehmen.
Expertenzitat:”Gleichzeitig bleiben wir für die Industrienachfrage optimistisch. Kurzfristiger Druck könnte entstehen, wenn die Weltwirtschaft unter dem eskalierenden Handelskrieg leidet. Strukturelle Veränderungen (oft im Zusammenhang mit der Dekarbonisierung, etwa der Umstellung auf BEVs und PV-Installationen) sollten jedoch bedeuten, dass die industrielle Silbernachfrage’ das globale BIP-Wachstum übertrifft.” – Referenz: The World Silver Survey 2025


