


What is the Gold-Silver Ratio (GSR)?
The Formula
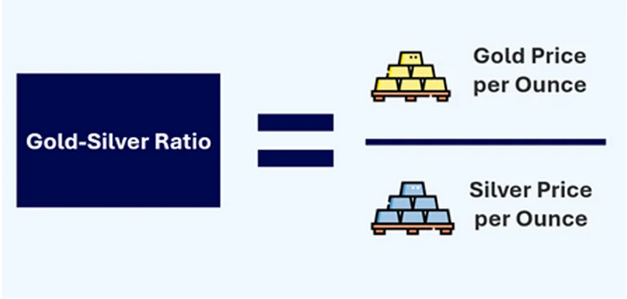
Put simply, the Gold to Silver ratio tells you the purchasing power of gold in terms of silver.
The Formula:
Gold Silver Ratio = Price of Gold (XAU) / Price of Silver (XAG)Calculation Example: If Gold is trading at $2,752 and Silver at $34:
2752÷34=80.9
This means it takes nearly 81 ounces of silver to buy one ounce of gold.
Why Should You Care About the Gold to Silver Ratio (GSR)?
Precious Metals Traders should care because this ratio is often a leading indicator for the broader economy. It acts as a "Market Barometer" that tells you things a standard price chart cannot.
By monitoring the Gold Silver Ratio (GSR), you get a clear signal on market sentiment:
1. The Fear Signal:
Gold is the ultimate safe haven. When investors are terrified of war, inflation, or a market crash, they dump cash and buy Gold.
According to the World Gold Council: “Gold’s traditional role as a safe-haven asset means it comes into its own during times of high risk. But its dual appeal as an investment and a consumer good means it can generate positive returns in good times too. This dynamic is likely to continue, reflecting ongoing political and economic uncertainty, and economic concerns surrounding equity and bond markets.” – WGC (Gold as a strategic asset: 2025 edition)
Why you should care: If you see the GSR Spiking, it is a warning sign. It often predicts a stock market sell-off or a recession before the news headlines do.
2. The Silver Signal:
Silver’s main price driver is industrial use and Hedging, from iPhones, AI to Solar Panels.
Why you should care: If you see the Ratio Dropping, it signals that either Gold had been too hot and capital has now rotated into Silver. For example, in Jan 2026, Silver price broke record highs into near 100 USD, so precious metal traders who wonder if Silver is still a good investment can use fundamental analysis and technical analysis (like Gold/Silver Ratio) to make judgements.
3. It Works in Any Market:
The price of Gold might fall, and the price of Silver might fall—but the Ratio can still trend cleanly.
Why you should care: This allows you to trade relative strength. You can make money on the difference in spread between the two metals, even if the whole precious metals sector is in a slump.
How was the Gold/Silver Ratio helpful Historically?
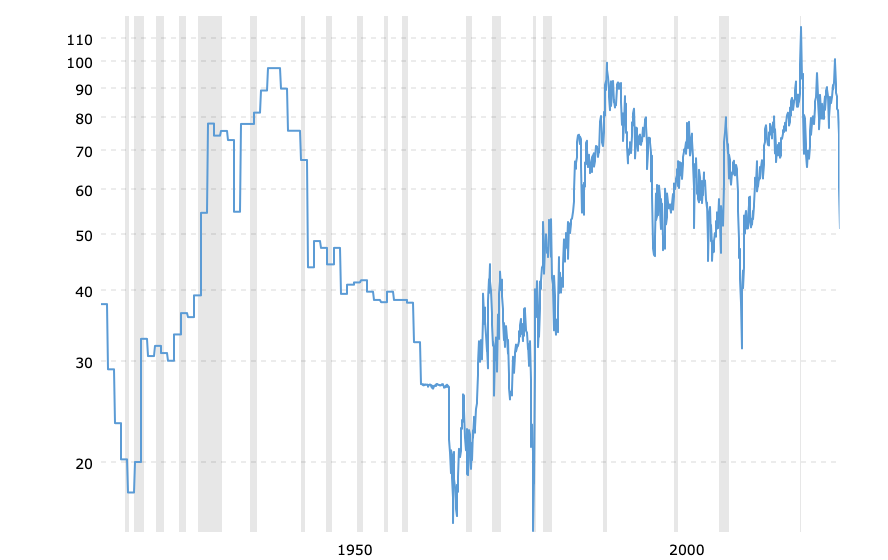
Figure: Gold to Silver Ratio - 100 Year Historical Chart
Source: MacroTrends.net
To trade the ratio effectively, you must identify when it is "out of whack." Historically, the ratio acts like a rubber band—it stretches to extremes and eventually snaps back to the mean.
The "Roman Standard" (12:1): The ancient baseline for monetary value.
The 1980 Inflation Crisis (15:1): During the Hunt Brothers' squeeze and massive inflation, silver skyrocketed, crashing the ratio.
The 1991 Recession (100:1): As the economy slowed, industrial demand for silver vanished, pushing the ratio to extreme highs.
The 2011 Silver Bull Run (30:1): Post-2008 quantitative easing saw silver rally to near $50, compressing the ratio.
The 2020 "Pandemic Spike" (126:1): The highest level in modern history. Fear drove Gold up, while factory shutdowns crushed Silver.
The Current Reality (50-85): In the current geopolitical era, Central Bank buying has kept Gold elevated, creating a new "normal" range higher than the 20th-century average.
The Core Strategy: Mean Reversion
The most popular way to trade the Gold-Silver Ratio is based on the principle of Mean Reversion.
Due to the natural properties of Gold/Silver Ratio like Correlation of Value, Industrial vs. Hedging Demand, Capital Rotation, Market Psychology and so on, that makes the correlation between the metals so strong that the Gold/Silver Ratio remains highly relevant as an indicator even till today.
How to Trade Mean Reversion Strategy using Gold/Silver Ratio
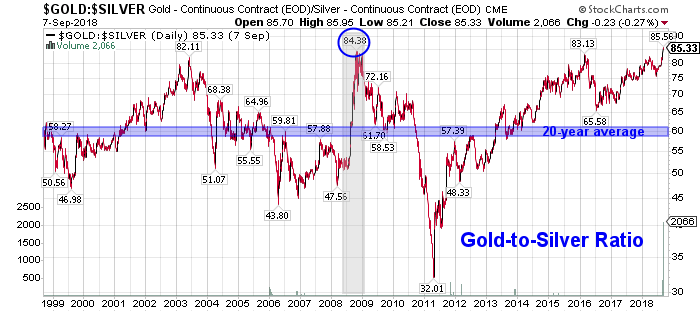
Source: Investing.com
Over the last 20 years, the ratio has averaged approximately ‘60-70’:1. This is your baseline.
Above 80: The rubber band is stretched towards Gold. Gold is expensive, and Silver is cheap.
Below 50: The rubber band is stretched towards Silver. Silver is expensive, and Gold is cheap.
Setup 1: The "Silver Catch-Up" (Ratio > 80)
When the ratio climbs above 80, it signals investors' interest in Gold is high while neglecting Silver. This imbalance will eventually fail due to a few reasons.
Why High Ratio can’t last?: Eventually, Gold investors who are risk sensitive, will deem the rallying gold price as too high, hence it has a risk of overvaluation, therefore they will have to balance their portfolio to the sister metal, Silver. Otherwise, in a longer scope, fear will subside, or investors simply realize that Silver is undervalued relative to Gold. Capital rotates out of the "overbought" Gold and into the "oversold" Silver.
The Silver Trade: A trader should start to Long Silver (buy XAGUSD).
More Aggressive Option: Simultaneously Short Gold (sell XAUUSD) and Long Silver (XAGUSD) to profit twice from the gap closing.
Setup 2: The "Gold Rush" (Ratio < 50)
When the ratio drops below 50, it usually means Silver has rallied too hard in relation to Gold, or Gold has been slowing down too much. This phenomenon typically does not last long. In other words, due to a number of complex reasons (Portfolio Rebalancing, Undervalued Gold being attractive again, Overvalued Silver, etc), Gold will eventually regain valuation and hence, low Gold to Silver Ratio has never been sustainable.
What happens?: At this level, smart money often shifts capital from other assets (bonds, stocks, options) into Gold or rotate (take profit) from Silver and park it back into the safety of Gold.
The Gold Trade: A trader would look to Long Gold (buy XAUUSD).
More Aggressive Option: Simultaneously Short Silver (sell XAGUSD) and Long Gold (XAUUSD) to capture the correction.
⚠️ Risk Warning: The "Value Trap" Just because the GSR is high (e.g., 85), it doesn't mean that it must crash tomorrow. In 2020, the Gold to Silver Ratio sat above 80 for many months before exploding to 126. q
Pro Tip: Don't simply buy because the number is high. There must be fundamental research and data or fundamental analysis that can strongly support that decision. You should also wait for a Technical Reversal on the chart (like a Lower High) to confirm the rubber band is actually snapping back towards the average price range (60-70) (Mean Reversion).
Ways to Trade Gold/Silver Ratio (Comparison of Instruments)
There are several ways to execute these strategies, each with pros and cons:
Physical Metal: Good for long-term holding, but expensive premiums, storage fees and impossible to Short sell.
ETFs: Good for trend following, but seldom provide stronger returns than spot Gold or Silver.
Futures: High leverage available, harder to learn for beginners.
CFDs (Recommended): The preferred tool for beginners and active Gold/Silver Ratio traders. CFDs allow you to trade both ways (buy/short, or both together), use Leverage, and execute instantly without owning the physical metal, all with the click of a button.
Advanced Tactics: Trading the Trend Matrix
Many novice traders make a fatal mistake: they see a high Gold-Silver Ratio (GSR) and immediately buy Silver. This is dangerous because the ratio can stay high for months or even years.
To trade the GSR successfully, you cannot look at the ratio in isolation. You must overlay the Market Trend. Are precious metals in a Bull Market (Uptrend) or a Bear Market (Downtrend)?
The GSR doesn’t just tell you which metal is cheap; it tells you which metal is moving faster.
The Trader’s Decision Matrix
Use this matrix to determine your strategy based on the broader market environment.
The Two Most Profitable Setups
1. Trade the Silver Rally (Silver Bull Market + Falling Gold/Silver Ratio)
This often occurs after Gold has established a solid rally in the precious metals industry, then hedging capitals rotate into Silver for lower pullback risks and higher returns.
The Signal: Gold is experiencing a strong bull market, but the GSR is starting to curl downwards, favouring Silver than Gold, this hints that the first wave of Hedging Capital has started to rotate.
The Trade: Switch exposure from XAUUSD to XAGUSD related trades, including spot metals, mining stocks, ETFs and other derivatives. Silver can often move 2x or 3x faster than Gold in this phase.
2. Safe Haven Play (Systemic Bear Market + Rising Gold/Silver Ratio)
When the risk in the entire equity market rises, Gold will be one of the most sought after safe-haven assets. This happens during economic slowdowns, inflationary periods, increased geopolitical instability, weakening dollar and so on. Investors will need somewhere to park their cash, to preserve wealth during crisis, and hence giving gold the famous title ‘Safe Haven Asset’.
The Signal: Economic data (PMI, CPI) negatively impacts market expectations, risk-off market sentiment period.
The Trade: If you must hold anything safe, you can hold Gold. A more aggressive strategy is to Open a Short on Silver (CFD sell position) while holding a Long on Gold. You will profit from the spread widening, even if both metal prices drop.
How to Trade the Ratio on TMGM
Trading the Gold-Silver Ratio isn't as simple as clicking a "Buy Ratio" button. Since the ratio is a calculation, not an asset, you trade it by taking positions in the two underlying metals: Gold (XAUUSD) and Silver (XAGUSD).
This is where trading CFDs with TMGM offers a distinct advantage over physical metal or ETFs. With CFDs, you can easily ‘Play Both Sides’, earning profits when both Gold and Silver rise and fall. Trading Gold and Silver using CFDs, like the ones TMGM provides, allow you to buy or sell a position instantly with the click of a button.
You can explore Short Selling a position (profit from falling prices) and using Leverage to manage your capital efficiency.
Step 1: The Setup
To trade the ratio, you need to use the logic and analysis taught above, to decide buying or selling either Gold or Silver.
To Trade a Rising Ratio: Buy Gold / Sell Silver.
To Trade a Falling Ratio: Sell Gold / Buy Silver.
With the above logic, you can easily play both sides, to make double the profits. For example, in a market where Gold/Silver Ratio is in a Rising Trend, you can buy gold and also sell silver, so you will make double the profits, and vice versa.
Step 2: Execution Guide (MT4/MT5)
Locate the Assets:
Open your TMGM MT4 or MT5 terminal.
Press Ctrl+U to open Symbols.
Navigate to Precious Metals.
Ensure XAUUSD (Gold) and XAGUSD (Silver) are visible in your Market Watch.
Check Your Spreads:
The Spreads and prices you see on MT4/MT5 after connecting your TMGM account, are prices provided by TMGM.
TMGM’s Aggregation Engine connects to Tier 1 Liquidity Providers, often resulting in spreads as low as 0.0 pips on Gold during liquid sessions (London/NY overlap).
Pro Tip: Always check the spread on Silver (XAGUSD) before entering. Silver is less liquid than Gold and spreads can widen during news events.
Mind the Leverage Gap (Crucial):
This is where most beginners fail. Gold and Silver often have different margin requirements.
The Risk: If you open equal lot sizes, your Silver position will consume significantly more margin than your Gold position, so the smart way is to have different lot sizes that will amount to equal effects when you do that.
Tip: Always use the TMGM Trading Calculator to balance your margin exposure before opening both legs of the trade.
Why Trade Metals with TMGM?
No Requotes: When you are trading the "The Silver Rally" strategy (high volatility), you need instant entry. TMGM’s NY4 server location can help avoid slippage during breakout rallies.
Deep Liquidity: Whether you are scalping the ratio or holding a long-term mean reversion trade, our large liquidity pool helps to fill your large orders without much worries that a rapidly moving market price is against you.
Long & Short Flexibility: Unlike physical bullion dealers, you can short Gold or Silver instantly with a single click, allowing you to profit even when the metals market is crashing.


