
Key Takeaways
A hammer candlestick is defined by a small real body near the top of the candle and a long lower wick that reflects rejection of lower prices.
The main types of hammer candlestick are the classic hammer, the inverted hammer candlestick, and the hanging man candlestick, with the trend context deciding whether the pattern is bullish or bearish.
Market Psychology: Indicates a massive absorption of sell orders and a shift in intraday momentum from bearish to bullish.
Context Dependence: The structural shape only holds weight when printed at structural support, demand zones, or key Fibonacci retracement levels.
Confirmation is Mandatory: A hammer must always be validated by a subsequent high-volume bullish candle before execution.
Strategic Execution: Stop-losses are mechanically placed below the extreme of the wick, enforcing a strict minimum 2:1 Risk-to-Reward Ratio (RRR).
What is Hammer Candlestick Pattern
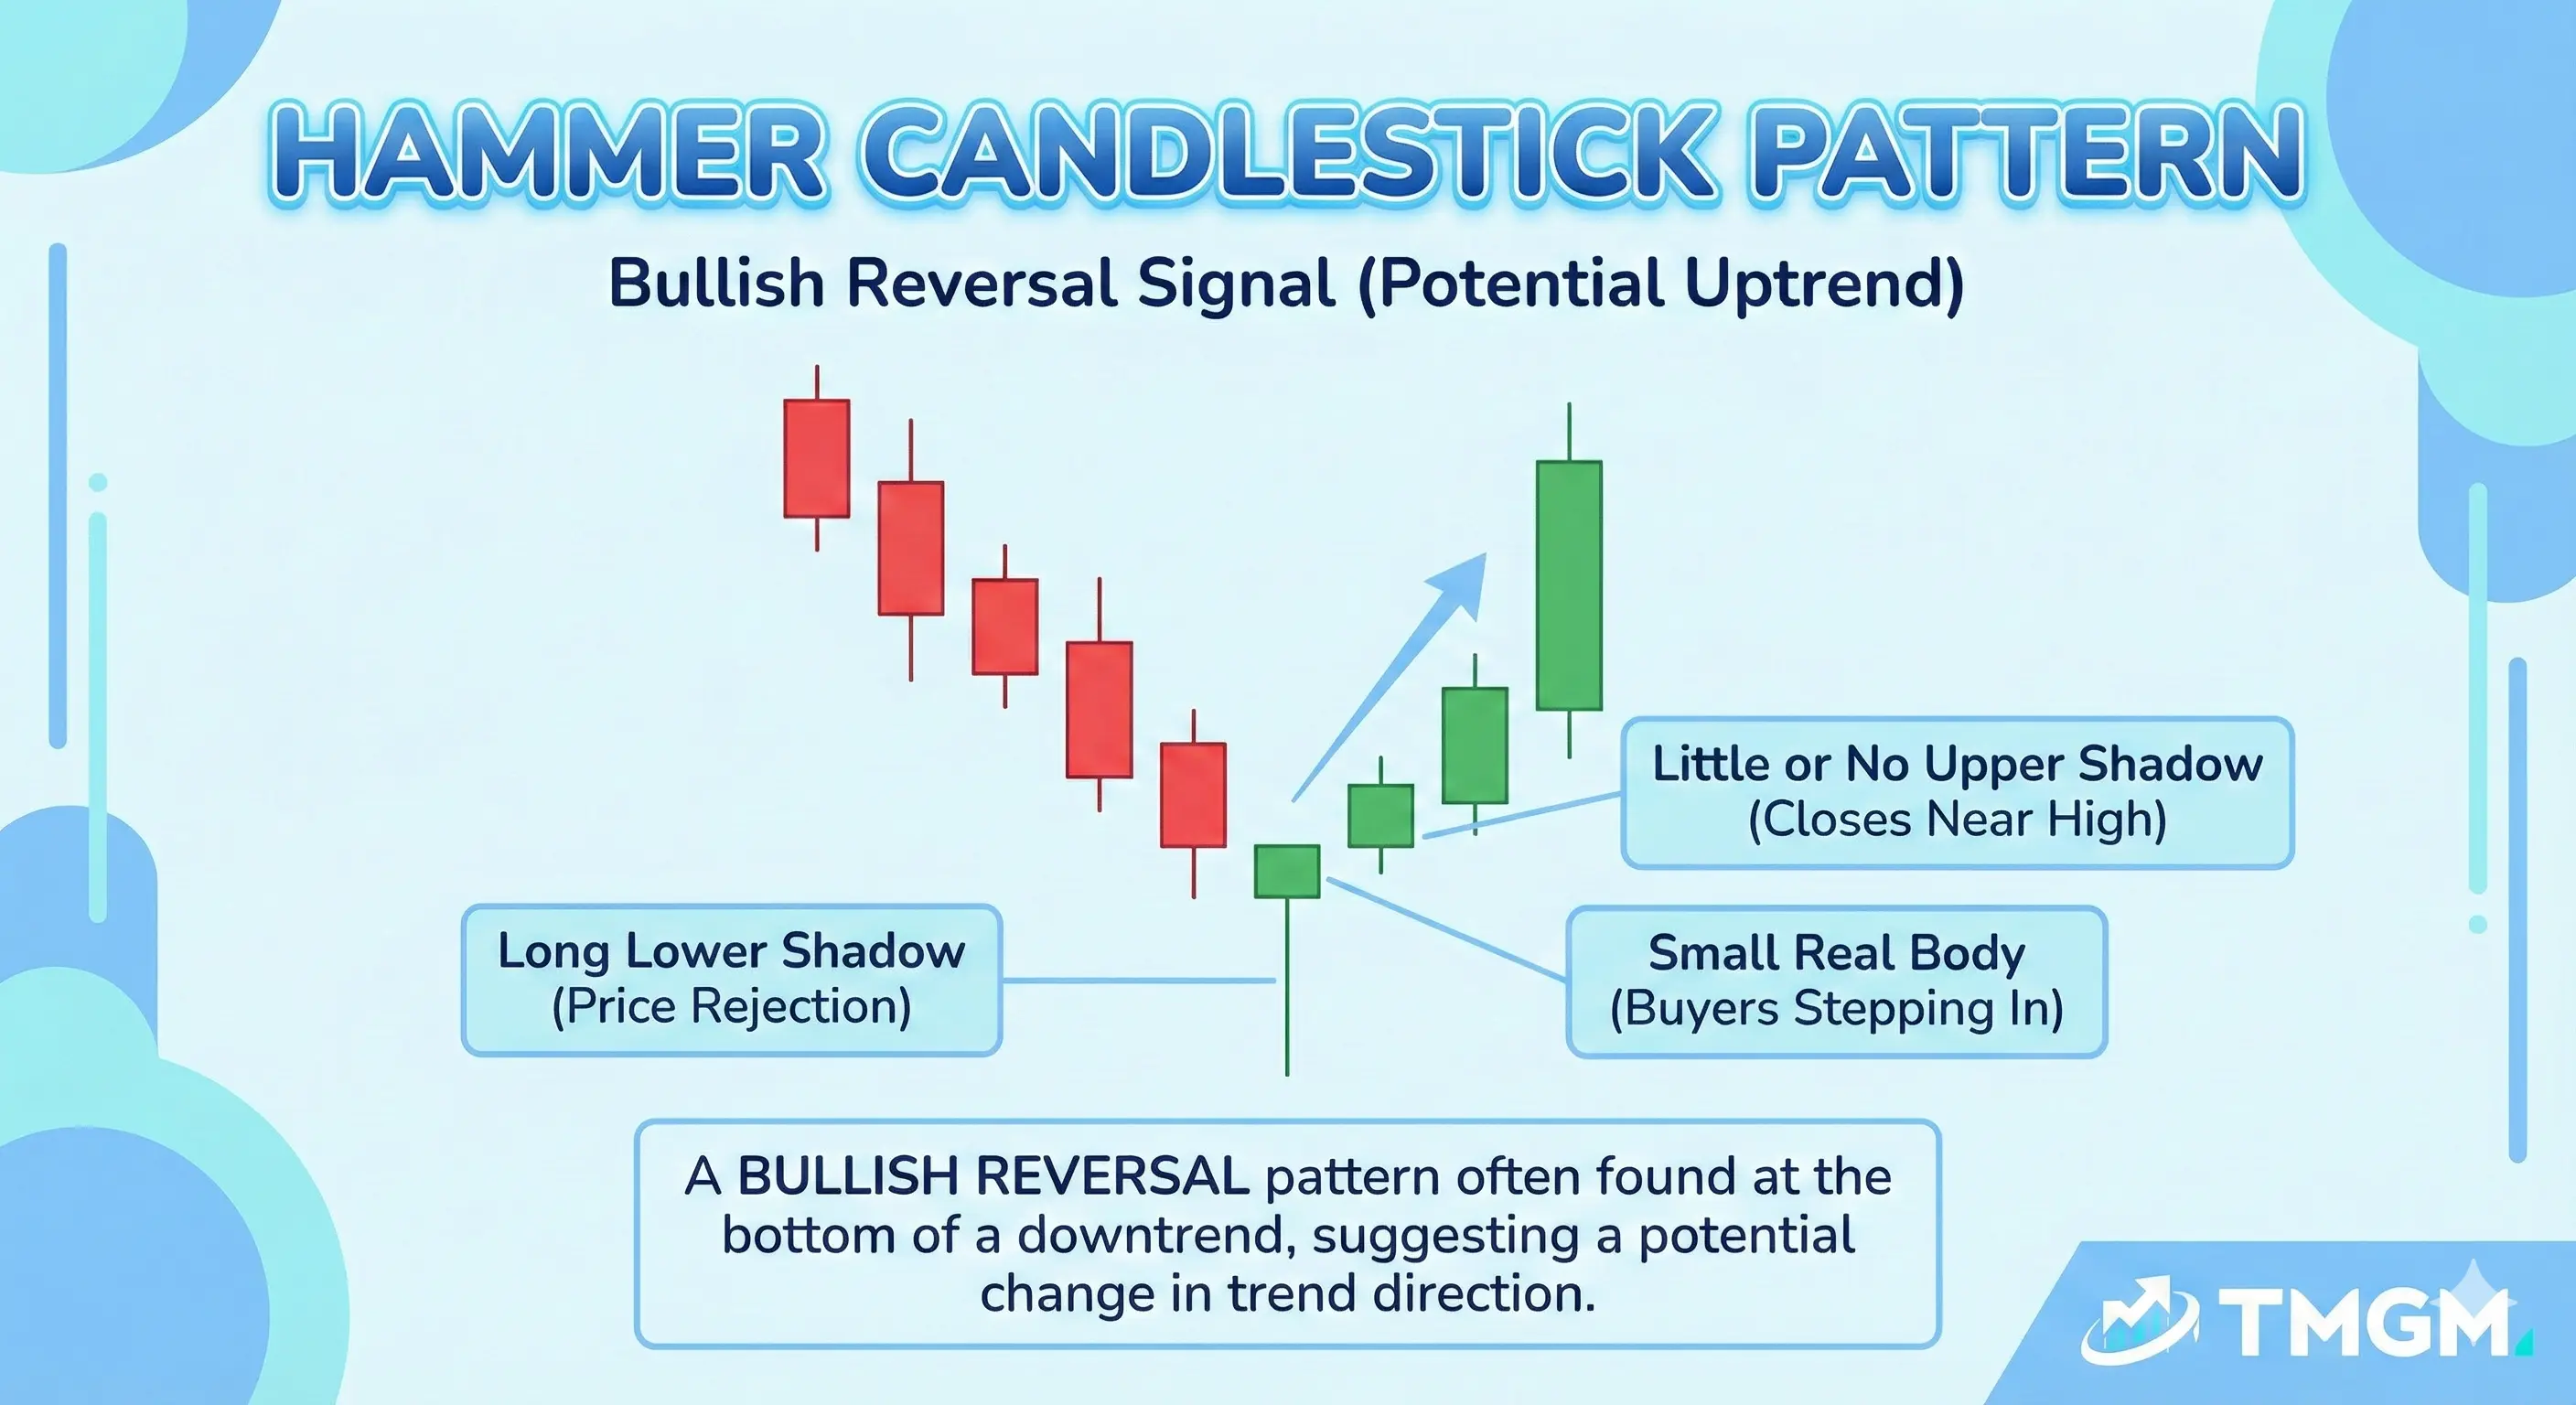
A hammer candlestick pattern is a reversal formation that usually appears after a sustained decline. It has:
A small body near the top of the candle
A long lower wick
Little to no upper shadow
It forms after a sustained decline, showing that selling pressure was absorbed before the close.
The long lower wick shows that price moved sharply down during the session. The close back near the top signals that buyers absorbed that pressure and reduced the dominance of sellers before the candle completed.
The body color is secondary to the shape. A green close often looks stronger because buyers finished the candle in control, but a red close can still qualify as a valid hammer if the structure and context are correct.
Because the hammer is a price action pattern, it can be used across forex, gold, crypto, oil, and shares, as long as the market is liquid enough for the candle structure and confirmation to be meaningful.
Hammer Candlestick Mechanism & Market Psychology
The mechanism behind the hammer is straightforward. Price opens, sells off sharply, and then attracts enough buying interest to recover most of the drop before the candle closes.
Psychologically, this shift matters because it shows rejection of lower prices, in trading language, the candle reflects a failed push lower. Sellers controlled the prolonged decline (downtrend), and that rejection can signal that buyers regained control and forced price back up (reversal), which is why the hammer is commonly viewed as a potential bullish reversal signal.
What makes the pattern useful is not the wick alone, but what the wick represents. It shows an attempted continuation lower that failed, and failed downside continuation is often the first clue that the prevailing move is losing control.
Important: A hammer shows rejection, not confirmation. Reversal only becomes tradeable when the next candle proves that buyers can follow through.
Types of Hammer Candlestick Patterns
Classic Hammer Candlestick Pattern
The classic hammer is the standard bullish hammer candlestick and is widely treated as a bullish reversal candlestick. It appears after a downtrend and has the traditional shape of a small body near the top with a long lower wick.
Its message is that sellers managed to push price lower, but could not hold the move. When it forms near support or after an extended selloff, it can become an early sign that a reversal phase is starting.
Inverted Hammer Candlestick Pattern or Reverse Hammer Candlestick
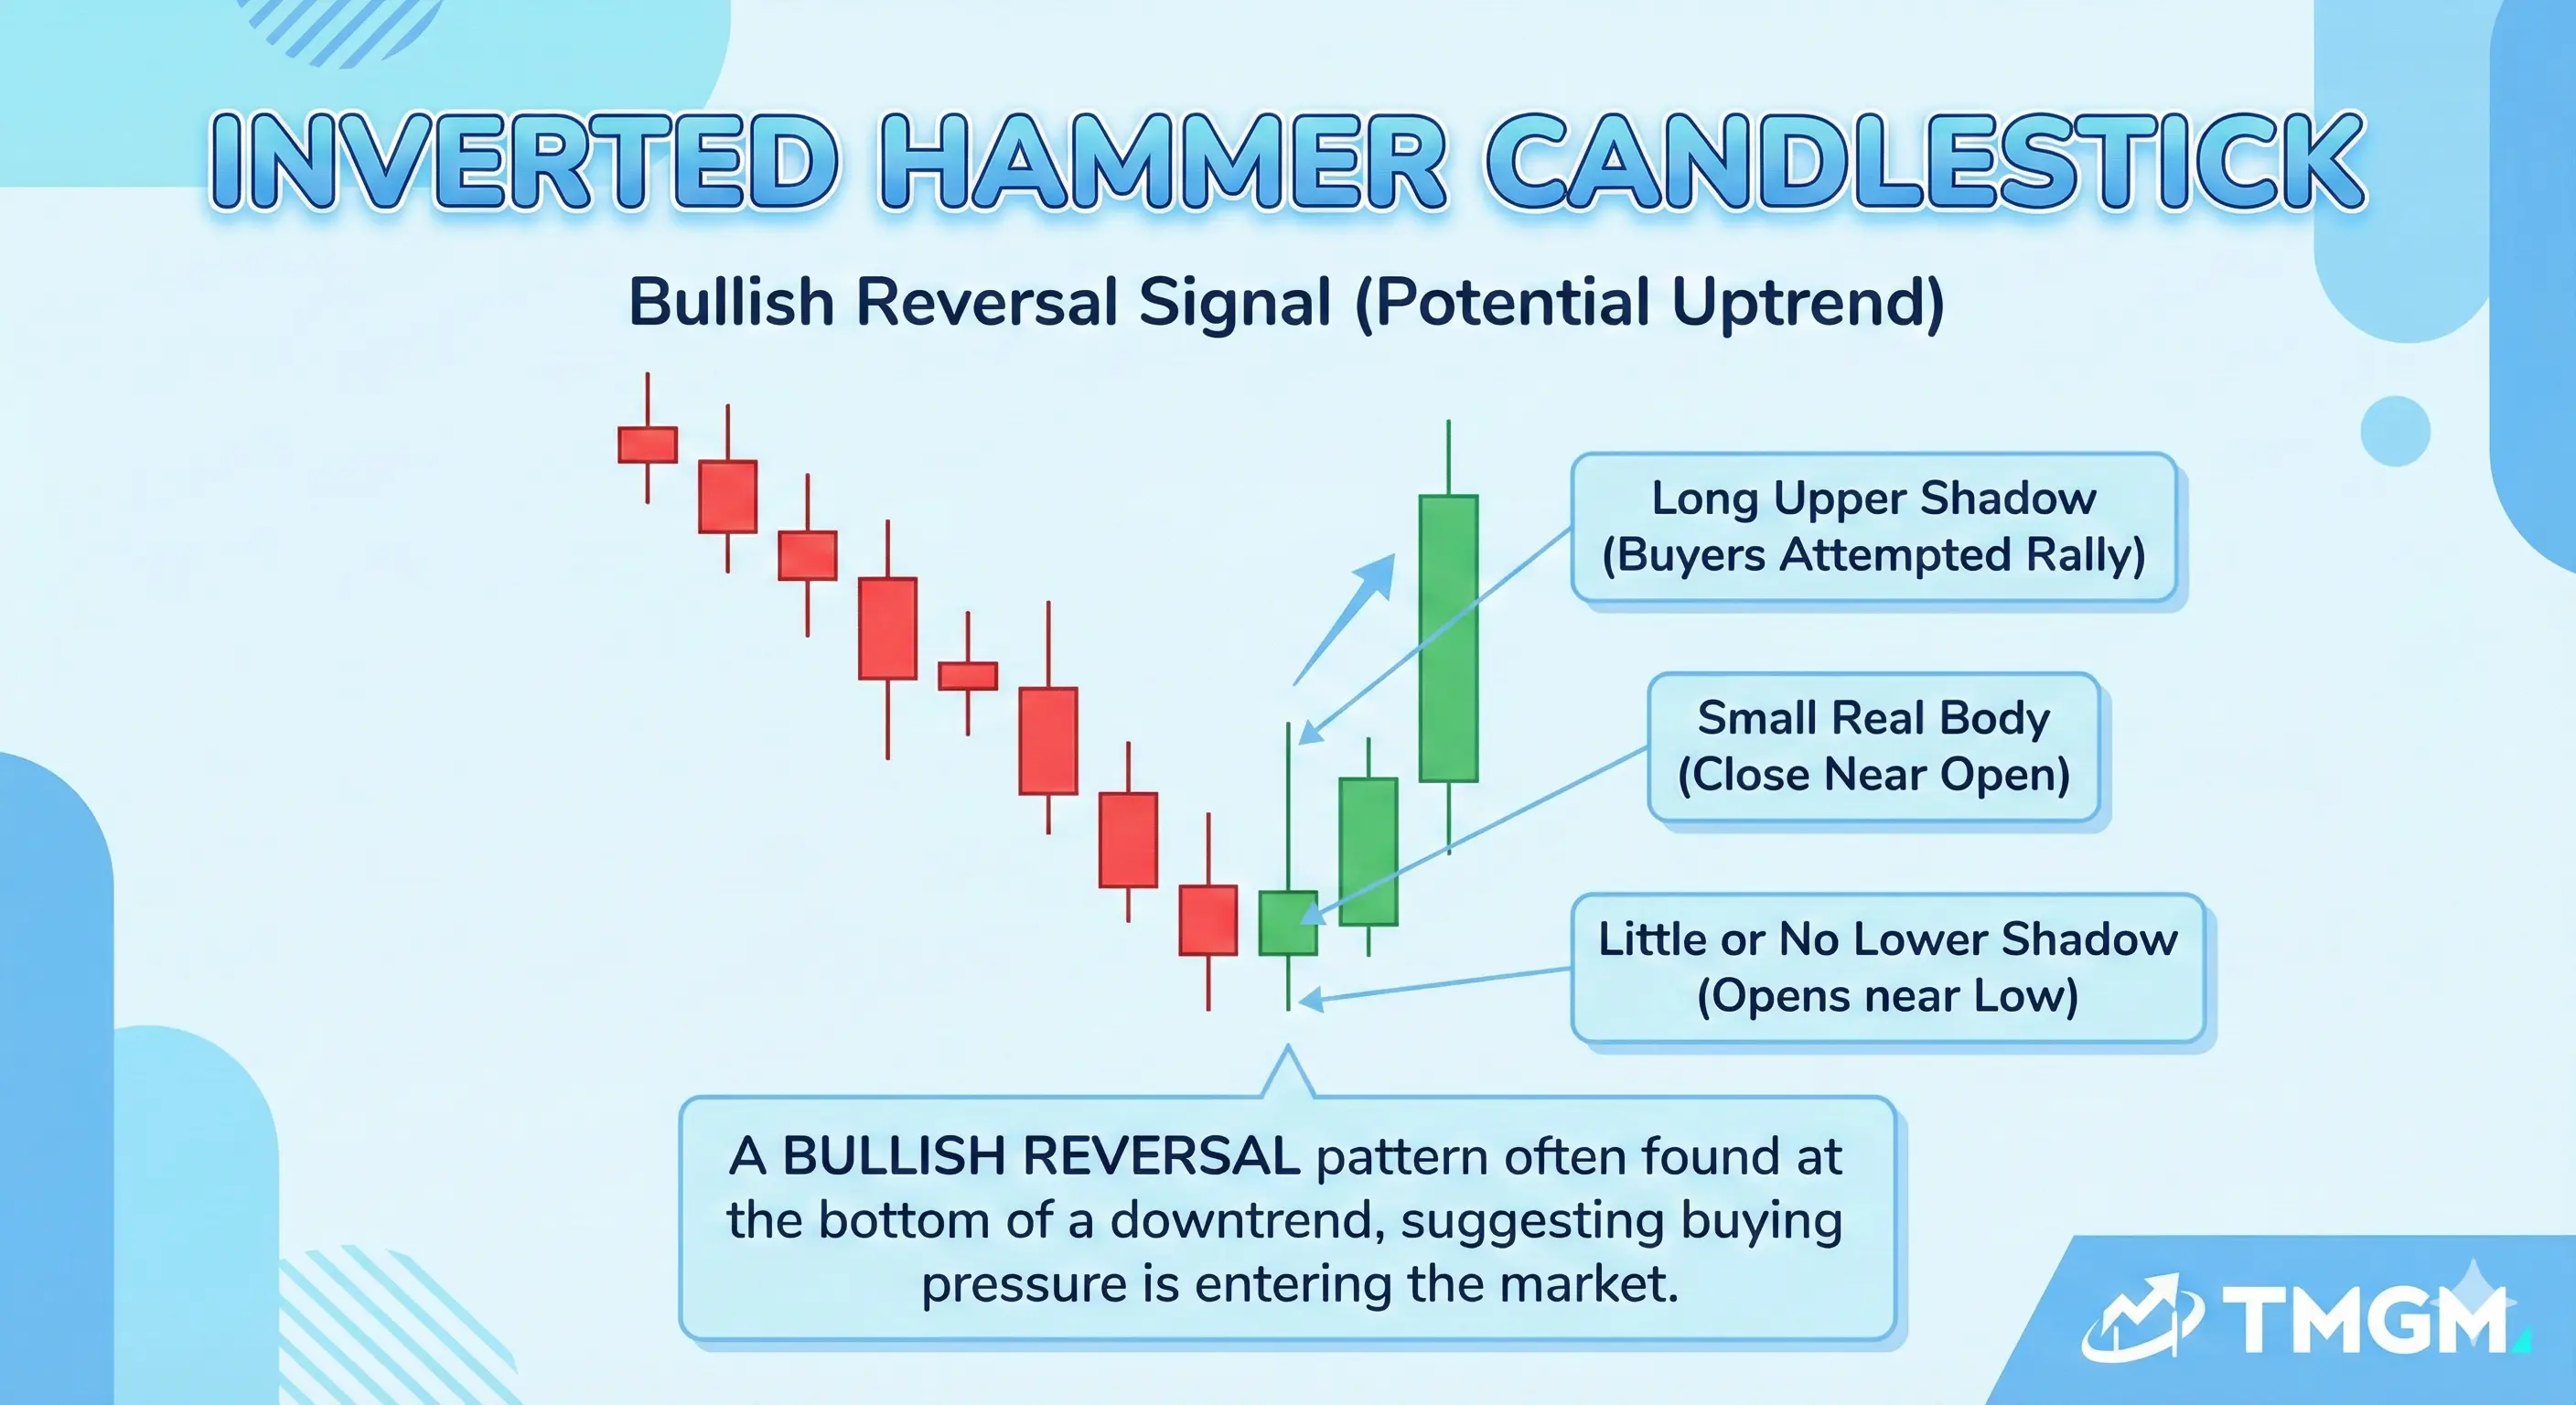
The inverted hammer candlestick pattern, also often called the reverse hammer candlestick, is also a bullish reversal candlestick when it appears after a downtrend. Instead of a long lower wick, it has a long upper wick and a small body near the bottom of the candle.
This structure shows that buyers were able to push price higher during the session, even though the close faded back from the highs. Note that, although the candle does not confirm a reversal yet, it warns that demand is starting to push back against the prior bearish trend.
Hanging Man Candlestick Pattern
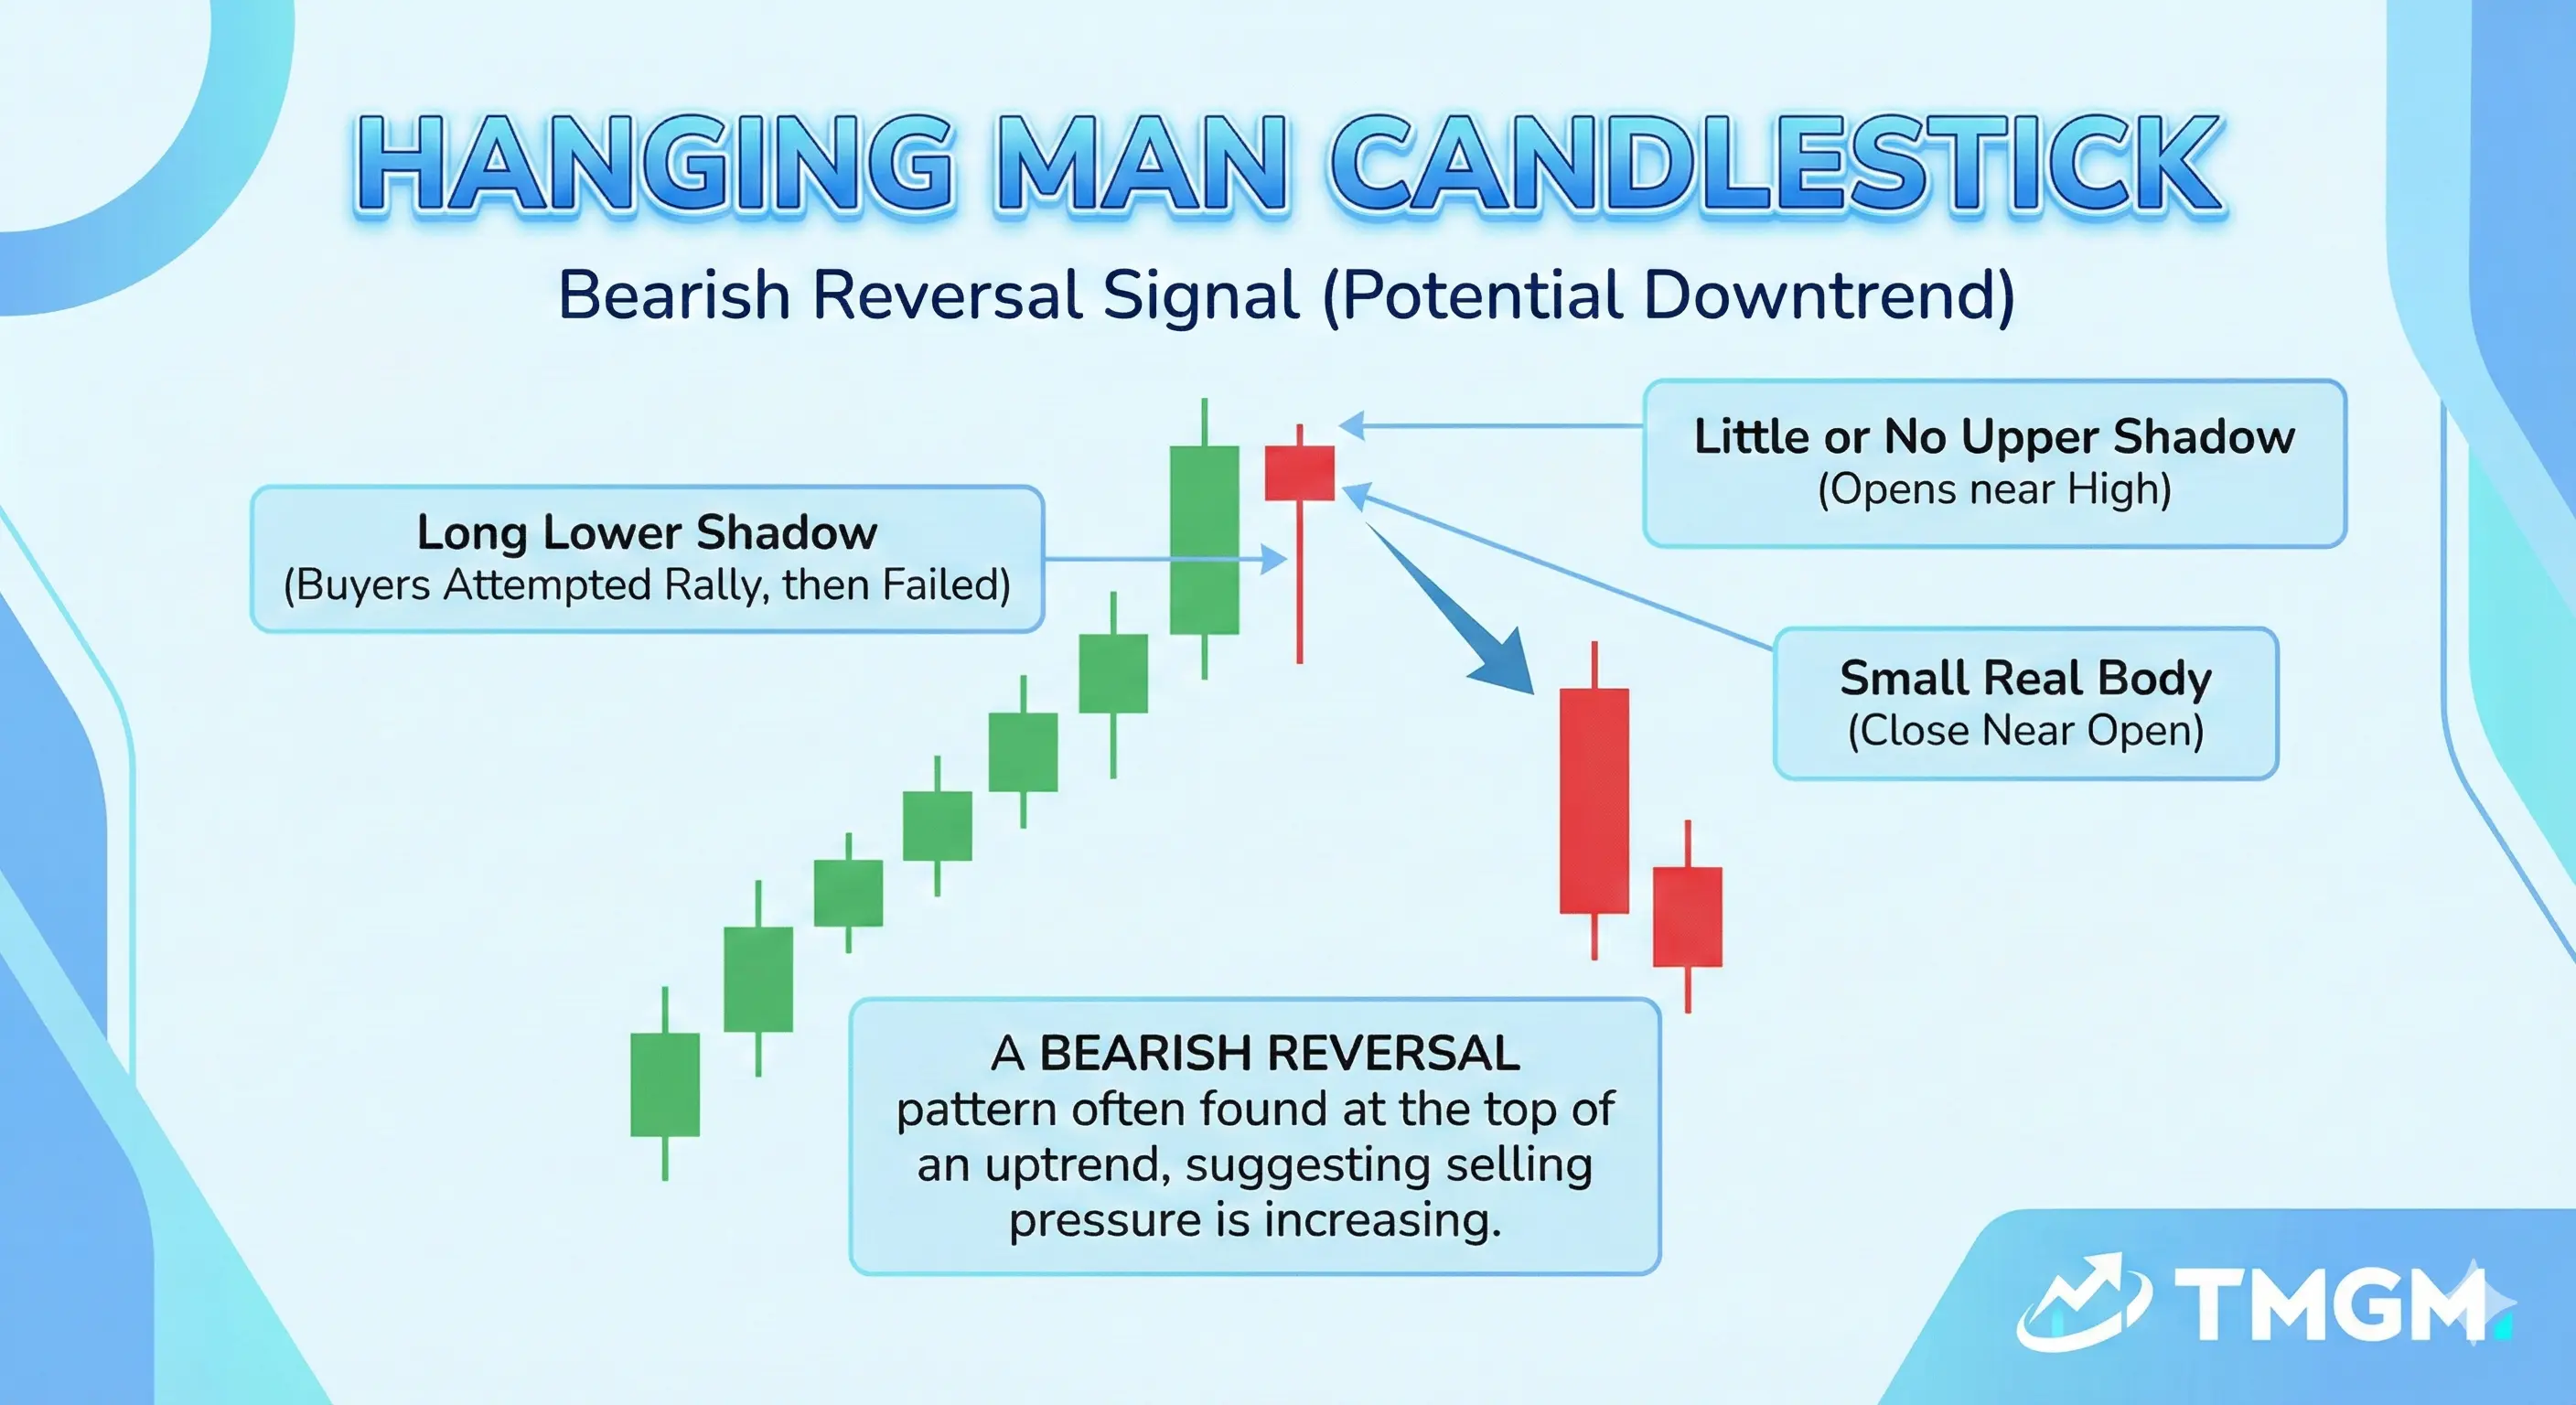
The hanging man candlestick uses the same basic shape as the classic hammer, but it appears after an uptrend, not after a decline. Because of that context, it is treated as a bearish hammer candlestick and a bearish reversal candlestick rather than a bullish one.
Its warning sign comes from the long lower wick during an existing uptrend. Even if buyers recover into the close, the fact that sellers were able to force a notable intra-period drop can signal that upside control is becoming less stable.
Other ways to analyze Hammer Candlestick
A red hammer candlestick and green hammer candlestick should not be interpreted in isolation. The color does not inherently decide whether the setup is bullish or bearish because the hammer is first a shape pattern and then a context pattern.
A green hammer often provides a slightly stronger visual signal because it closes above the open. A red hammer can still be valid if it forms after a decline, rejects support, and is confirmed by the next bullish candle with strong participation.
The same logic applies to the inverted hammer candlestick and the hanging man. Pattern classification comes from shape plus trend location, not from candle color alone.
Hammer Candlestick Pattern Trading Strategy
A hammer is best traded as a trend reversal setup, but the direction depends on the type. The classic hammer and the inverted hammer are usually assessed as bullish reversal patterns after a downtrend, while the hanging man is assessed as a bearish reversal warning after an uptrend.
A hammer alone is not enough to take a trade. It becomes much more effective when confirmed by a subsequent bullish candle, by high volume, or by appearing at a key support level for bullish setups, and the same confirmation logic applies in reverse for bearish setups.
Volume analysis on the subsequent bullish candle is a must for bullish hammer trades. The reason is simple: the hammer shows rejection, but the next candle shows whether buyers actually committed enough size to continue the move.
A practical entry method is to wait for the next candle to break above the hammer high in bullish setups, or below the hanging man low in bearish setups. That approach reduces premature entries and forces price to confirm direction before capital is committed.
In summary:
Confirmed by a subsequent bullish candle
High Volume
Appearing at a key support level
How to Trade Hammer Candlestick Pattern with Live Price Chart Example
XAUUSD
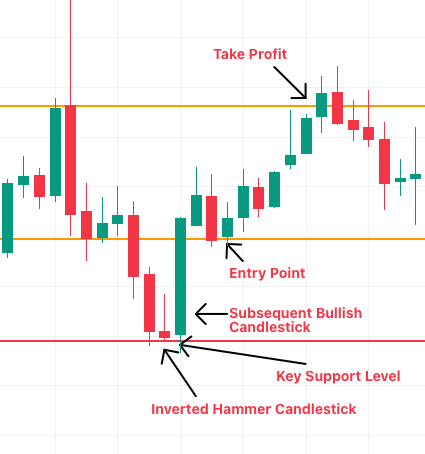
On Tuesday, 12th December 2023, XAUUSD Daily Chart printed an inverted hammer candlestick and subsequently rallied for more than 5% in a few days.
In this example where we used real life case study with professional analysis & research, we will demonstrate how to trade an inverted hammer candlestick pattern with identification, entry and take profit setup.
Identification:
Inverted Hammer Candlestick Pattern
Subsequent Bullish Candlestick
Appearing after a downtrend
Appearing at Key Support Level
Entry/Take Profit/Stop-Loss:
After the Bullish Candlestick is printed, wait for a retest, then enter the market with proper position sizing, stop loss and take profit levels based on previous resistance and Risk-Reward Ratio.
Additional Detail: Gold often reacts strongly to macro catalysts, so a hammer near technical support becomes more credible when the next bullish candle expands together with strong volume and supportive market context such as a weaker dollar or lower yields.
In execution terms, traders often wait for the next candle to break the hammer high before entering. The stop loss is usually placed below the hammer low, while the target is projected using nearby resistance or a minimum 2:1 reward relative to the stop distance.
EURUSD
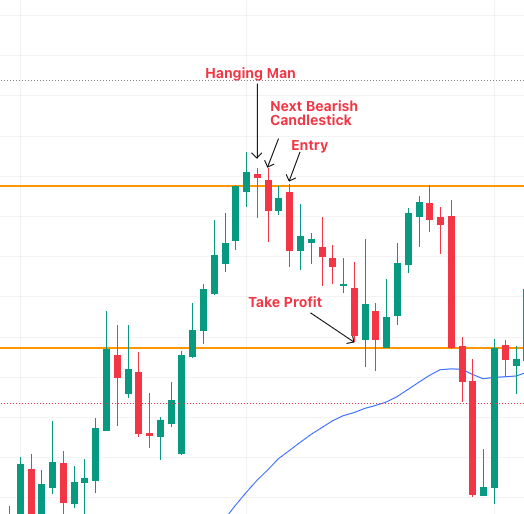
On Wednesday, 2nd July 2025, EURUSD printed a Hanging Man Hammer Candlestick after a prolonged uptrend, retested previous resistance and then proceeded to sell for 1.7% until it hit a key support level.
In this example where we used real life case study with professional analysis & research, we will demonstrate how to trade a hanging man hammer candlestick pattern with identification, entry and take profit setup.
Identification:
Hanging Man Hammer Candlestick Pattern
Subsequent Bearish Candlestick
Appearing after an uptrend
Entry/Take Profit/Stop-Loss:
After the Bearish Candlestick is printed, wait for a retest, then enter the market with proper position sizing, stop loss and take profit levels based on previous resistance and Risk-Reward Ratio.
Additional Details: Seeing a hanging man after an extended rally into resistance can warn that the move is weakening. In any case, volume, session timing, and confirmation from the next candle are more important than the candle shape alone.
Important: The best hammer trades usually come from confluence, not from candle recognition alone. A clean rejection wick at support means more when it aligns with structure, volume, and broader market bias.
Expert Guidance: Hammer Candlestick is a Chance, not a Guarantee.
A reversal candle is a chance, not a conclusion. The professional view is that the hammer opens a scenario, but confirmation rules decide whether that scenario is worth trading.
Confirmation rules should come from price first. That usually means a subsequent bullish close for a classic or inverted hammer, or a subsequent bearish close for a hanging man, ideally with expanding participation.
Confluence improves quality. A hammer at support with strong next candle volume, RSI stabilization, moving average support, or a Fibonacci retracement level is stronger than the same hammer floating in the middle of a random range.
Fundamentals should also support the trade bias. On XAUUSD, macro drivers such as yields, inflation expectations, and risk sentiment matter. On EURUSD, central bank expectations, inflation data, and dollar strength can either reinforce or weaken the reversal idea shown by the candle.
Risk Management: Trade Hammer Candlestick with Safety Belt
Stop loss placement should be based on
Risk-Reward Ratio
2:1 risk reward ratio is a classical benchmark because it keeps the trade structure efficient.
Position Sizing
Risking less than 2% of account equity per trade is a more classical and lower risk approach.
Setting Stop Loss
Stop Loss must be set, and you can use the previous low as a support level, or you can use support resistance indicators to determine it too. You can also consider using trailing stop after taking profit (at least 50%) if you can foresee your trade running more profits than expected.
Setting Take Profit
You should calculate your take profit level based on a supposed resistance/support level (depending on your trade being a long or short position), together with the 2:1 Risk-Reward Ratio projection.
Additional Tips:
Leverage control matters because a technically correct pattern can still produce poor outcomes if the position is oversized. High leverage magnifies execution mistakes, emotional pressure, and drawdown speed, which is why pattern quality must always be matched with sensible exposure.
A trading journal is the final layer that many traders skip. Recording the pattern type, trend context, entry trigger, volume confirmation, stop logic, target selection, and post trade result helps identify whether the setup actually performs in real conditions or only looks good in hindsight.
FAQ
Is a hammer candlestick always bullish?
No. The classic hammer and the inverted hammer are generally treated as bullish reversal patterns when they appear after a downtrend, but the same lower wick shape after an uptrend is a hanging man candlestick, which carries bearish reversal implications.
Is reverse hammer candlestick different from inverted hammer candlestick?
In most trading usage, reverse hammer candlestick and inverted hammer candlestick refer to the same pattern. The standard textbook term is usually inverted hammer candlestick.
Does a red hammer candlestick mean the trade is bearish?
No. A red hammer candlestick does not automatically mean bearish, just as a green hammer candlestick does not automatically guarantee a bullish outcome. The interpretation depends on the shape, the surrounding trend, the level where it forms, and whether the next candle confirms the reversal.


