


The MT4 Indicator Library: Categorized By Trading Goal
To trade effectively, you must first understand that not all indicators serve the same purpose. Successful MT4 trading requires a toolbox approach where you select specific instruments based on the current market environment. By categorizing these tools into their functional groups such as ‘Trend’, ‘Momentum’, and ‘Volatility’, you can better align your technical analysis with your overall trading objective.
Trend Indicators
Trend indicators are designed to identify the overall direction of the market, helping you determine whether an asset is in a sustained uptrend, a downtrend, or moving sideways. One of the most foundational tools in this category is the Moving Average (MA), which calculates the average price over a specific period, such as 50 or 200 days, to smooth out price fluctuations and highlight the broader trajectory. Another sophisticated option is the Ichimoku Kinko Hyo, a comprehensive indicator that uses five distinct lines to provide a clearer view of support, resistance, and potential trend reversals all at once.
Momentum Oscillators
While trend indicators tell you where the market is going, momentum oscillators tell you how fast it is moving and if it is running out of steam. The Relative Strength Index (RSI) is a staple of MT4 trading, measuring the speed and change of price movements on a scale of 0 to 100. Traders typically look for RSI levels above 70 to identify overbought conditions or below 30 to spot oversold opportunities. Similarly, the Moving Average Convergence Divergence (MACD) helps identify shifts in momentum by comparing the relationship between two moving averages, often providing early signals of a trend change before it happens.
Volatility And Volume
Volatility indicators, such as Bollinger Bands, help you understand the "size" of market movements by plotting upper and lower bands based on standard deviations from a middle moving average. These bands widen during periods of high volatility and contract when the market is stable, signaling potential breakouts. To measure the ‘fuel’ behind these moves, the Average True Range (ATR) provides a look at the daily average volatility of a pair. For example, if the EUR/USD has an ATR of 100 pips, you can use this data to set more realistic take-profit targets and stop-loss orders that account for typical daily fluctuations.
How To Pair Indicators For Better Signals
The biggest mistake many beginners make on the MetaTrader 4 platform is relying on a single indicator for every decision. In professional trading, one indicator provides a signal, but a second indicator provides the confirmation. By pairing complementary tools, you create a ‘confluence’ of data that significantly reduces the likelihood of entering a trade based on a ‘false positive’ or market noise.
Relative Strength Index (RSI)
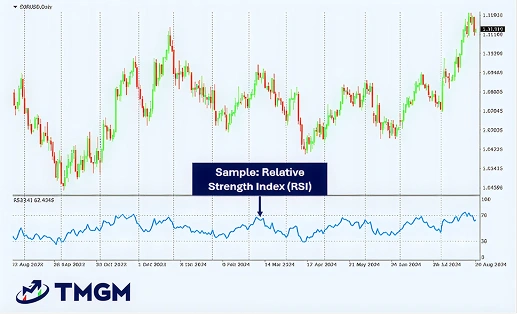
You can judge the potential momentum of a price increase/decrease using RSI. This indicator measures the speed and magnitude of a price change. The result indicates whether the security is over or undervalued. You can also explore other technical analysis tools to strengthen your chart readings.
Moving Average Convergence Divergence (MACD)
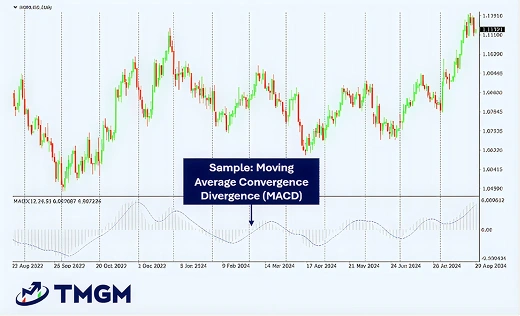
Our guide to MACD provides an in-depth look at this technical indicator and concepts integral to it, such as exponential moving averages. A simple definition of MACD is that it indicates potential entry and exit points based on average price movements over a specific timeframe.
Average True Range (ATR)
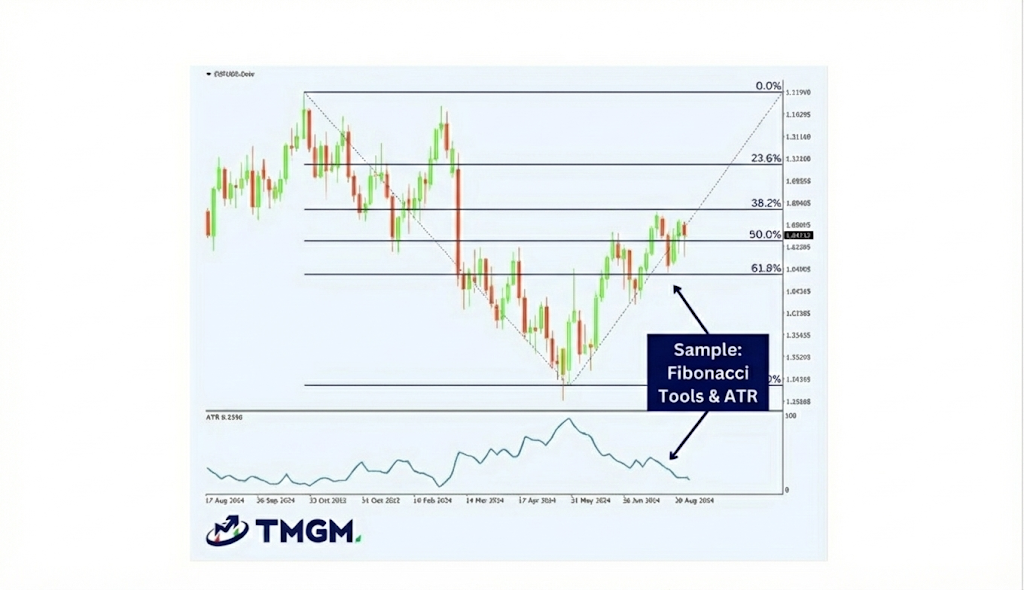
Fibonacci retracement levels help traders identify potential areas of support and resistance where a price correction might end and the original trend resume. In this example, these levels are paired with the Average True Range (ATR) indicator at the bottom, which measures market volatility. By combining these tools, a trader can identify a strategic entry point using Fibonacci levels and use the ATR value to set a stop-loss that accurately reflects current market conditions, rather than using an arbitrary number.
When you see the price touch the upper Bollinger Band (indicating volatility) while the RSI is simultaneously above 70 (indicating overbought momentum), the probability of a successful short-sell or exit increases dramatically. This multi-layered approach is what transforms a standard chart into a professional-grade trading strategy.
Custom MetaTrader 4 Indicators
In addition to these standard technical indicators, forex MT4 traders have come up with their own indicators and solutions. See our algorithmic trading guide for more ways to automate your strategy. These indicators are available via a public library inside MetaTrader 4. Some of the most popular custom MT4 indicators are:
- Order history indicator – overlay previous trades onto charts to easily view your past trades’ profits or losses.
- Pivot points indicator – paste pivot points onto charts and set up alerts so you can see potential upward and downward movements.
- High-low indicator – use this indicator to find historical price highs and lows for any timeframe.
- Renko indicator – add Renko blocks to charts so you can see price movements within small periods of time.
- Chart group indicator – link multiple charts on MT4 so you can simultaneously execute one action across multiple markets/assets.
- Freehand drawing indicator – draw lines manually so you can find potential patterns on MT4 charts.
Installing Custom Indicators
While the meta trader 4 platform comes pre-loaded with over 30 indicators, you may eventually want to install custom tools developed by the MQL4 community. The process for adding these to your terminal is straightforward:
Open your MT4 platform and navigate to File in the top navigation bar, then select Open Data Folder.
Inside the folder that appears, open the MQL4 folder and then the Indicators sub-folder.
Copy your custom indicator file (usually ending in .ex4 or .mq4) and paste it directly into this Indicators folder.
Restart your MT4 platform or right-click ‘Indicators’ in the Navigator window and select ‘Refresh’ to see your new tool ready for use.
MetaTrader 4 Add-Ons
While MT4’s user-friendly design makes it accessible for novice traders, its true potential is unlocked with third-party add-ons that cater to more advanced trading needs. With a few clicks, you can customise the MT4 platform to meet your specific needs using these popular add-ons:
Trading Automation
You can enable one-click or automatic trades with MetaTrader 4. What’s great about using MetaTrader 4 software through TMGM is that you can develop your own trading strategies and test them. Once you’ve done that, you can execute these strategies via automated trading bots in the MetaTrader 4 (MT4) platform.
Advanced Order Management
You use MetaTrader 4 add-ons, such as T Manager Plus, to execute advanced orders. As a standard, MT4 allows you to make market orders and pending orders, as well as stop loss and take profit orders.
With advanced order management MT4 add-ons, you can analyse the market and execute appropriate orders automatically.
Platform Customisation
You can customise the layout and indicators you use inside the MetaTrader 4 platform. For example, you can customise the colour of candlesticks and indicators on MetaTrader4 charts to reflect your personal trading style.
You can also change the design and size of chart elements. Then, if you want to get more technical and hands-on, you can create your own indicators using the MetaQuotes Language 4 (MQL4) and MetaEditor add-ons.
Market Analysis Tools
Analytics add-ons allow you to unlock the full potential of the MetaTrader 4 trading platform, providing deep insights that can elevate your trading strategies. For deeper insights, you can reference our Market Insight section. For example, the Correlation Matrix is a great tool for finding correlation coefficients between currency pairs.
Similarly, you can add Autochartist to MT4. This scans the market for potential trading options based on signals and patterns.
Sentiment Indicators
In addition to the TMGM Market Buzz sentiment tool, you can add extra sentiment indicators to MT4. The MT4 Sentiment Trader add-on gives you an overview of the long and short positions for each currency pair and displays the results as percentages.
Choosing the Right Indicators and Add-Ons

The number of options you get with MetaTrader 4 can be overwhelming. That’s why we recommend starting with the basics. Download the relevant MT4 software for your device and create an account.
After that, place a few simple buy/sell orders and get used to looking at the charts. Once you’ve done that, start adding indicators to your charts. You can use our Trading Academy to learn more about indicators, as well as different trading strategies for forex, shares, precious metals, and other financial instruments. Once you’re comfortable with the basics, you can consider also using MetaTrader 4 add-ons.
Mastering MT4 indicators is an ongoing journey of testing and refinement. Because every trader has a unique risk tolerance and style, the ‘best’ indicator is the one that fits your personal strategy. We recommend testing new combinations in a risk-free environment before applying them to live markets.


