

British Pound edges higher as traders await UK jobs CPI data
- GBP/USD rises as traders digest softer US inflation data.
- UK jobs and CPI figures could reshape BoE expectations.
- Middle East headlines may revive Dollar demand through yields.
The Pound Sterling registers modest gains of 0.14% on Monday as investors digest softer-than-expected US inflation data and brace for the release of crucial UK jobs and inflation data. The GBP/USD trades at 1.3552 after bouncing off daily lows of 1.3524.
GBP/USD firms as softer US inflation supports Fed hold bets
In the past week, inflation on the consumer and producer sides in the US pushed US Treasury yields lower, indicating that traders are not expecting a rate hike – at least at the September meeting, according to Prime Terminal. The disinflation process continued for the second straight month, yet Fed dovish officials are not out of the woods, amid the uncertainty around the Middle East conflict.

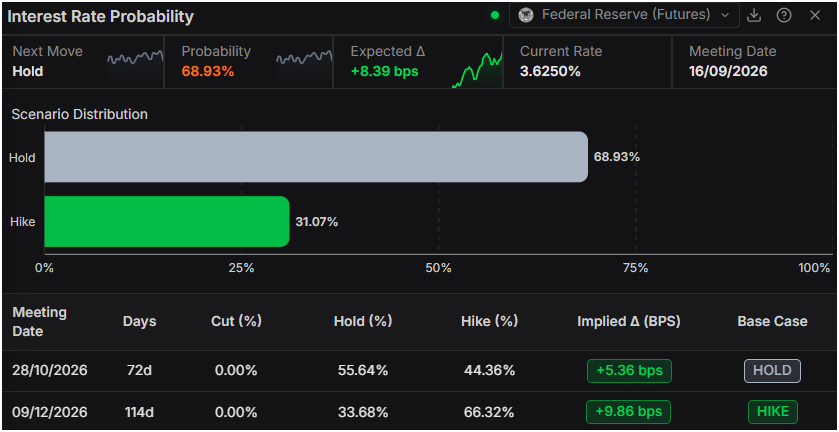
In the meantime, Investors see a nearly 69% chance that the Fed will hold rates unchanged, while the odds for the December meeting continue to price in a 66% chance of a 25-basis-point rate hike, according to Prime Terminal.
Last week’s data bolstered Sterling as the UK economy grew above estimates in June. Now eyes are on employment data, with the ILO Unemployment Rate expected to drop from 4.9% to 4.8% in the 3-month rolling average to June. The Claimant Count Change in July is projected to rise from 6.7K to 11.2K,
Regarding the UK’s inflation data, the Consumer Price Index (CPI) is projected to rise from 0.1% to 0.3% MoM in July, while on an annual basis is projected to rise from 2.6% to 2.9%. Meanwhile, core inflation is projected to tick lower from 2.6% to 2.5% YoY.
Aside from this, geopolitical headlines seem to resume at the beginning of the week as the Iranian Foreign Ministry stated that the “Islamabad agreement has not collapsed and the possibility of returning to it remains,” via Al Arabiya
If the US-Iran conflict escalates, this would benefit the Greenback, as inflationary pressures push US yields higher. The US Dollar Index (DXY), which tracks the performance of the buck’s value against six currencies, is down 0.15% at 99.48.
GBP/USD Price Forecast: Technical Outlook
In the daily chart, GBP/USD trades at 1.3561, extending a constructive near-term bullish bias as spot holds above the simple moving average cluster around 1.3378 and former descending trend-line resistance now turned support near 1.3416. The pair is also trading over the broken downtrend from 1.3653, with that line now reinforcing support around 1.3504, while the upward-sloping trend line from 1.3159, currently projected near 1.3600, acts as the next immediate resistance. A firm Relative Strength Index (14) near 65 hints that bullish momentum remains in place, though not yet into overbought territory.
On the topside, a clear break above the nearby resistance zone around the rising support-turned-cap near 1.3600 would open the door to further gains toward higher swing highs beyond the recent range. On the downside, initial protection is provided by the cluster of supports just under the market, starting with the former descending line now cushioning the pair around 1.3504, followed by the prior breakout area near 1.3416 and the daily simple moving average around 1.3378, with a deeper floor aligning with the secondary rising trend base near 1.3354.
(The technical analysis of this story was written with the help of an AI tool. Know more.)
Pound Sterling Price Today
The table below shows the percentage change of British Pound (GBP) against listed major currencies today. British Pound was the strongest against the Japanese Yen.
| USD | EUR | GBP | JPY | CAD | AUD | NZD | CHF | |
|---|---|---|---|---|---|---|---|---|
| USD | -0.15% | -0.17% | 0.03% | -0.03% | -0.39% | -0.27% | -0.45% | |
| EUR | 0.15% | -0.04% | 0.20% | 0.10% | -0.22% | -0.13% | -0.29% | |
| GBP | 0.17% | 0.04% | 0.24% | 0.14% | -0.16% | -0.09% | -0.25% | |
| JPY | -0.03% | -0.20% | -0.24% | -0.07% | -0.42% | -0.30% | -0.46% | |
| CAD | 0.03% | -0.10% | -0.14% | 0.07% | -0.35% | -0.24% | -0.40% | |
| AUD | 0.39% | 0.22% | 0.16% | 0.42% | 0.35% | 0.11% | -0.10% | |
| NZD | 0.27% | 0.13% | 0.09% | 0.30% | 0.24% | -0.11% | -0.16% | |
| CHF | 0.45% | 0.29% | 0.25% | 0.46% | 0.40% | 0.10% | 0.16% |
The heat map shows percentage changes of major currencies against each other. The base currency is picked from the left column, while the quote currency is picked from the top row. For example, if you pick the British Pound from the left column and move along the horizontal line to the US Dollar, the percentage change displayed in the box will represent GBP (base)/USD (quote).










