
News & AnalysisCareer

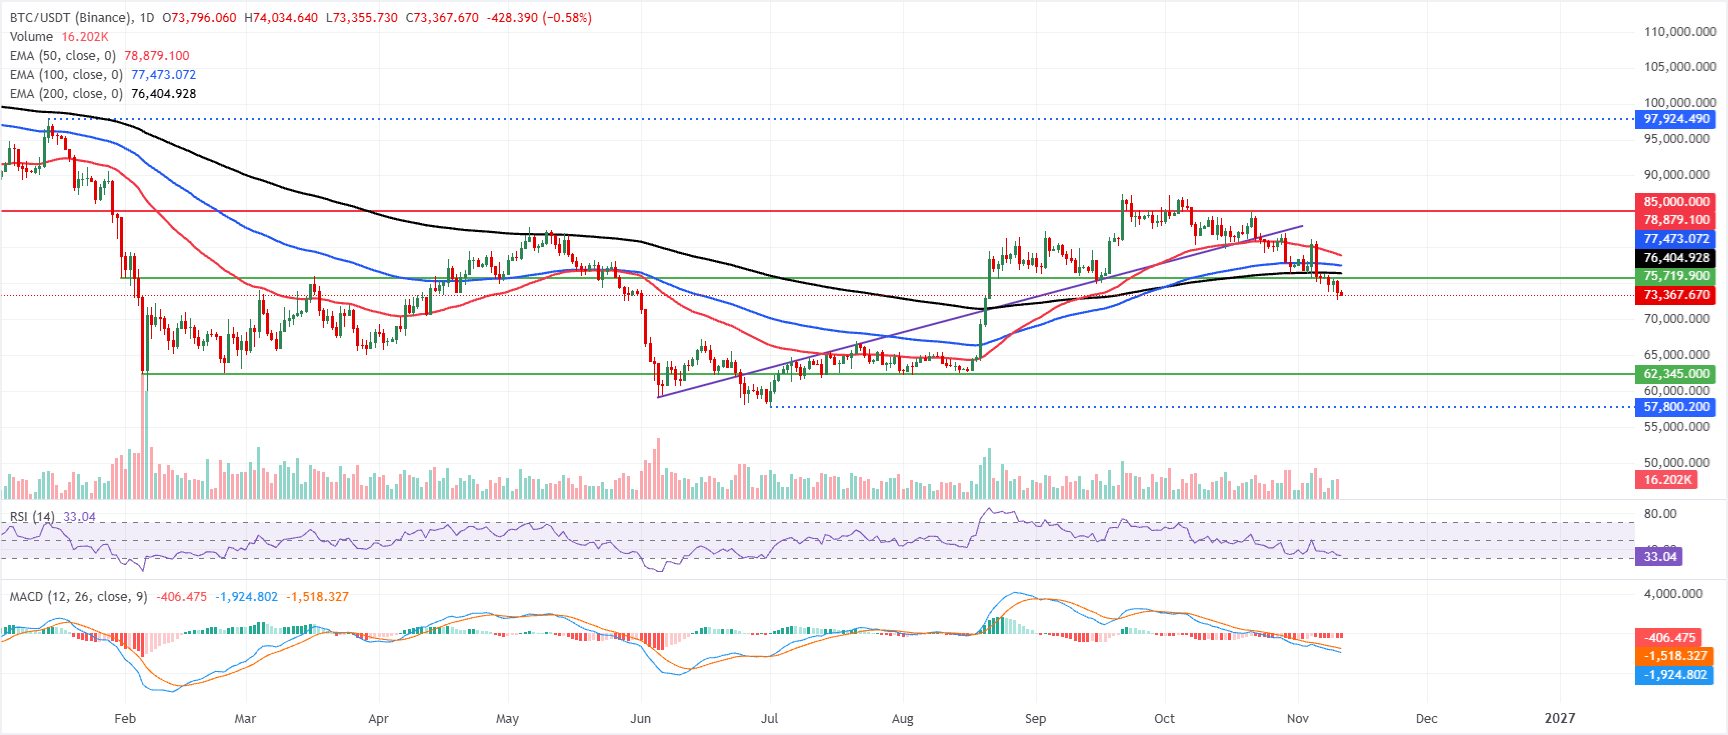
Higher-than-expected US Consumer Price Index (CPI) figures dampen risk appetite on Wednesday, pushing Bitcoin (BTC), Ethereum (ETH) and Ripple (XRP) further into losses. With BTC below $73,500 and ETH under $2,050, sellers in XRP are targeting psychological support at $1.00 as its correction continues. Across these top three cryptocurrencies, price action retains a bearish bias, and any relief rally is likely to encounter renewed selling.

At $73,367 on Wednesday, Bitcoin remains beneath its key Exponential Moving Averages (EMAs), maintaining a bearish short-term outlook. Resistance from these trend indicators is layered above the market: the 200-day EMA stands at $76,404, the 100-day at $77,473 and the 50-day at $78,879.
The momentum indicators also point lower. As the Relative Strength Index (RSI) drops towards the oversold threshold near 33, Moving Average Convergence Divergence (MACD) stays negative, suggesting sustained selling pressure rather than a bullish reversal in the immediate future.
Any recovery first faces the 200-day EMA around $76,404, ahead of the 100-day EMA at $77,473 and the 50-day EMA at $78,879. Buyers would have to regain this concentrated band of technical resistance to temper the prevailing downside bias. Beyond it lies a more significant obstacle at the horizontal resistance area near $85,000, where earlier selling interest could resurface.
With no nearby support identified, a fresh break below current levels would suggest a move towards the psychological support area around $70,000 before BTC stabilises.
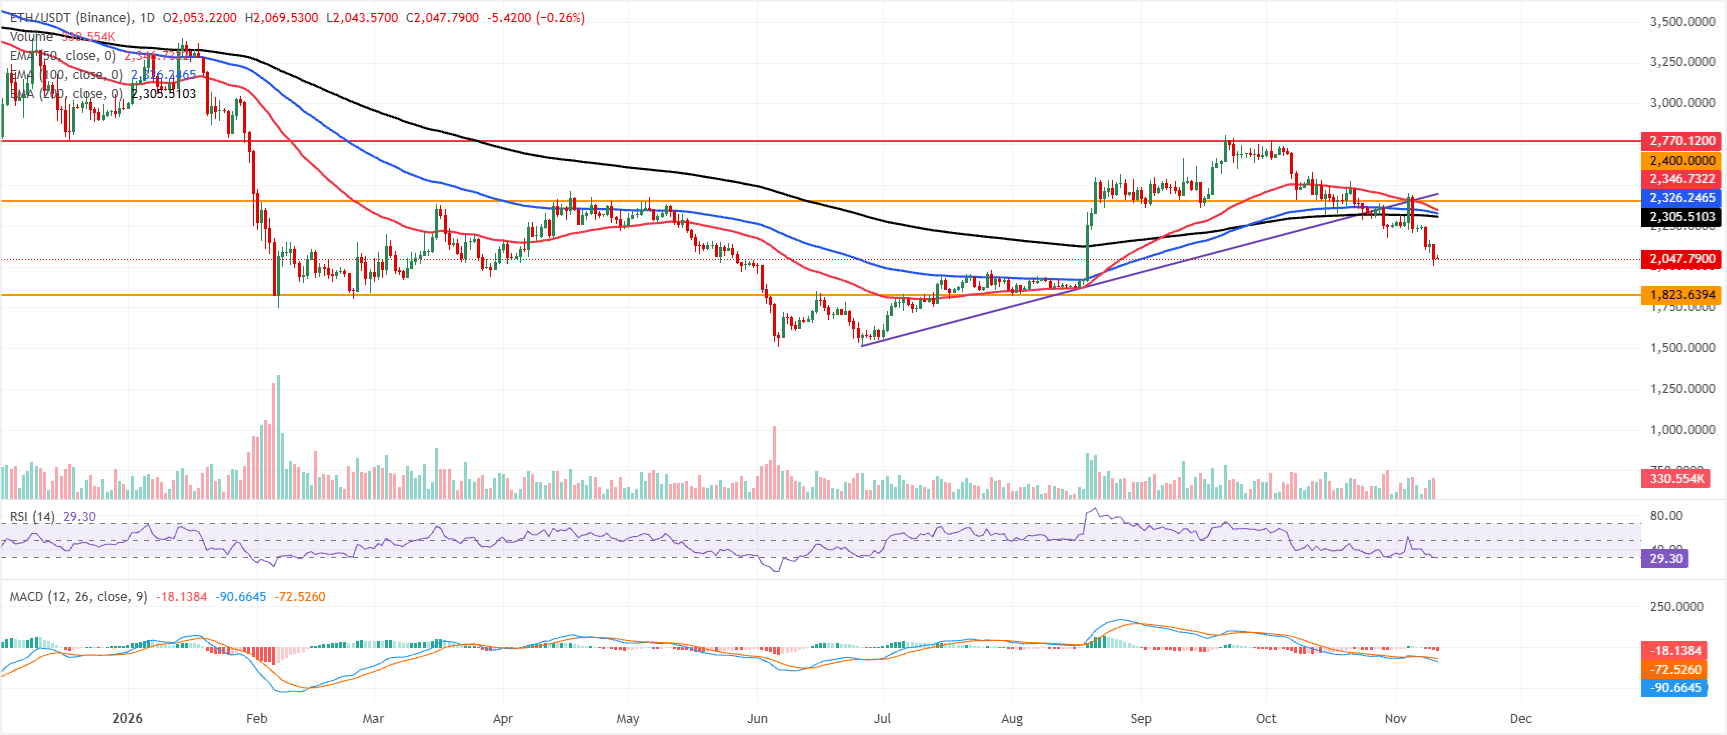
Trading at $2,047 on Wednesday, Ethereum remains firmly below the 50-day, 100-day and 200-day EMAs, grouped between roughly $2,305 and $2,346, sustaining its bearish phase. A break beneath the former rising trendline, which now acts as resistance near $2,445, adds to the corrective bias. At around 29, the RSI indicates oversold conditions that could moderate the downward pressure without yet reversing it. Meanwhile, a negative MACD reading suggests sellers still control momentum.
A recovery would initially encounter the 200-day EMA near $2,305, then the 100-day EMA at $2,326 and the 50-day EMA at $2,346. The more substantial horizontal obstacle at $2,400 comes next, ahead of the breached uptrend line around $2,445 and the more distant ceiling at $2,770.
Should the decline continue, the closest significant support lies at the horizontal level of $1,823.64, where buyers may try to establish a more lasting floor.
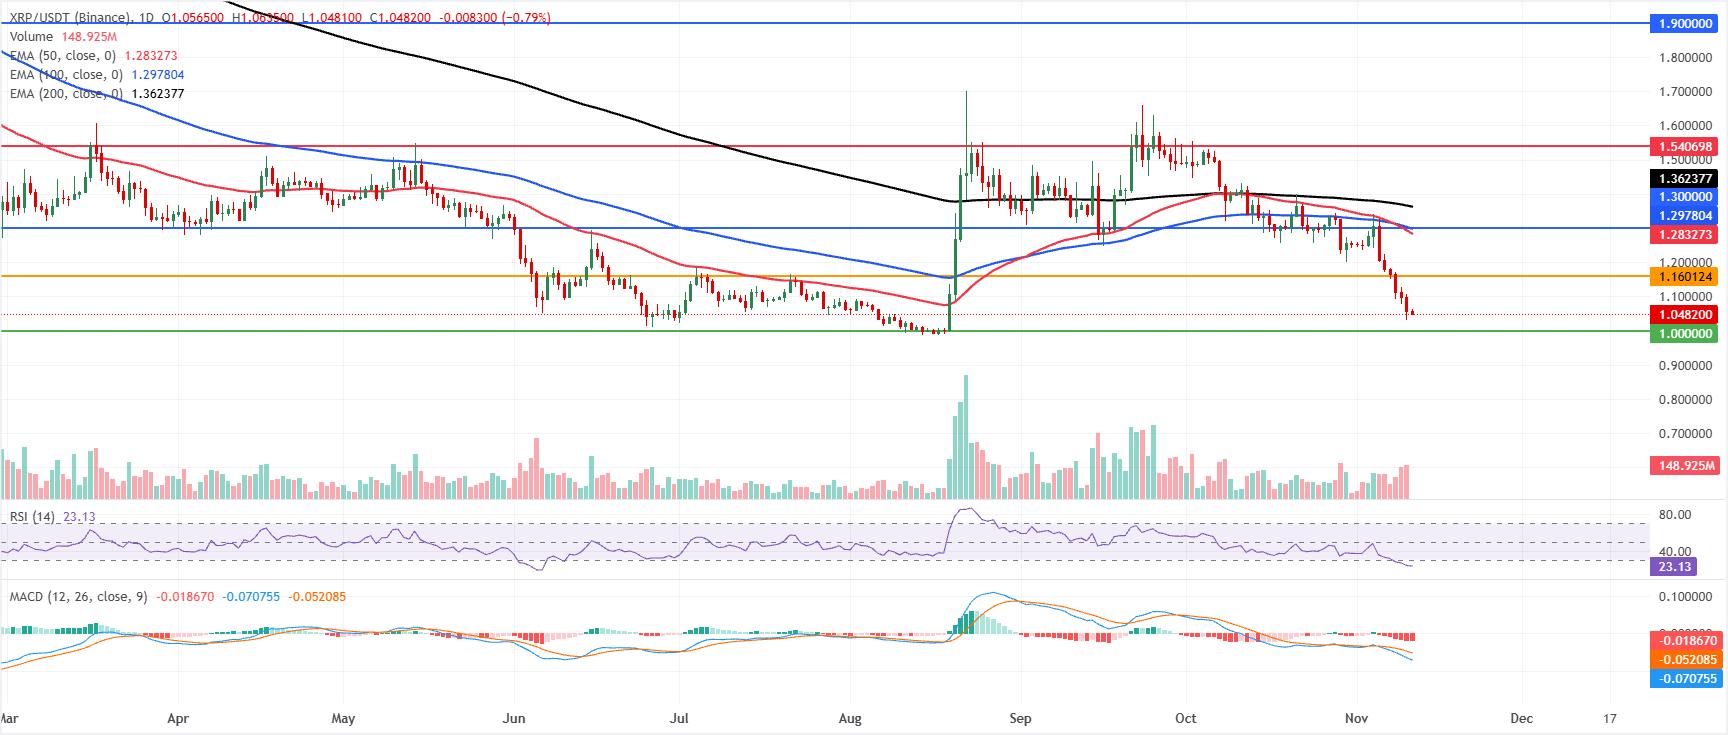
At $1.047 on Wednesday, XRP maintains a bearish short-term bias, trading well beneath its 50-day, 100-day and 200-day EMAs at $1.283, $1.297 and $1.362 respectively. This overhead grouping of moving averages continues to constrain the price. An RSI of 23 indicates oversold conditions, suggesting downward pressure is stretched but has not yet reversed. Despite that oversold backdrop, the MACD remains negative, signalling that momentum still favours sellers.
For any rebound, the first resistance level is $1.160, followed by the horizontal barrier at $1.300. The 50-day and 100-day EMAs at $1.283 and $1.297 strengthen this concentrated supply area ahead of the longer-term 200-day EMA at $1.362. Further resistance lies higher at $1.540 and $1.900.
The psychological $1.000 level provides immediate support. A clear break beneath it would leave scope for further losses, whereas remaining above it could permit a corrective rebound towards the resistance cluster outlined above.
(The technical analysis of this story was written with the help of an AI tool. Know more.)
For each cryptocurrency, its developer or creator sets the total number of tokens available to be minted or issued. The algorithm underpinning the blockchain technology determines how many of these assets can be minted through mining, staking or other mechanisms. Circulating supply can also shrink, whether through token burning or assets being mistakenly sent to addresses on other, incompatible blockchains.
Multiplying an asset’s circulating supply by its current market value gives its market capitalisation.
Over a specified trading period, such as 24 hours, trading volume measures the total number of tokens of a particular asset exchanged between buyers and sellers. By bringing together volumes from both centralised and decentralised exchanges, the metric helps assess market sentiment. A rise in trading volume often signals demand for an asset, as more people buy and sell the cryptocurrency.
Designed to encourage traders to take positions and keep perpetual contract prices aligned with spot markets, funding rates underpin an exchange mechanism that uses periodic payments to bring futures and index prices into convergence. A positive funding rate indicates that the perpetual contract price exceeds the mark price, so bullish traders holding long positions pay those holding short positions. Conversely, when the funding rate is negative, perpetual prices sit below the mark price and traders with short positions pay those holding long positions.










The information provided on this website is of a general nature only and does not constitute personal financial advice. Before acting on any information on this website, you should consider the suitability of the information in relation to your objectives, financial situation and needs. Investing in CFDs and FX Margin Contracts carries significant risks and is not suitable for all investors. You may lose more than your initial deposit. You do not own, or have, any interest in the underlying asset. We recommend that you seek independent advice and ensure you fully understand the risks involved before trading. It is important that you read and consider the disclosure document before you acquire any product listed on the website. The information and advertisements offered on this website are not intended for use by any person in any country or jurisdiction where such use would be contrary to local laws and regulations. The Products and Services offered on this website are not intended for residents of the United States, Malaysia and Thailand.
TMGM is authorized and regulated in various jurisdictions.
Trademax Australia Limited, trading as TMGM, is regulated by the Australian Securities and Investments Commission (ASIC), AFSL no. 436416 and is located at Level 28, One International Tower, 100 Barangaroo Avenue, 2000 Sydney, NSW Australia.
Email: support@tmgm.com.au
Trademax Global Limited, trading as TMGM, is authorized and regulated by the Vanuatu Financial Services Commission (VFSC), registration number 40356 and registered at 1276, Kumul Highway, Port Vila, Vanuatu, Republic of Vanuatu.
Email: support@tmgm.com
Trademax Global Markets (SE) Limited, trading as TMGM, is authorized and regulated by the Financial Services Authority (FSA) of Seychelles, with license number SD224. The company is registered at Office No 13, Providence Estate ABIS Centre, Mahe, Seychelles.
Email: support@tmgm.com
Trademax Global Markets (International) Pty Ltd, trading as TMGM, is authorized and regulated by the Financial Services Commission, Mauritius (FSC) with license no. GB22201012, and registered at 33, Edith Cavell Street C/o IQ EQ Fund Services (Mauritius) Ltd Port Louis, 11324 Mauritius.
Email: support@tmgm.com
Copyright © TMGM. All rights reserved


