
News & AnalysisCareer

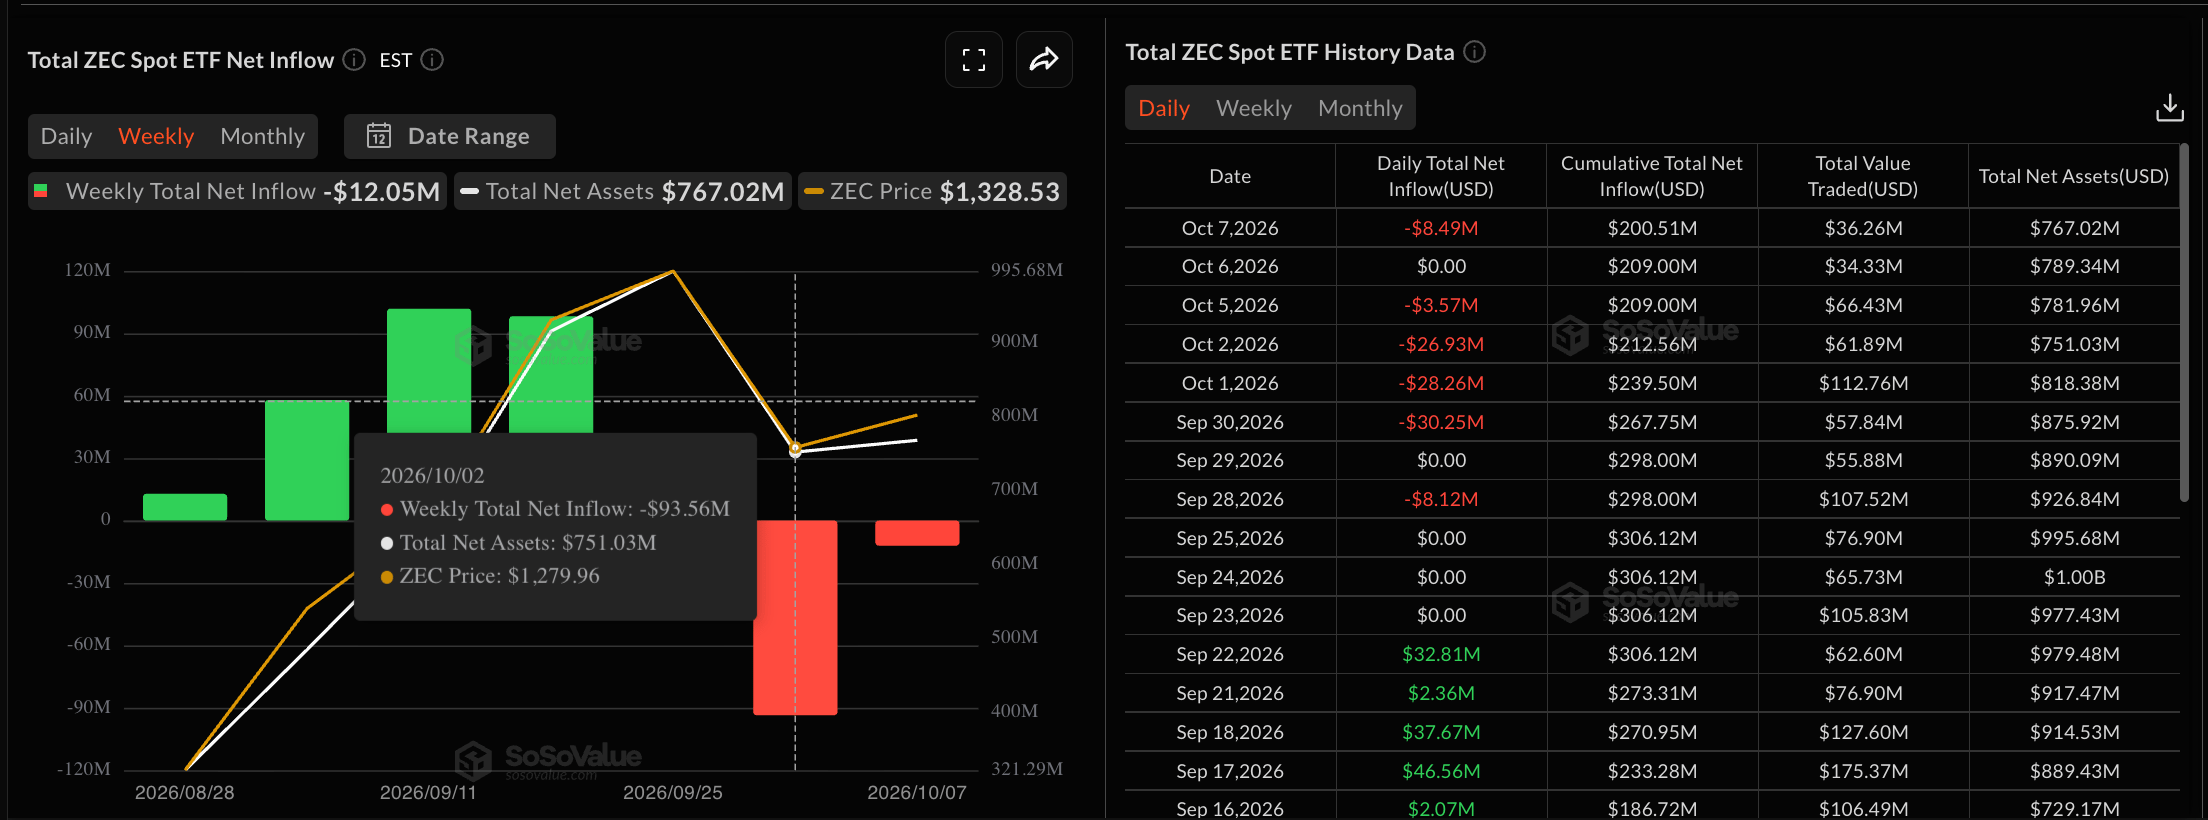
Zcash (ZEC) price is trading below $1,300 on Thursday, continuing a steady decline over the past 10 days and slipping from its $1,698 peak on September 27. Grayscale’s ZEC Exchange-Traded Fund (ETF) continues to record consistent outflows, with $8.49 million on Wednesday, suggesting reduced demand following the recent stock split. The technical outlook for ZEC is bearish, with bears focused on a break below the 200-period Exponential Moving Average (EMA) on the 4-hour chart around $1,287.

Grayscale’s Zcash-focused ETF (ZCSH) is experiencing persistent selling pressure, driven by investor redemptions last week following the 3-for-1 stock split. SoSoValue data shows $8.49 million in outflows on Wednesday, bringing the week's total to $12.05 million, up from $93.56 million last week.
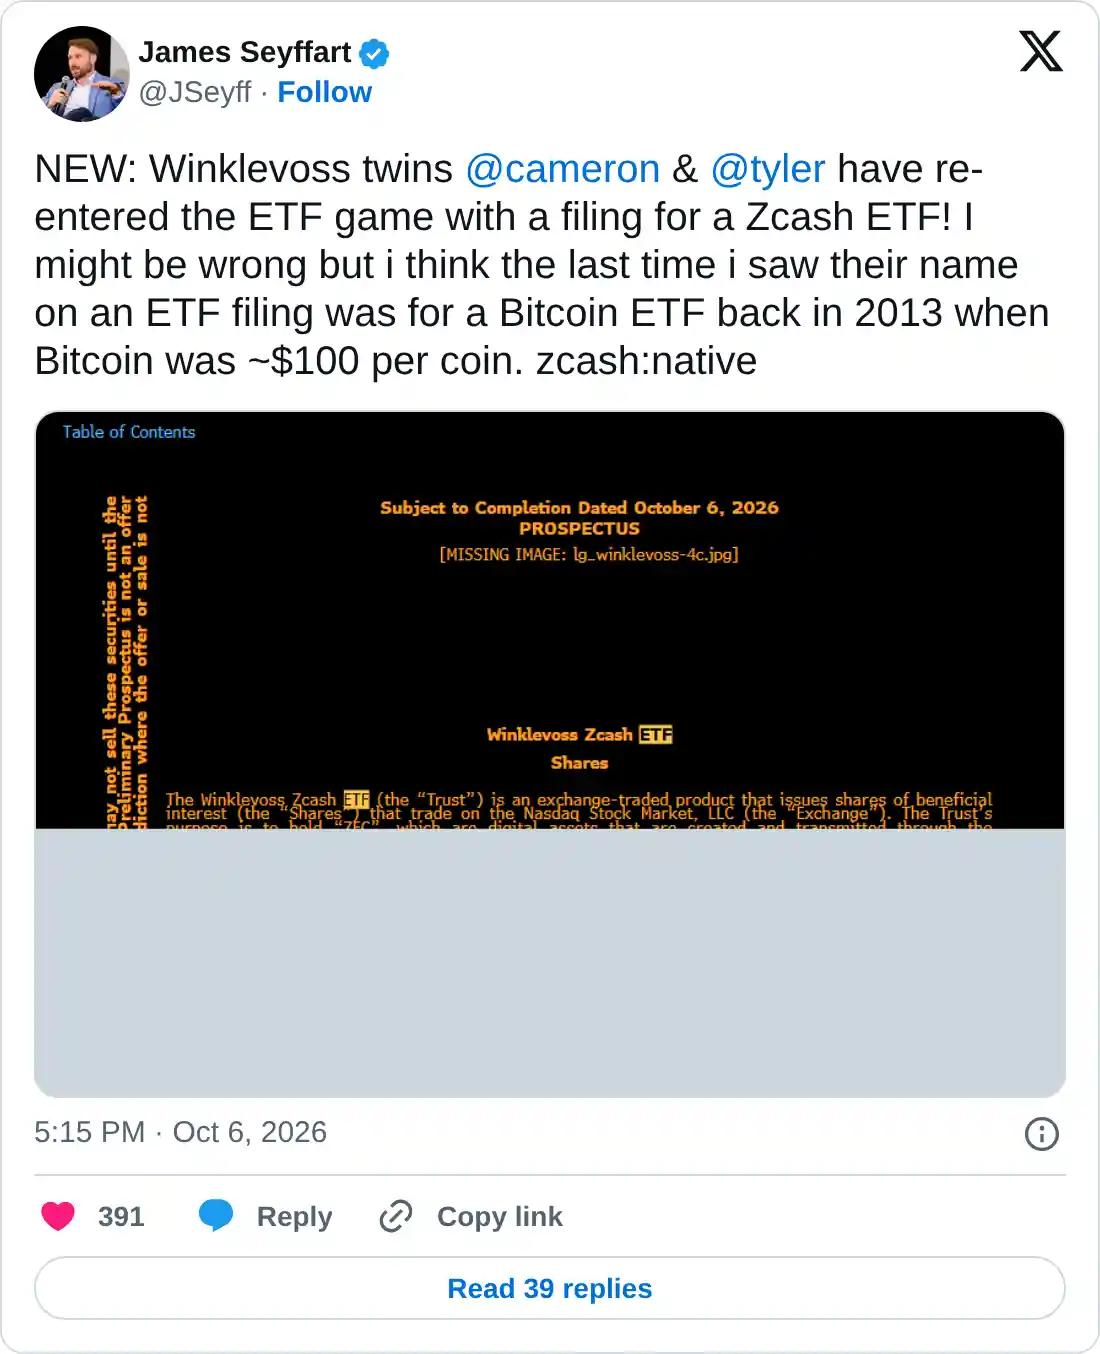
On the other hand, a fresh ZEC-focused ETF filing has been submitted by Cameron and Tyler Winklevoss, 13 years after their Bitcoin ETF filing in 2013. This suggests a long-term constructive outlook for the privacy coin from industry pioneers. Still, the short-term outflows weigh on the spot market, risking further corrective moves.
Zcash trades around $1,246 at press time on Thursday, maintaining a bearish near-term bias. The privacy token is trading below its 200-period EMA at $1,287 on the 4-hour chart, while the declining 50-day EMA risks crossing below the longer-term average, a death cross pattern that would confirm a bearish trend reversal.
Momentum on the 4-hour chart shows a corrective bias, with the Moving Average Convergence Divergence (MACD) crossing below the signal line, while the Relative Strength Index (RSI) near 33 suggests building downside pressure with conditions edging toward oversold rather than a firm base.
From a technical perspective, a decisive sustained breakout below the 200-period EMA at $1,287 could extend the decline toward the $1,050 support level set by the September 4 high. Any deeper pullbacks could risk surpassing the $1,000 psychological support level and testing the $888 horizontal level set by the August 23 high.
On the topside, initial resistance is located at the 200-period EMA around $1,287, with a stronger cap at the 50-period EMA near $1,355. Zcash must reclaim these levels to ease the current bearish tone.
(The technical analysis of this story was written with the help of an AI tool. Know more.)










The information provided on this website is of a general nature only and does not constitute personal financial advice. Before acting on any information on this website, you should consider the suitability of the information in relation to your objectives, financial situation and needs. Investing in CFDs and FX Margin Contracts carries significant risks and is not suitable for all investors. You may lose more than your initial deposit. You do not own, or have, any interest in the underlying asset. We recommend that you seek independent advice and ensure you fully understand the risks involved before trading. It is important that you read and consider the disclosure document before you acquire any product listed on the website. The information and advertisements offered on this website are not intended for use by any person in any country or jurisdiction where such use would be contrary to local laws and regulations. The Products and Services offered on this website are not intended for residents of the United States, Malaysia and Thailand.
TMGM is authorized and regulated in various jurisdictions.
Trademax Australia Limited, trading as TMGM, is regulated by the Australian Securities and Investments Commission (ASIC), AFSL no. 436416 and is located at Level 28, One International Tower, 100 Barangaroo Avenue, 2000 Sydney, NSW Australia.
Email: support@tmgm.com.au
Trademax Global Limited, trading as TMGM, is authorized and regulated by the Vanuatu Financial Services Commission (VFSC), registration number 40356 and registered at 1276, Kumul Highway, Port Vila, Vanuatu, Republic of Vanuatu.
Email: support@tmgm.com
Trademax Global Markets (SE) Limited, trading as TMGM, is authorized and regulated by the Financial Services Authority (FSA) of Seychelles, with license number SD224. The company is registered at Office No 13, Providence Estate ABIS Centre, Mahe, Seychelles.
Email: support@tmgm.com
Trademax Global Markets (International) Pty Ltd, trading as TMGM, is authorized and regulated by the Financial Services Commission, Mauritius (FSC) with license no. GB22201012, and registered at 33, Edith Cavell Street C/o IQ EQ Fund Services (Mauritius) Ltd Port Louis, 11324 Mauritius.
Email: support@tmgm.com
Copyright © TMGM. All rights reserved


