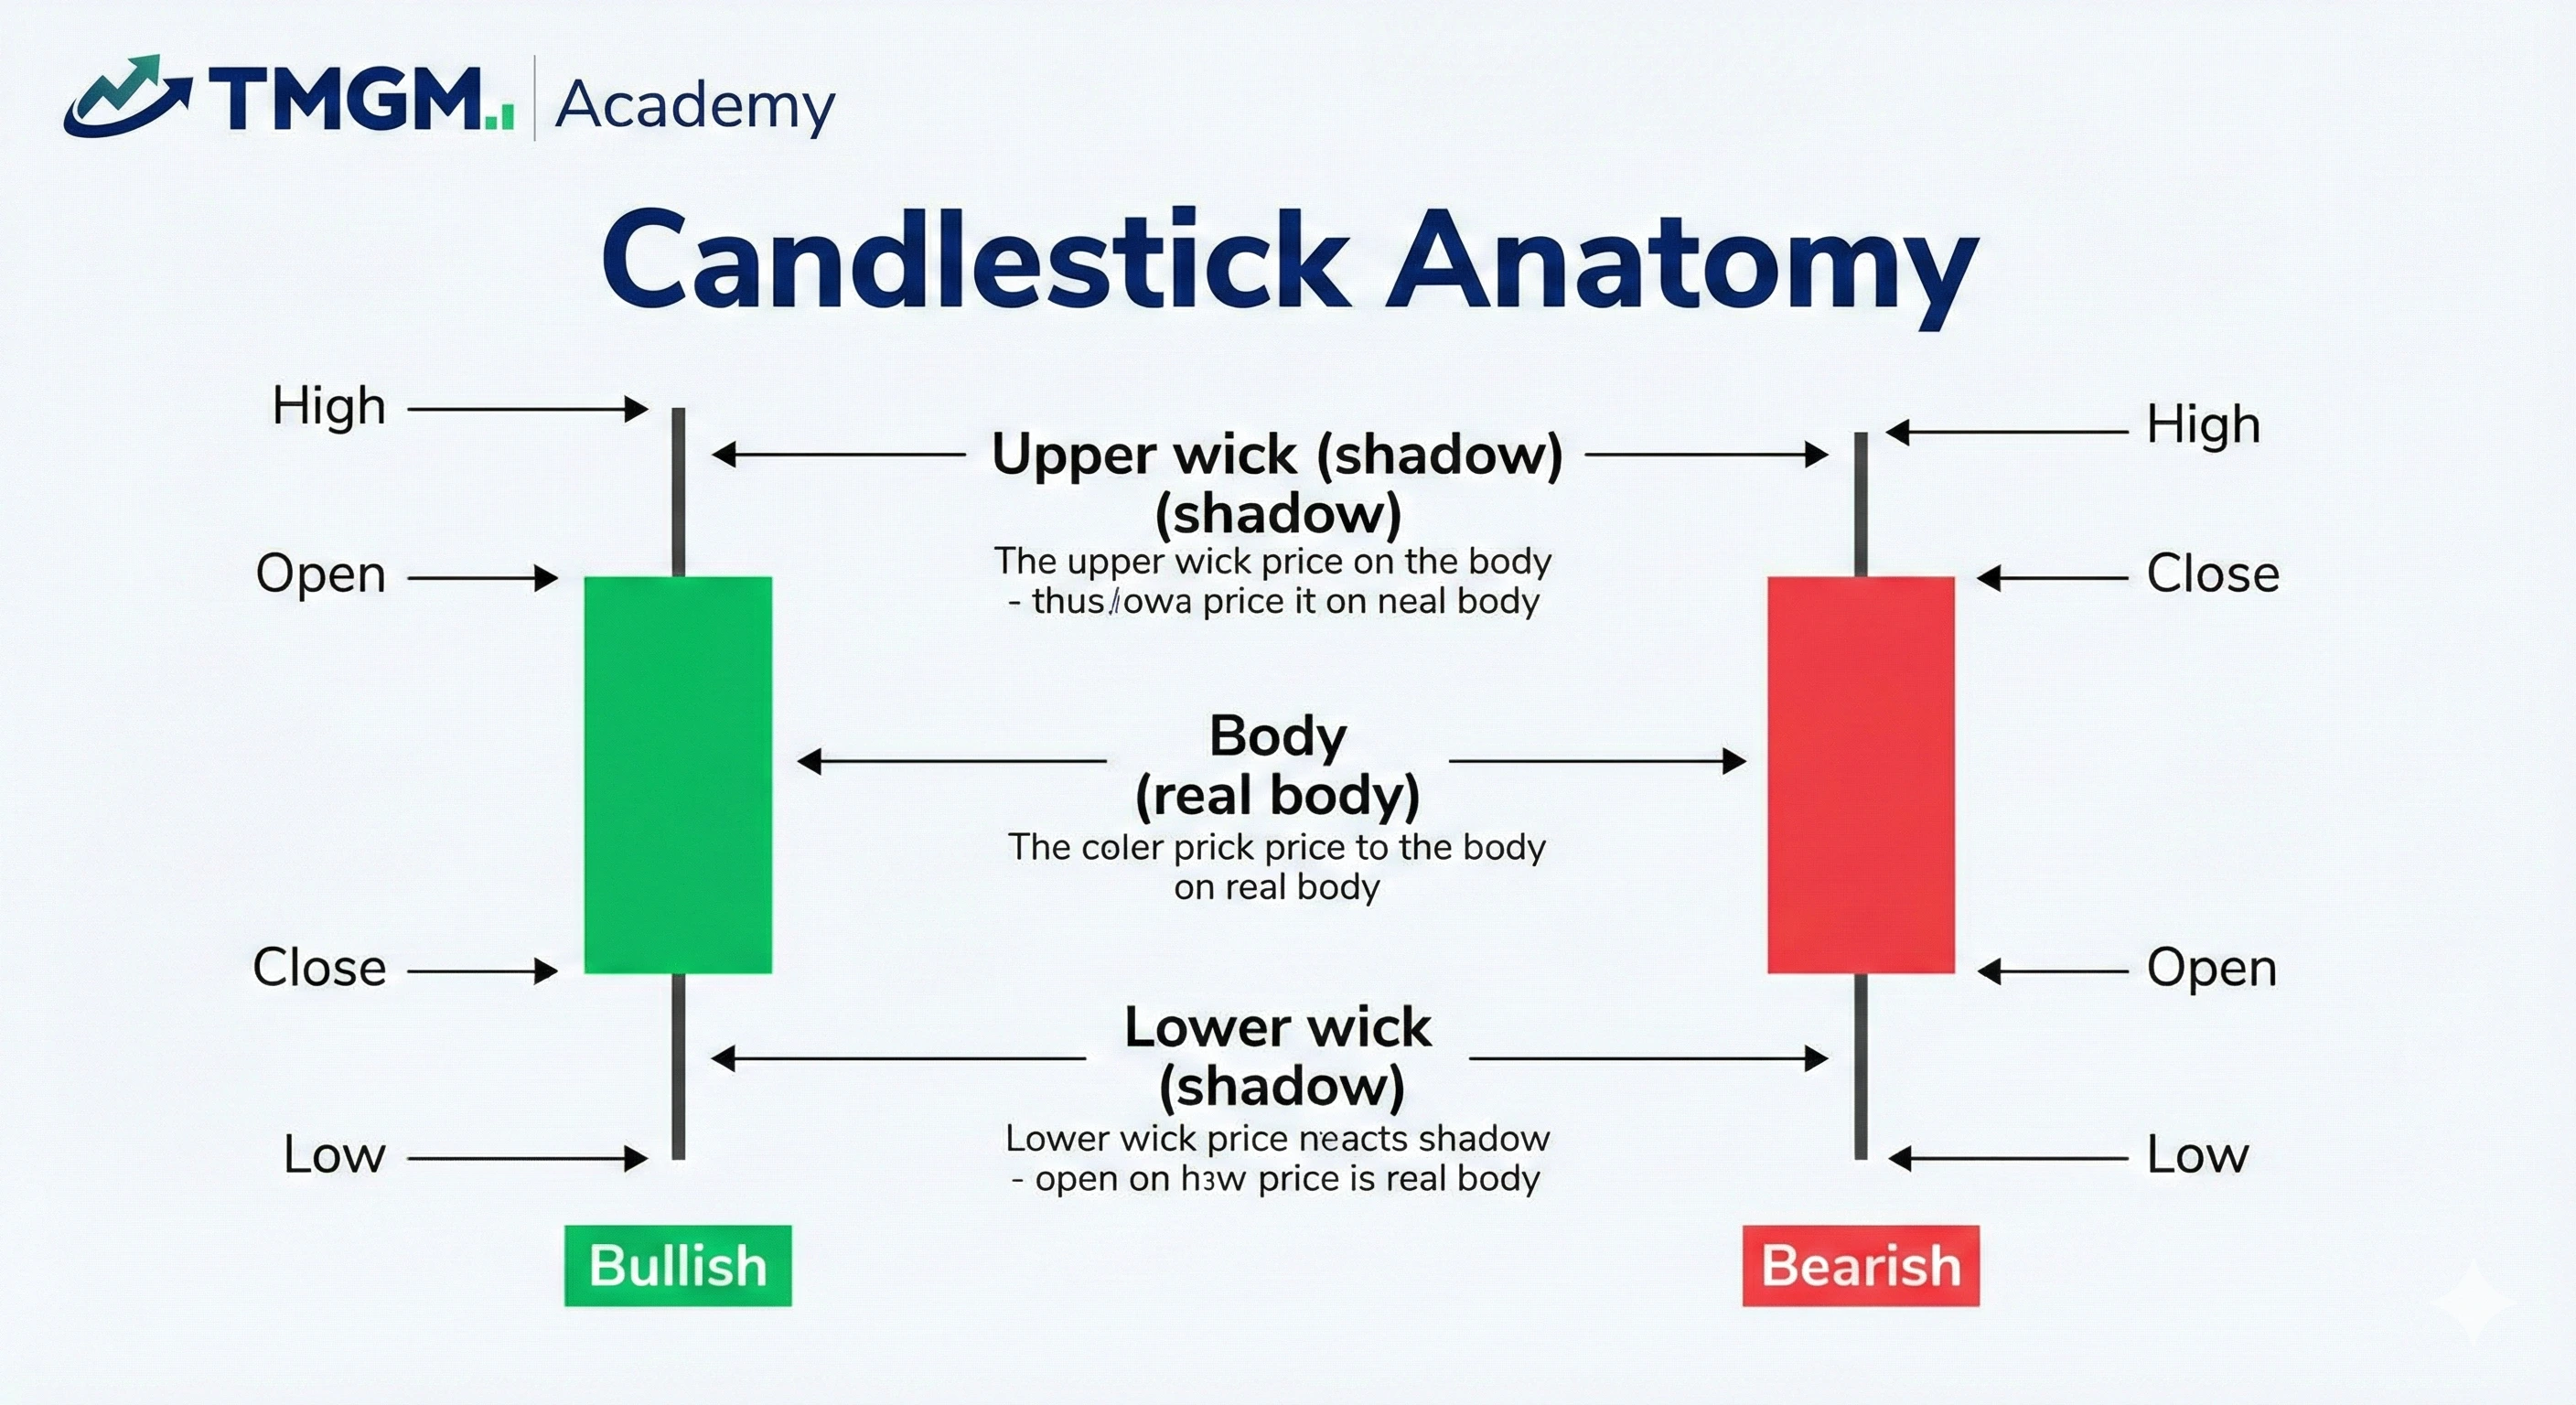
Important Components of a Candlestick
Candlesticks aka japanese candlestick is a compact record of the open, high, low, and close, designed to show who won the session by where price closes. On a candlestick, the close is the last price that was traded when market hours closed.
It matters most because it reveals whether buyers or sellers had the final control. The study of the traders behaviour and mechanism behind each candlestick pattern, is called Price Action Analysis, where you figure out how panic buy, panic sell, momentum gain or loss causes the formation of a particular candlestick pattern.
Single candlestick patterns
Single candlestick pattern formations are the earliest indicators of shifting momentum. They are ranked below by clarity of control, not guaranteed accuracy. A single candle can warn you early, but it cannot prove follow through by itself, so confirmation is mandatory especially for reversal candlestick patterns.
Doji Candlestick
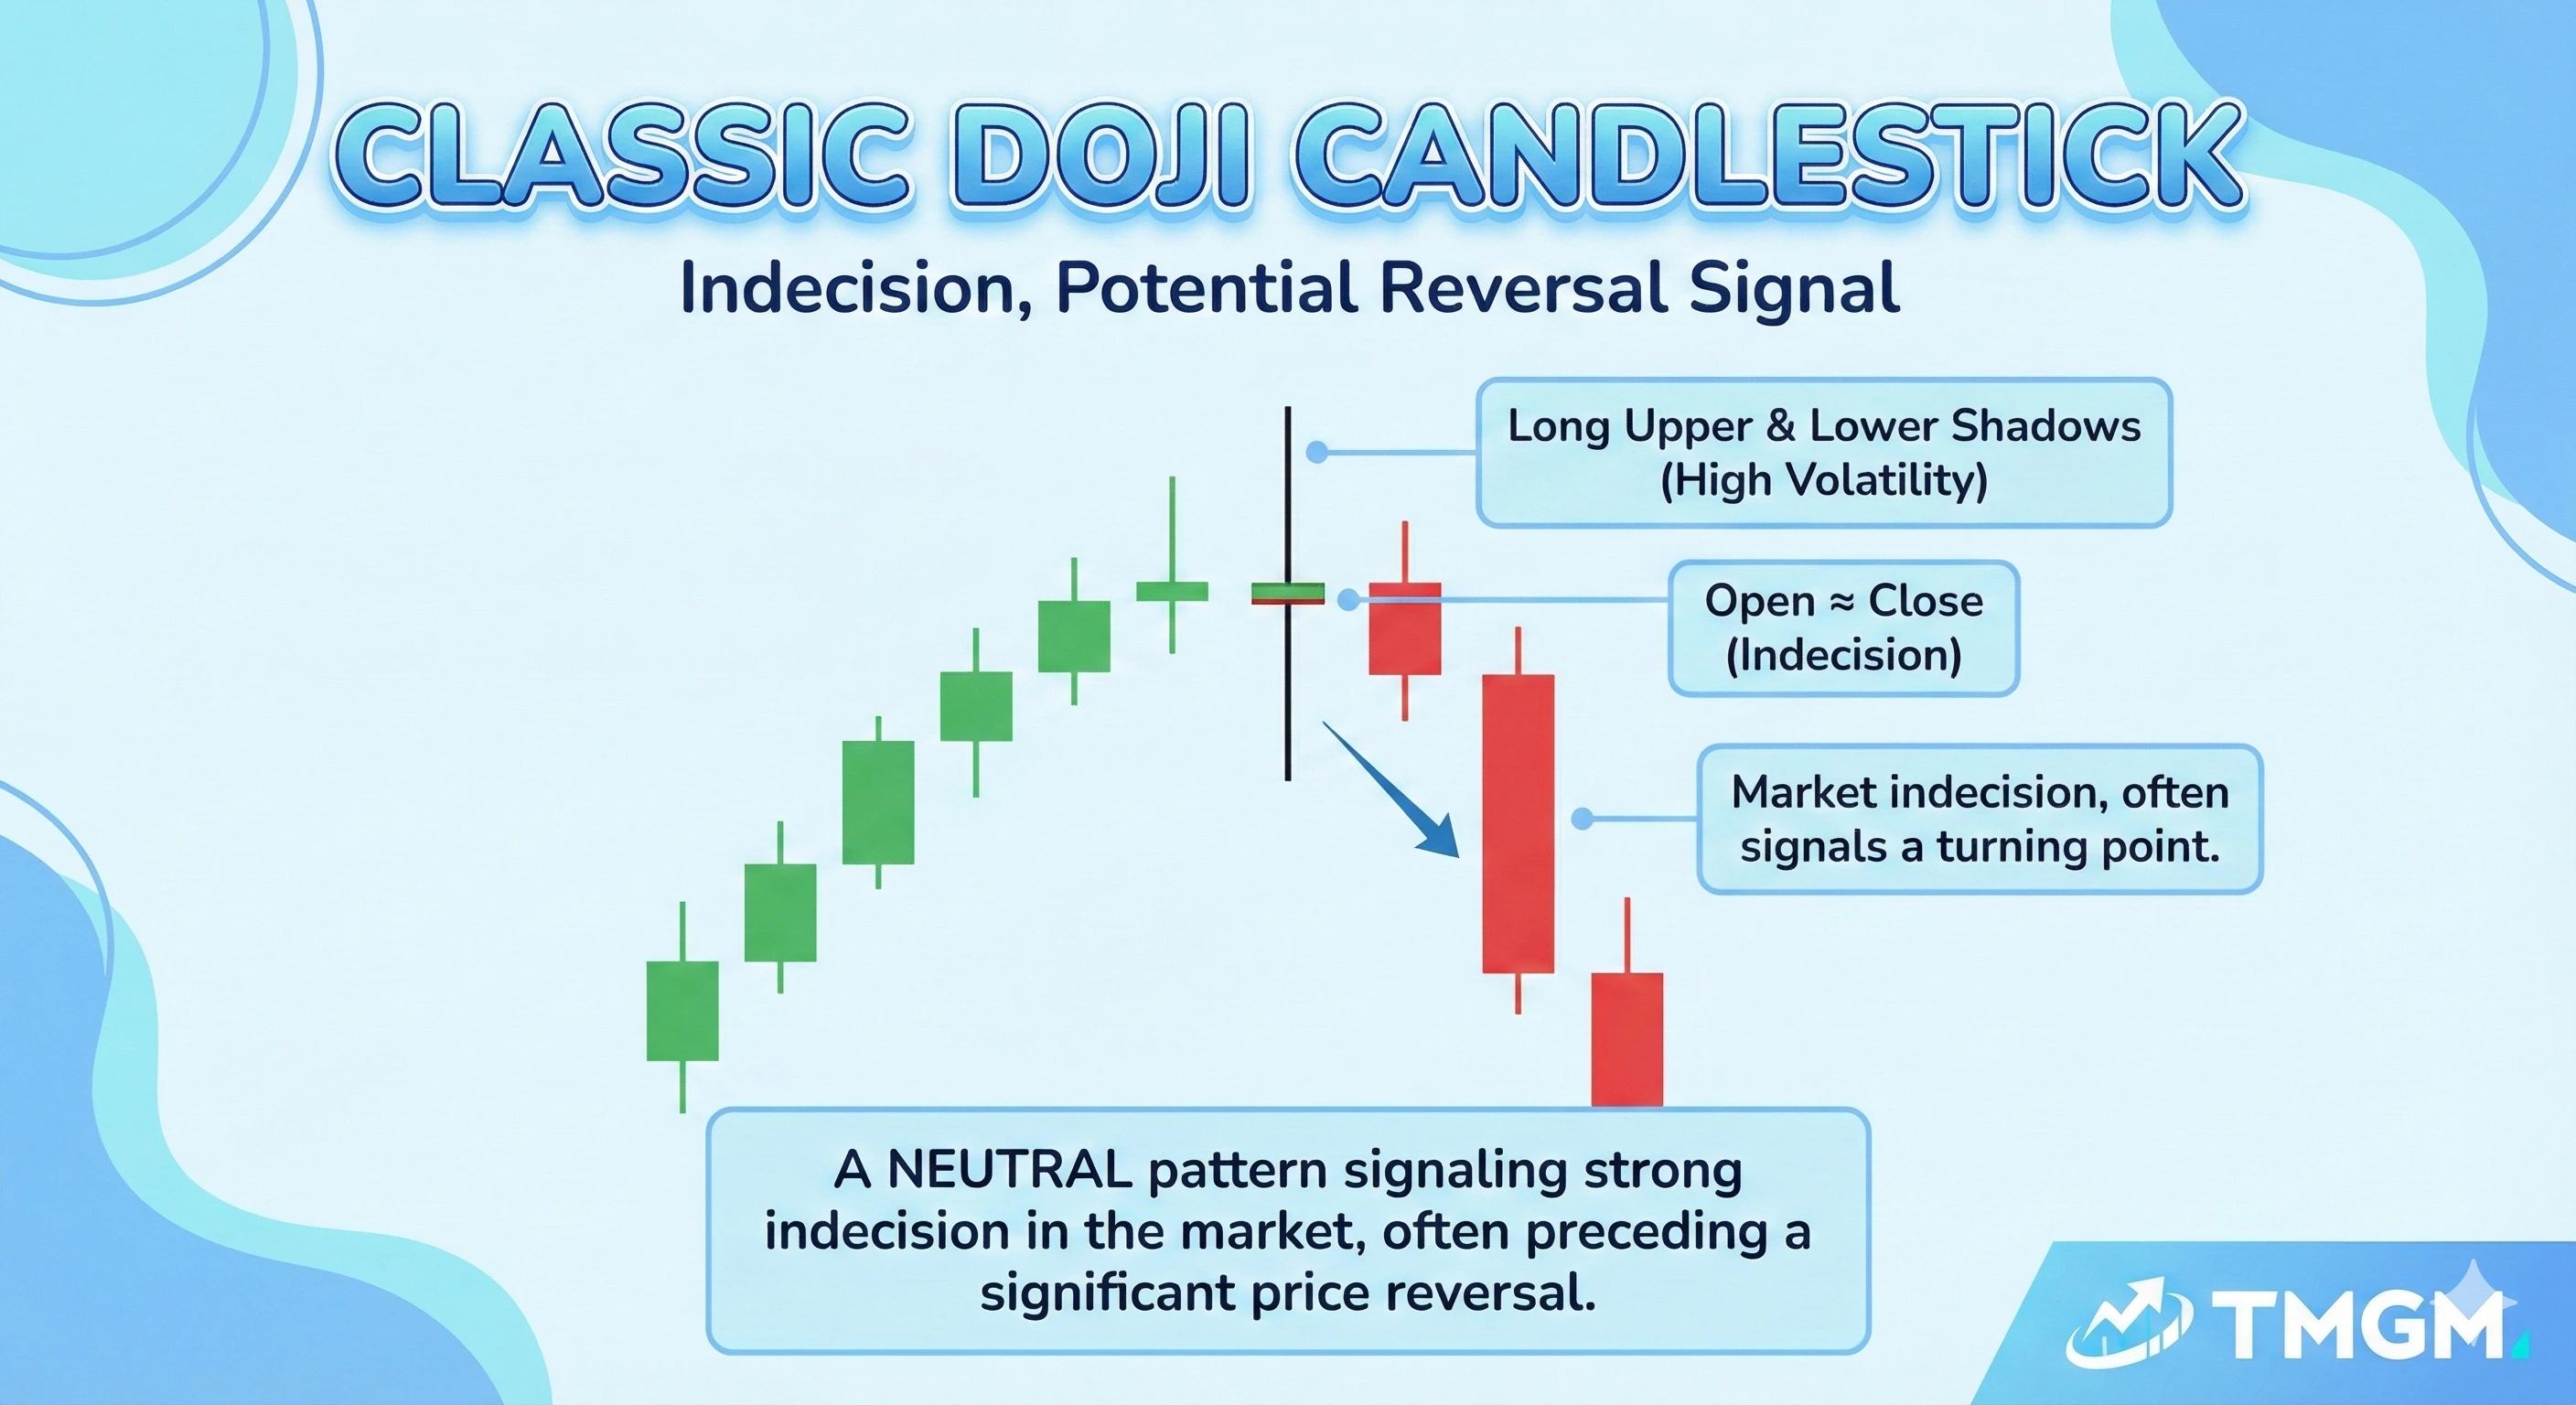
This is an indecision candlestick pattern, both buy side and sell side momentum did not win. It prints with a very small real body and often noticeable wicks, which means neither side could hold control into the close and momentum is unstable. It works best after an extended move or at clear support or resistance where a shift in control would matter. It is confirmed when the next candle closes decisively in one direction, ideally breaking and closing beyond the doji high or low.
Variations:
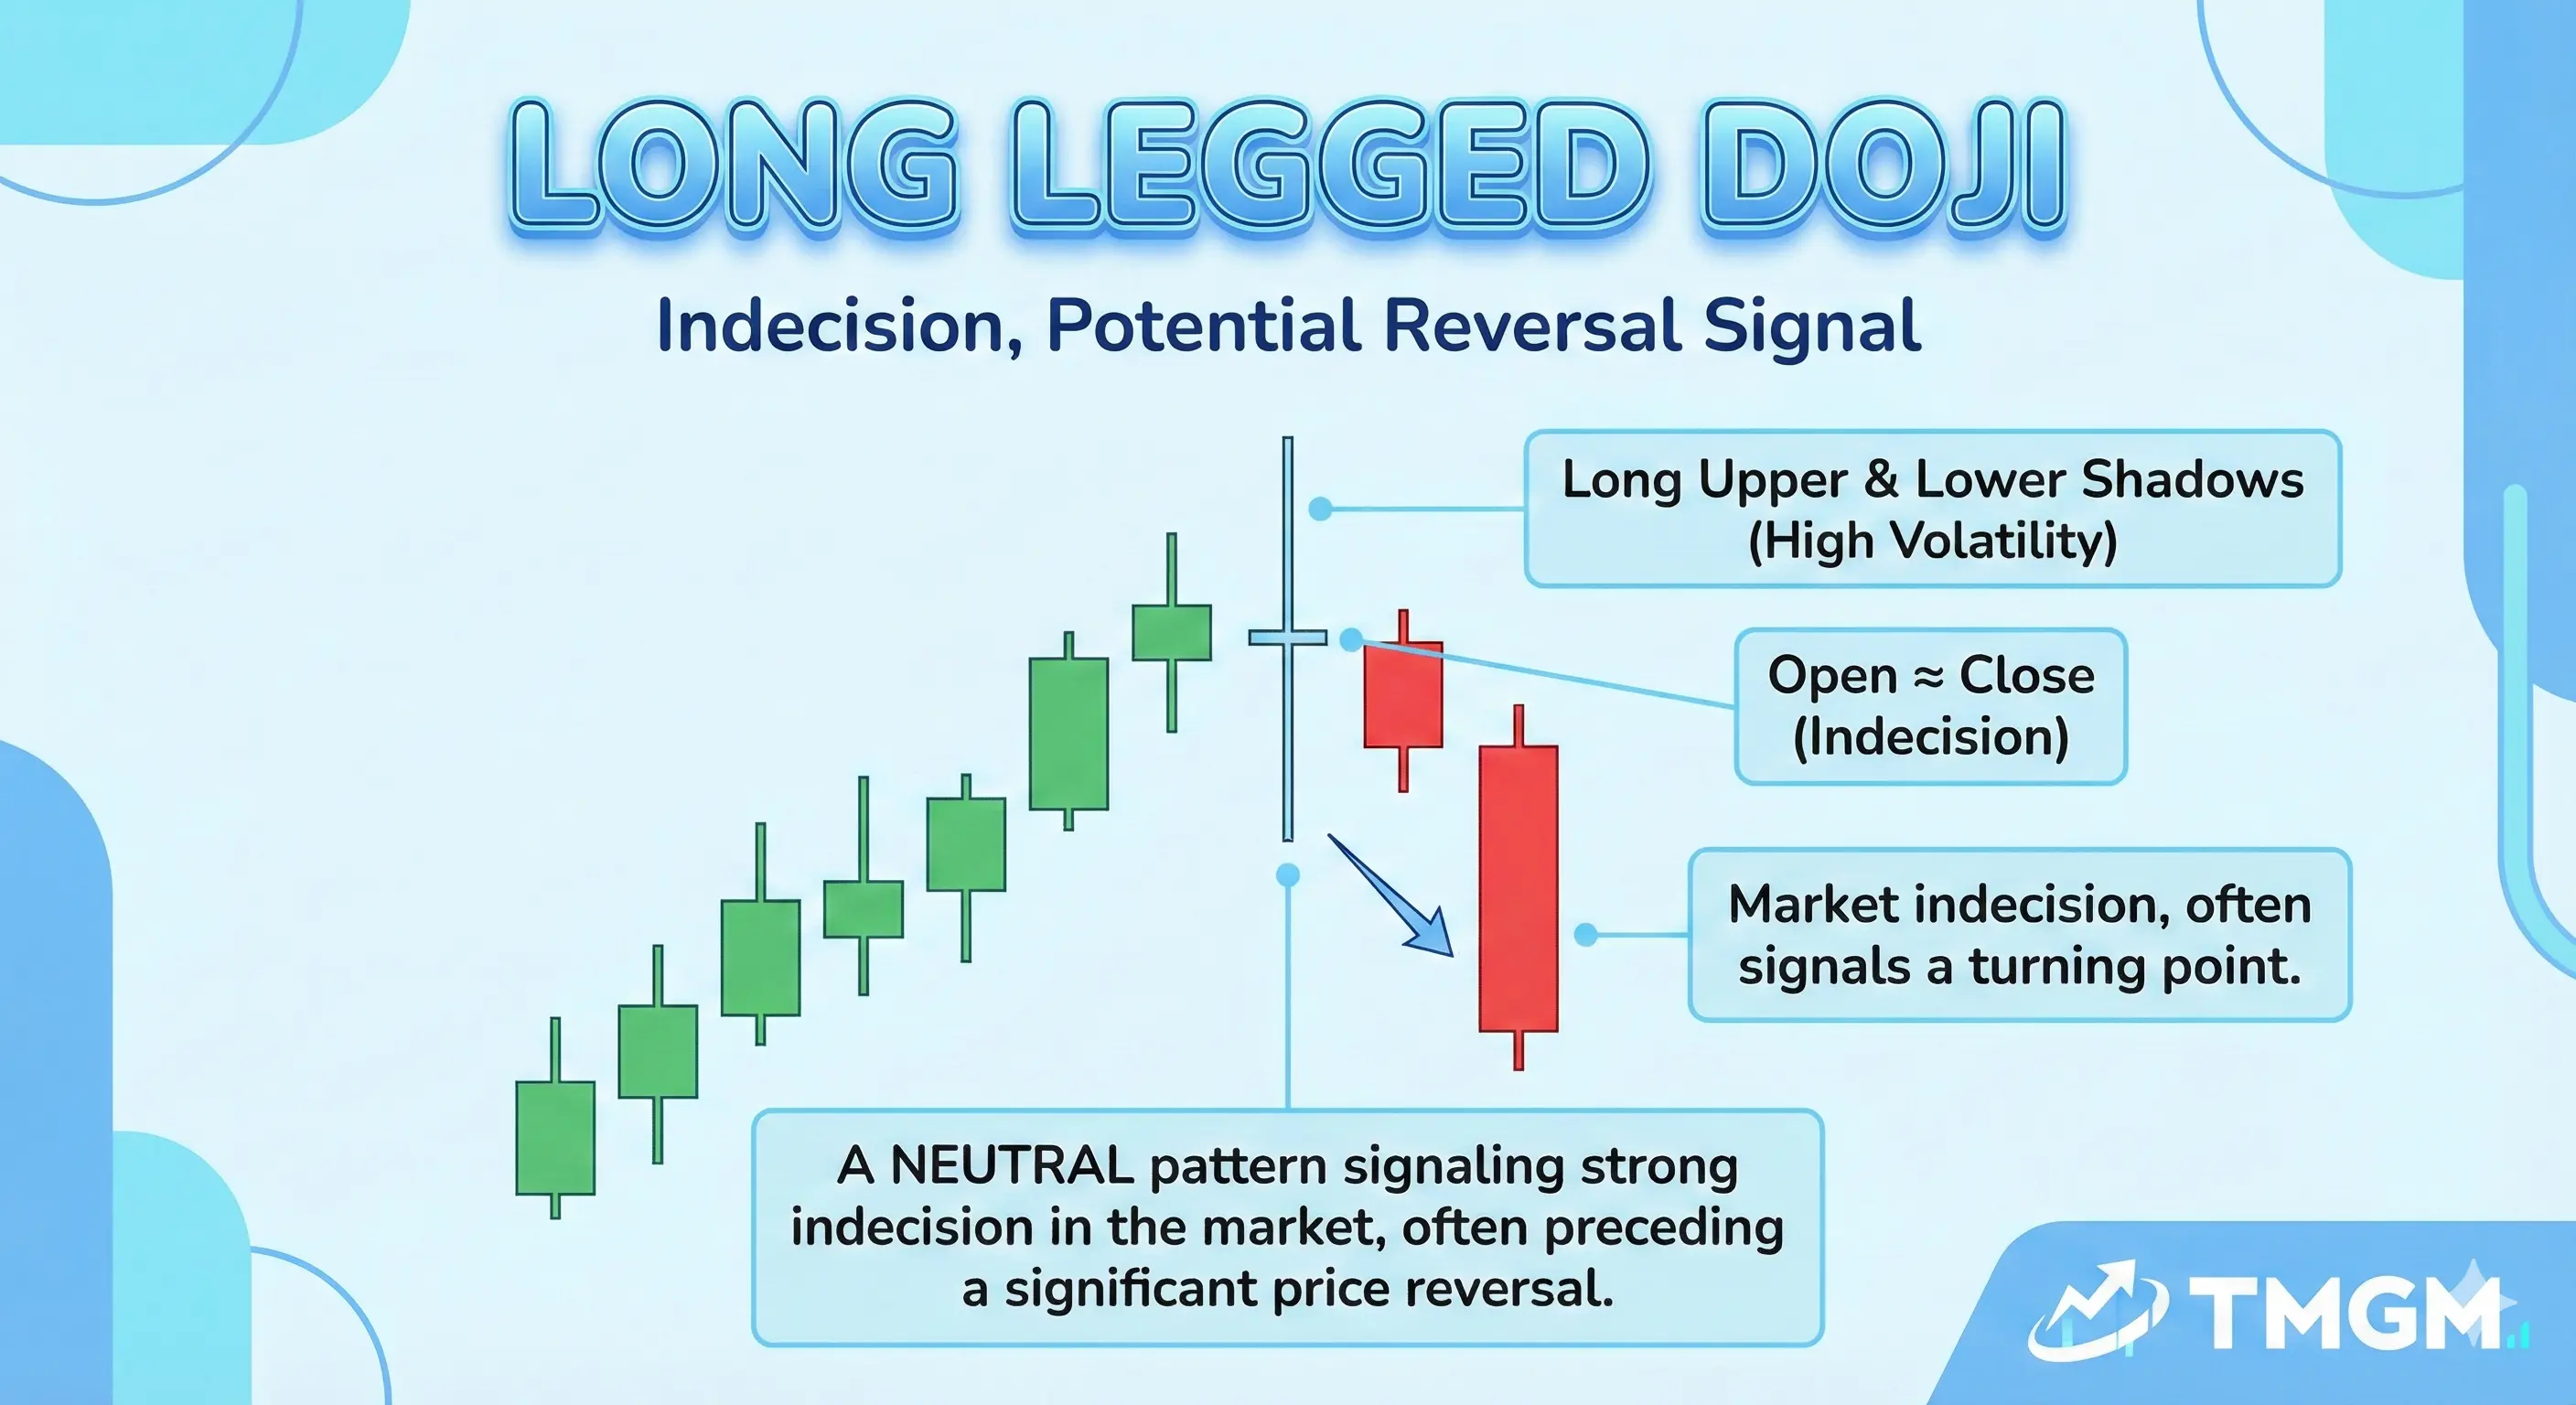
Long-Legged Doji
Big wicks, high conflict both ways, often a stronger sign that control is breaking down.
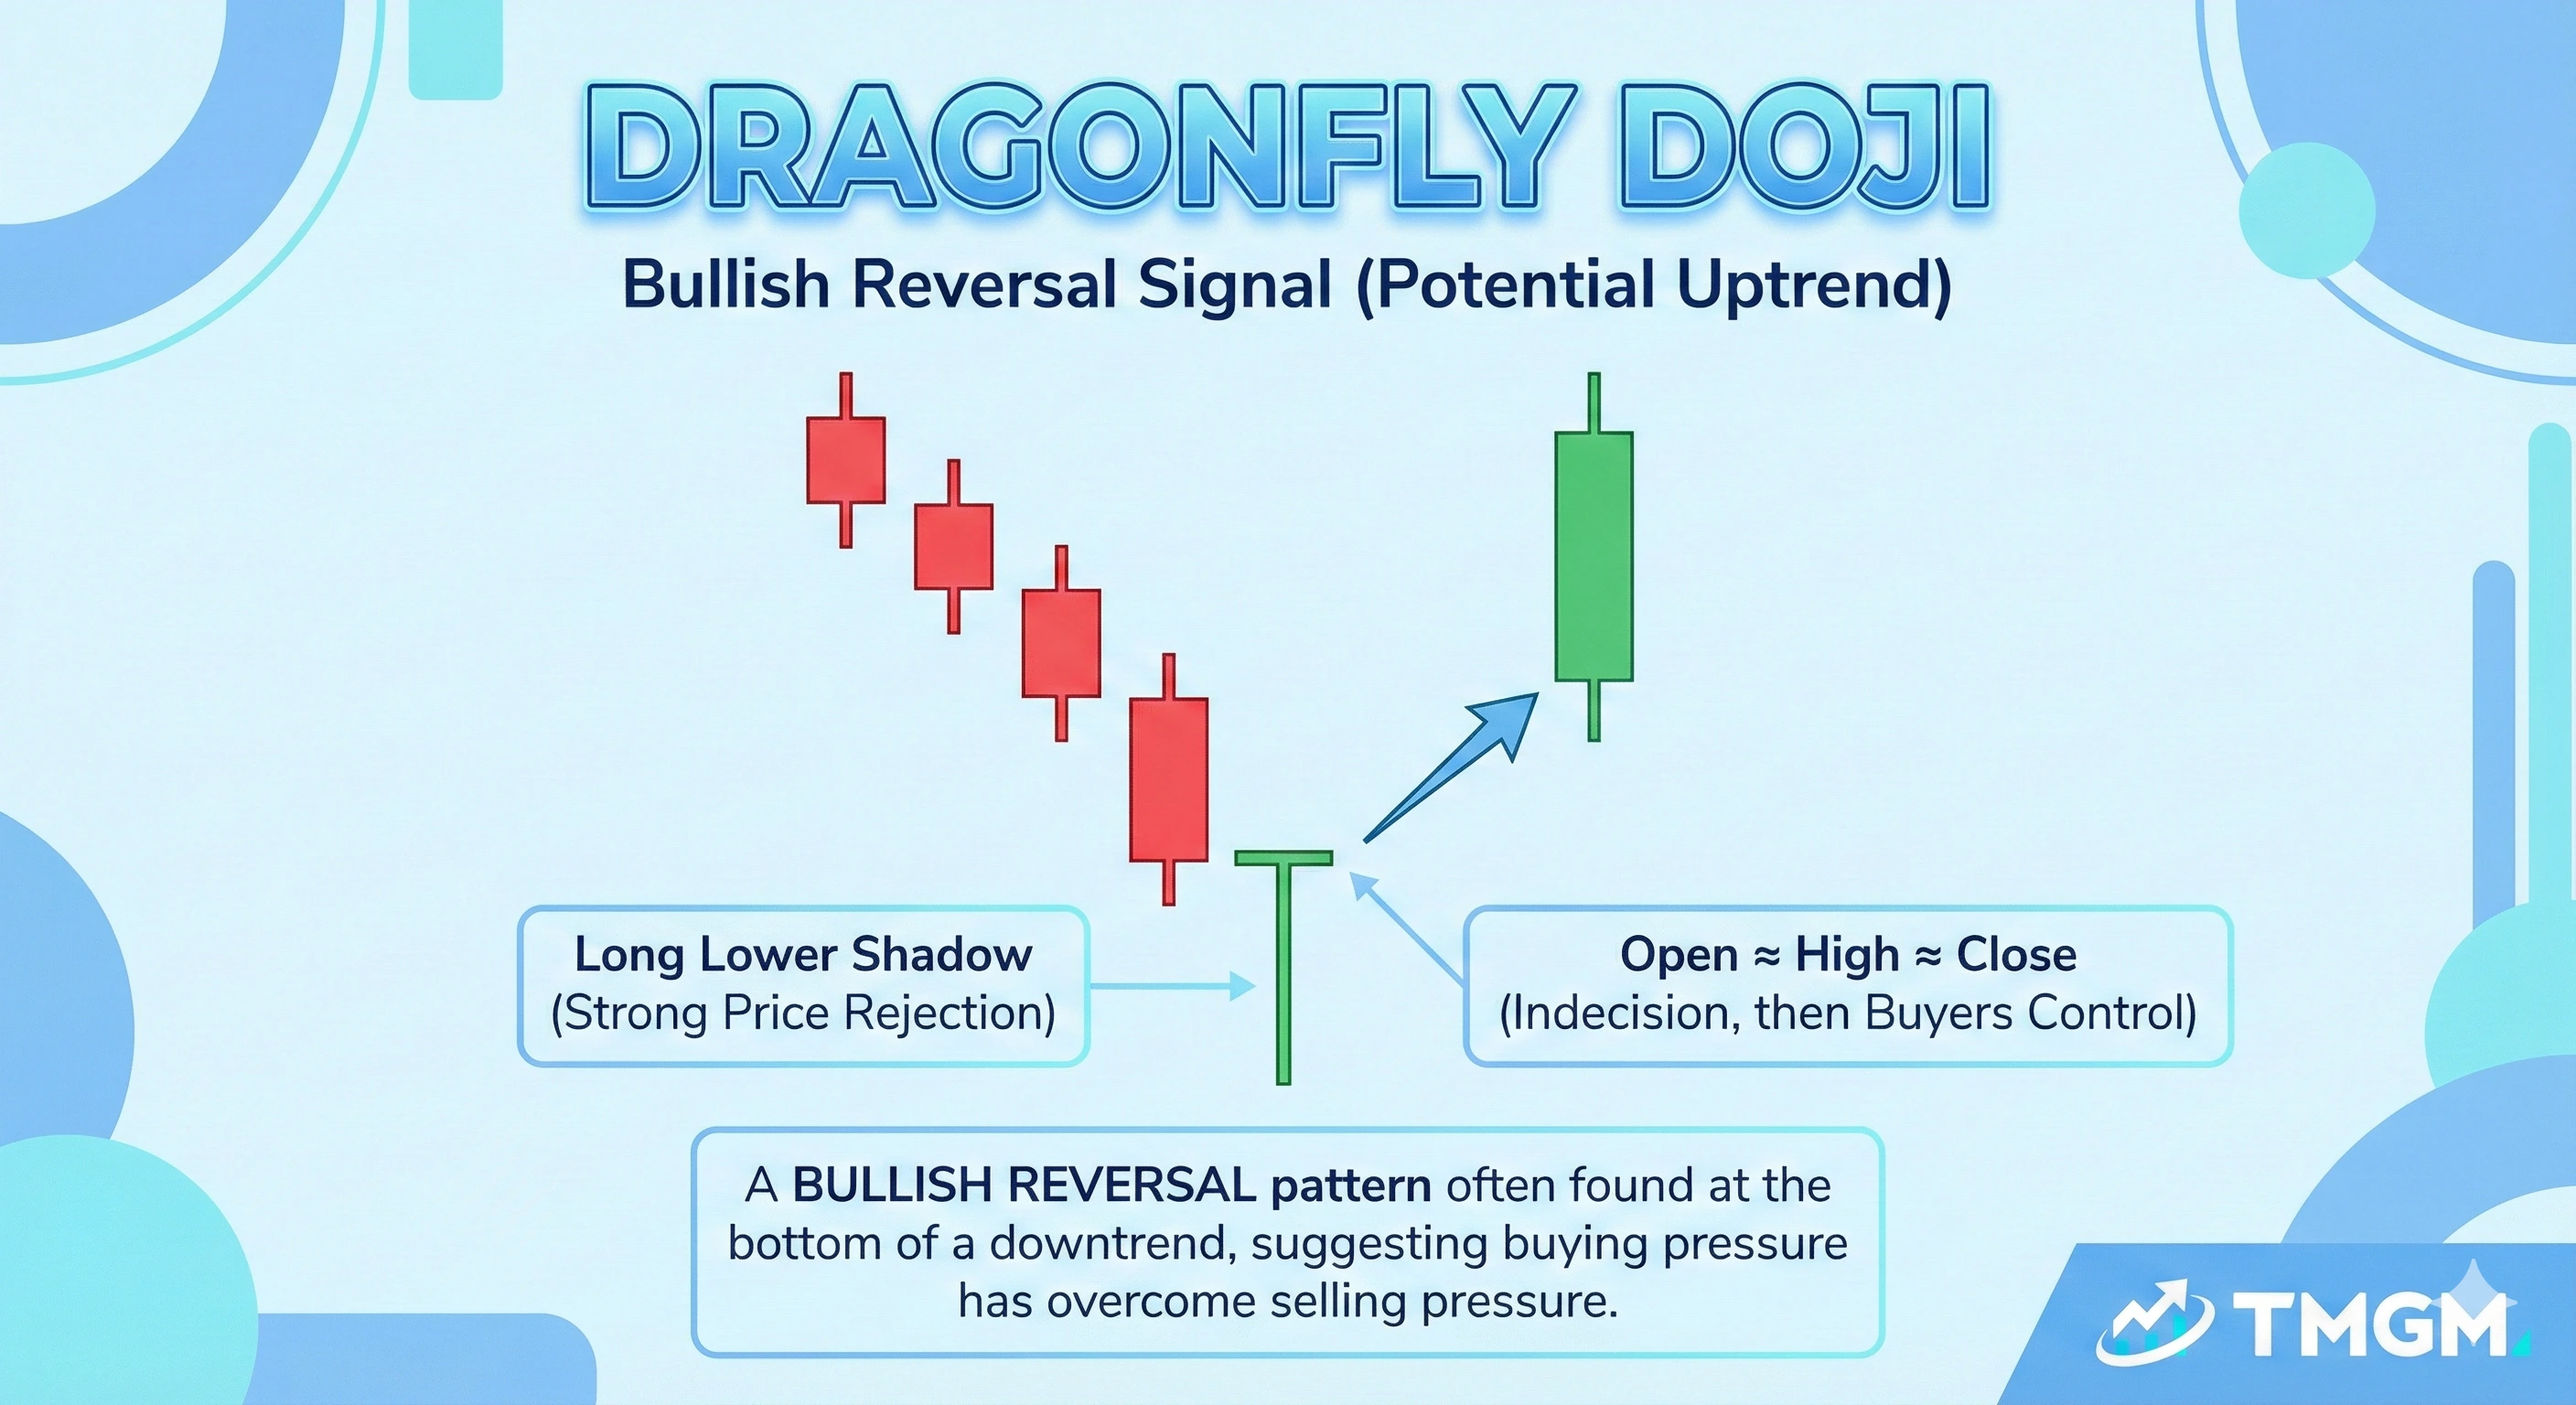
Dragonfly Doji Candlestick
Long lower wick with a close near the high, reads like lower price rejection but still needs confirmation.
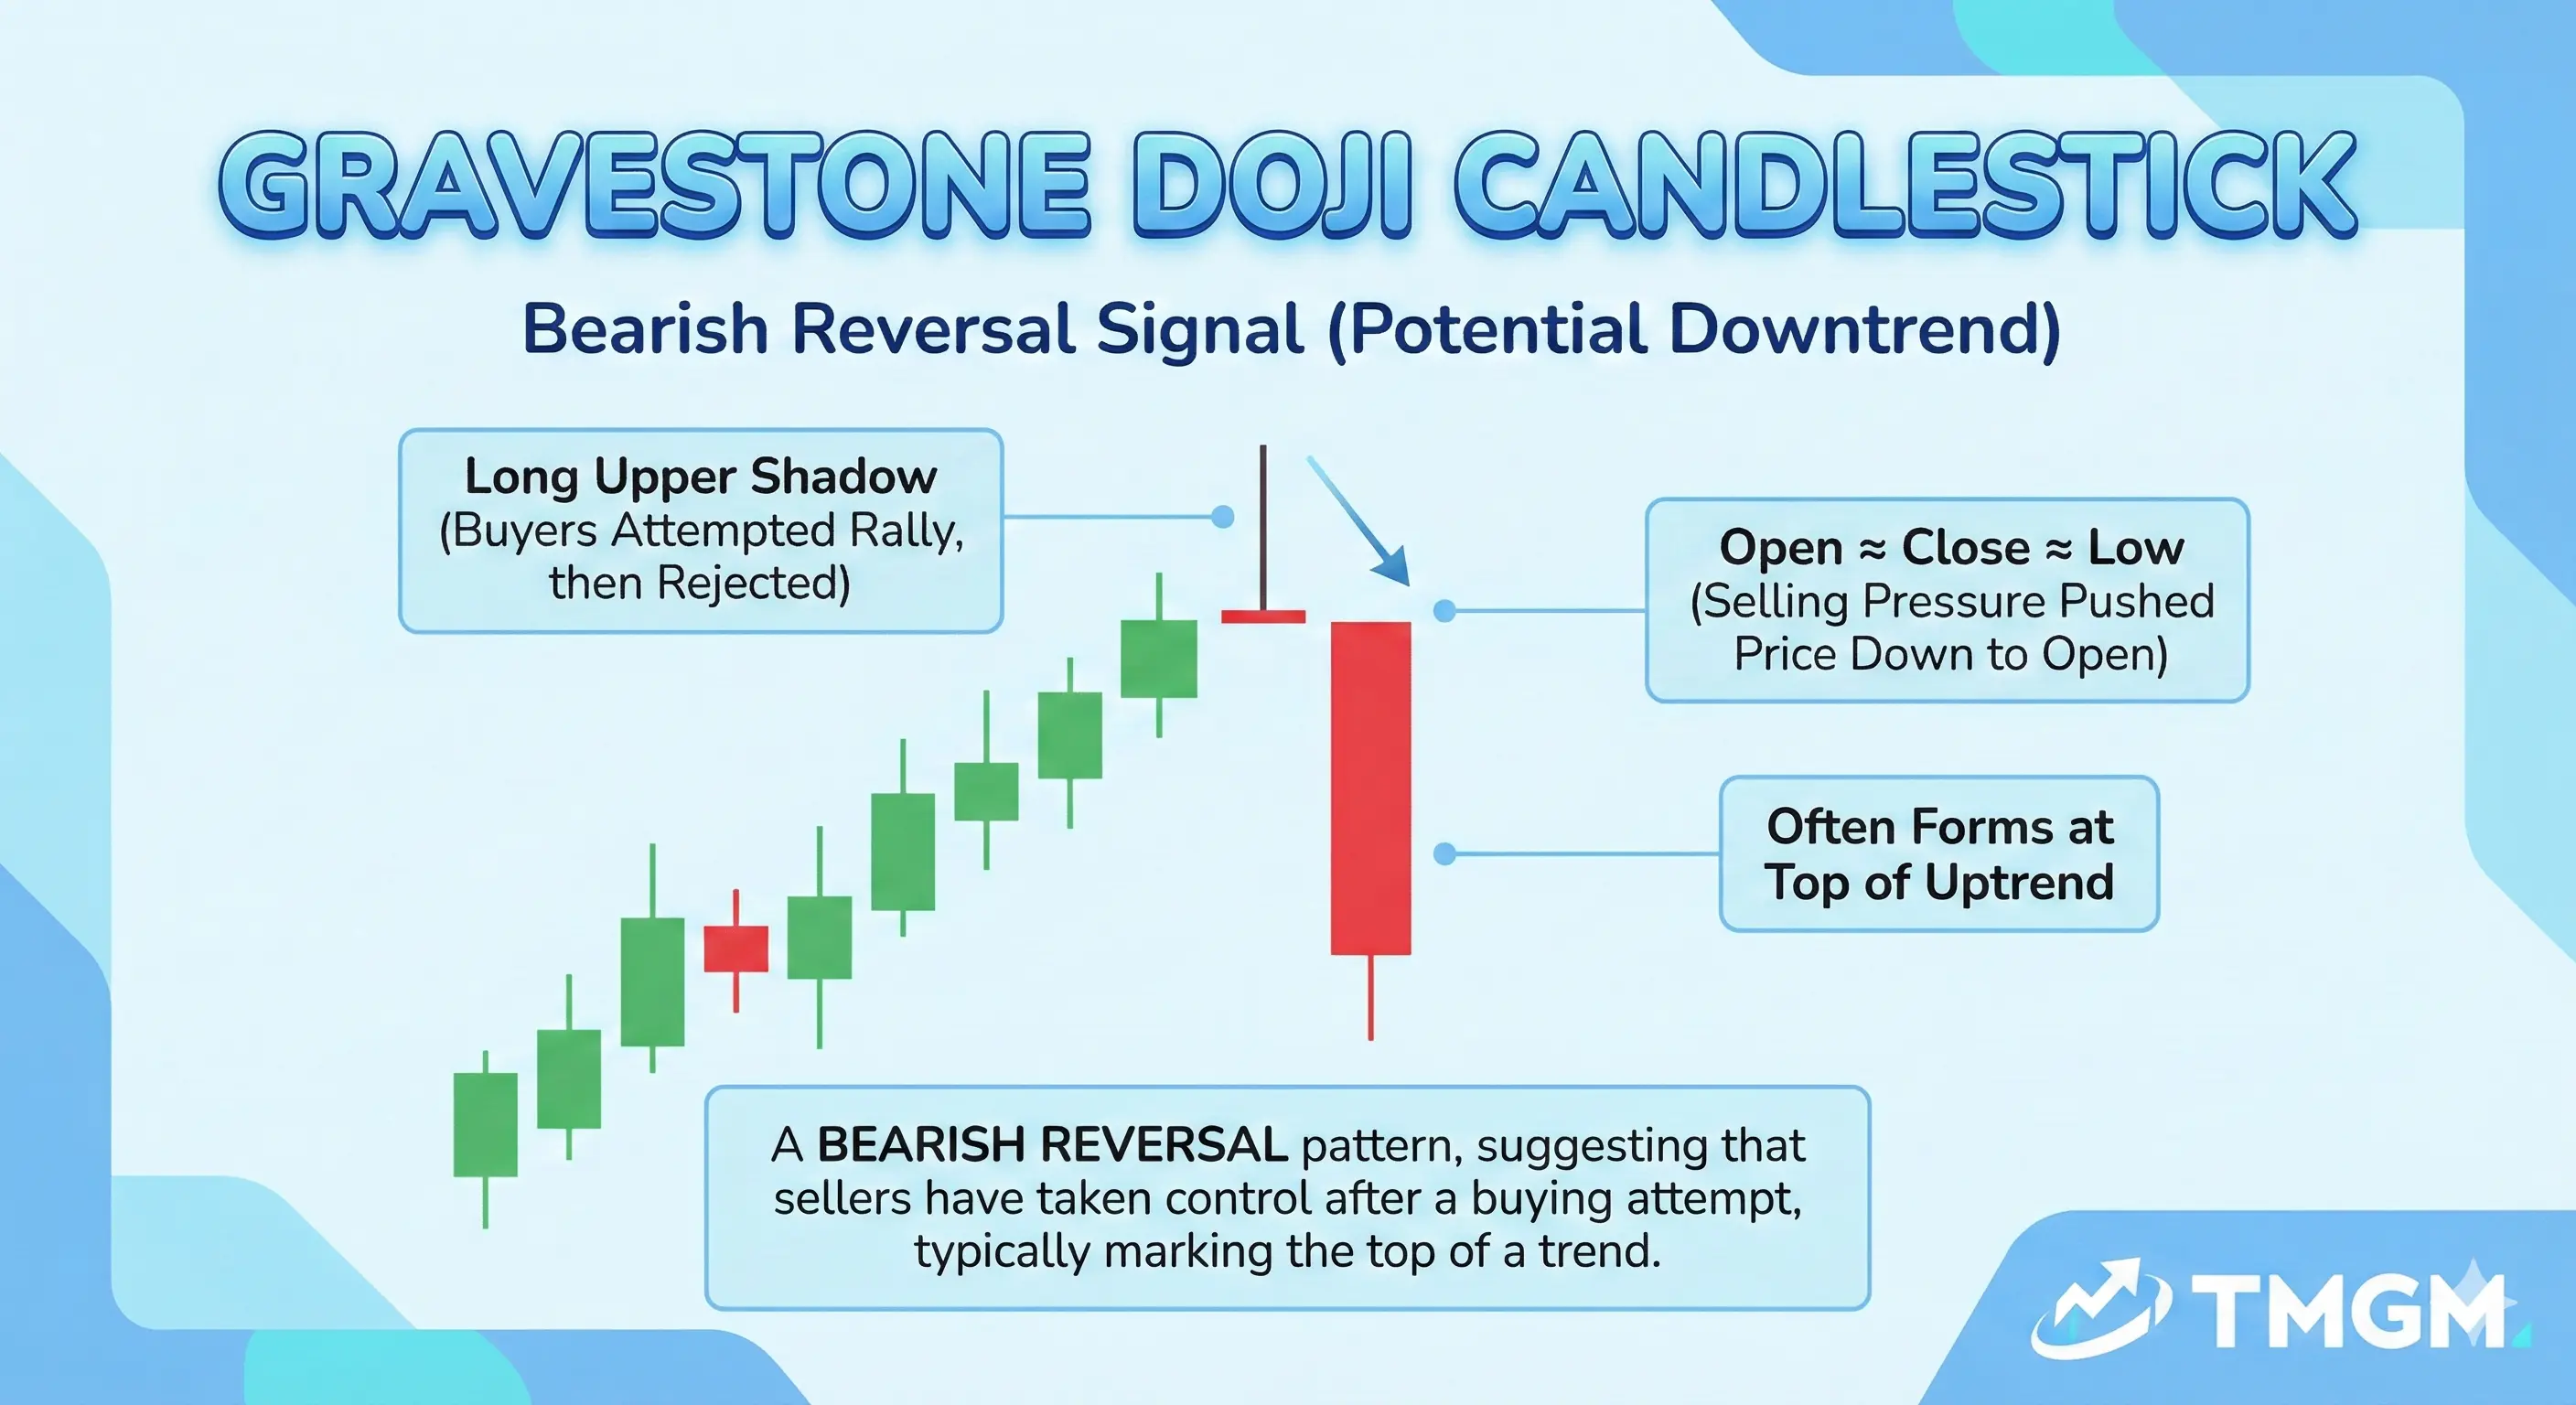
Gravestone Doji
Long upper wick with a close near the low, reads like higher price rejection but still needs confirmation.
Hammer Candlestick Pattern
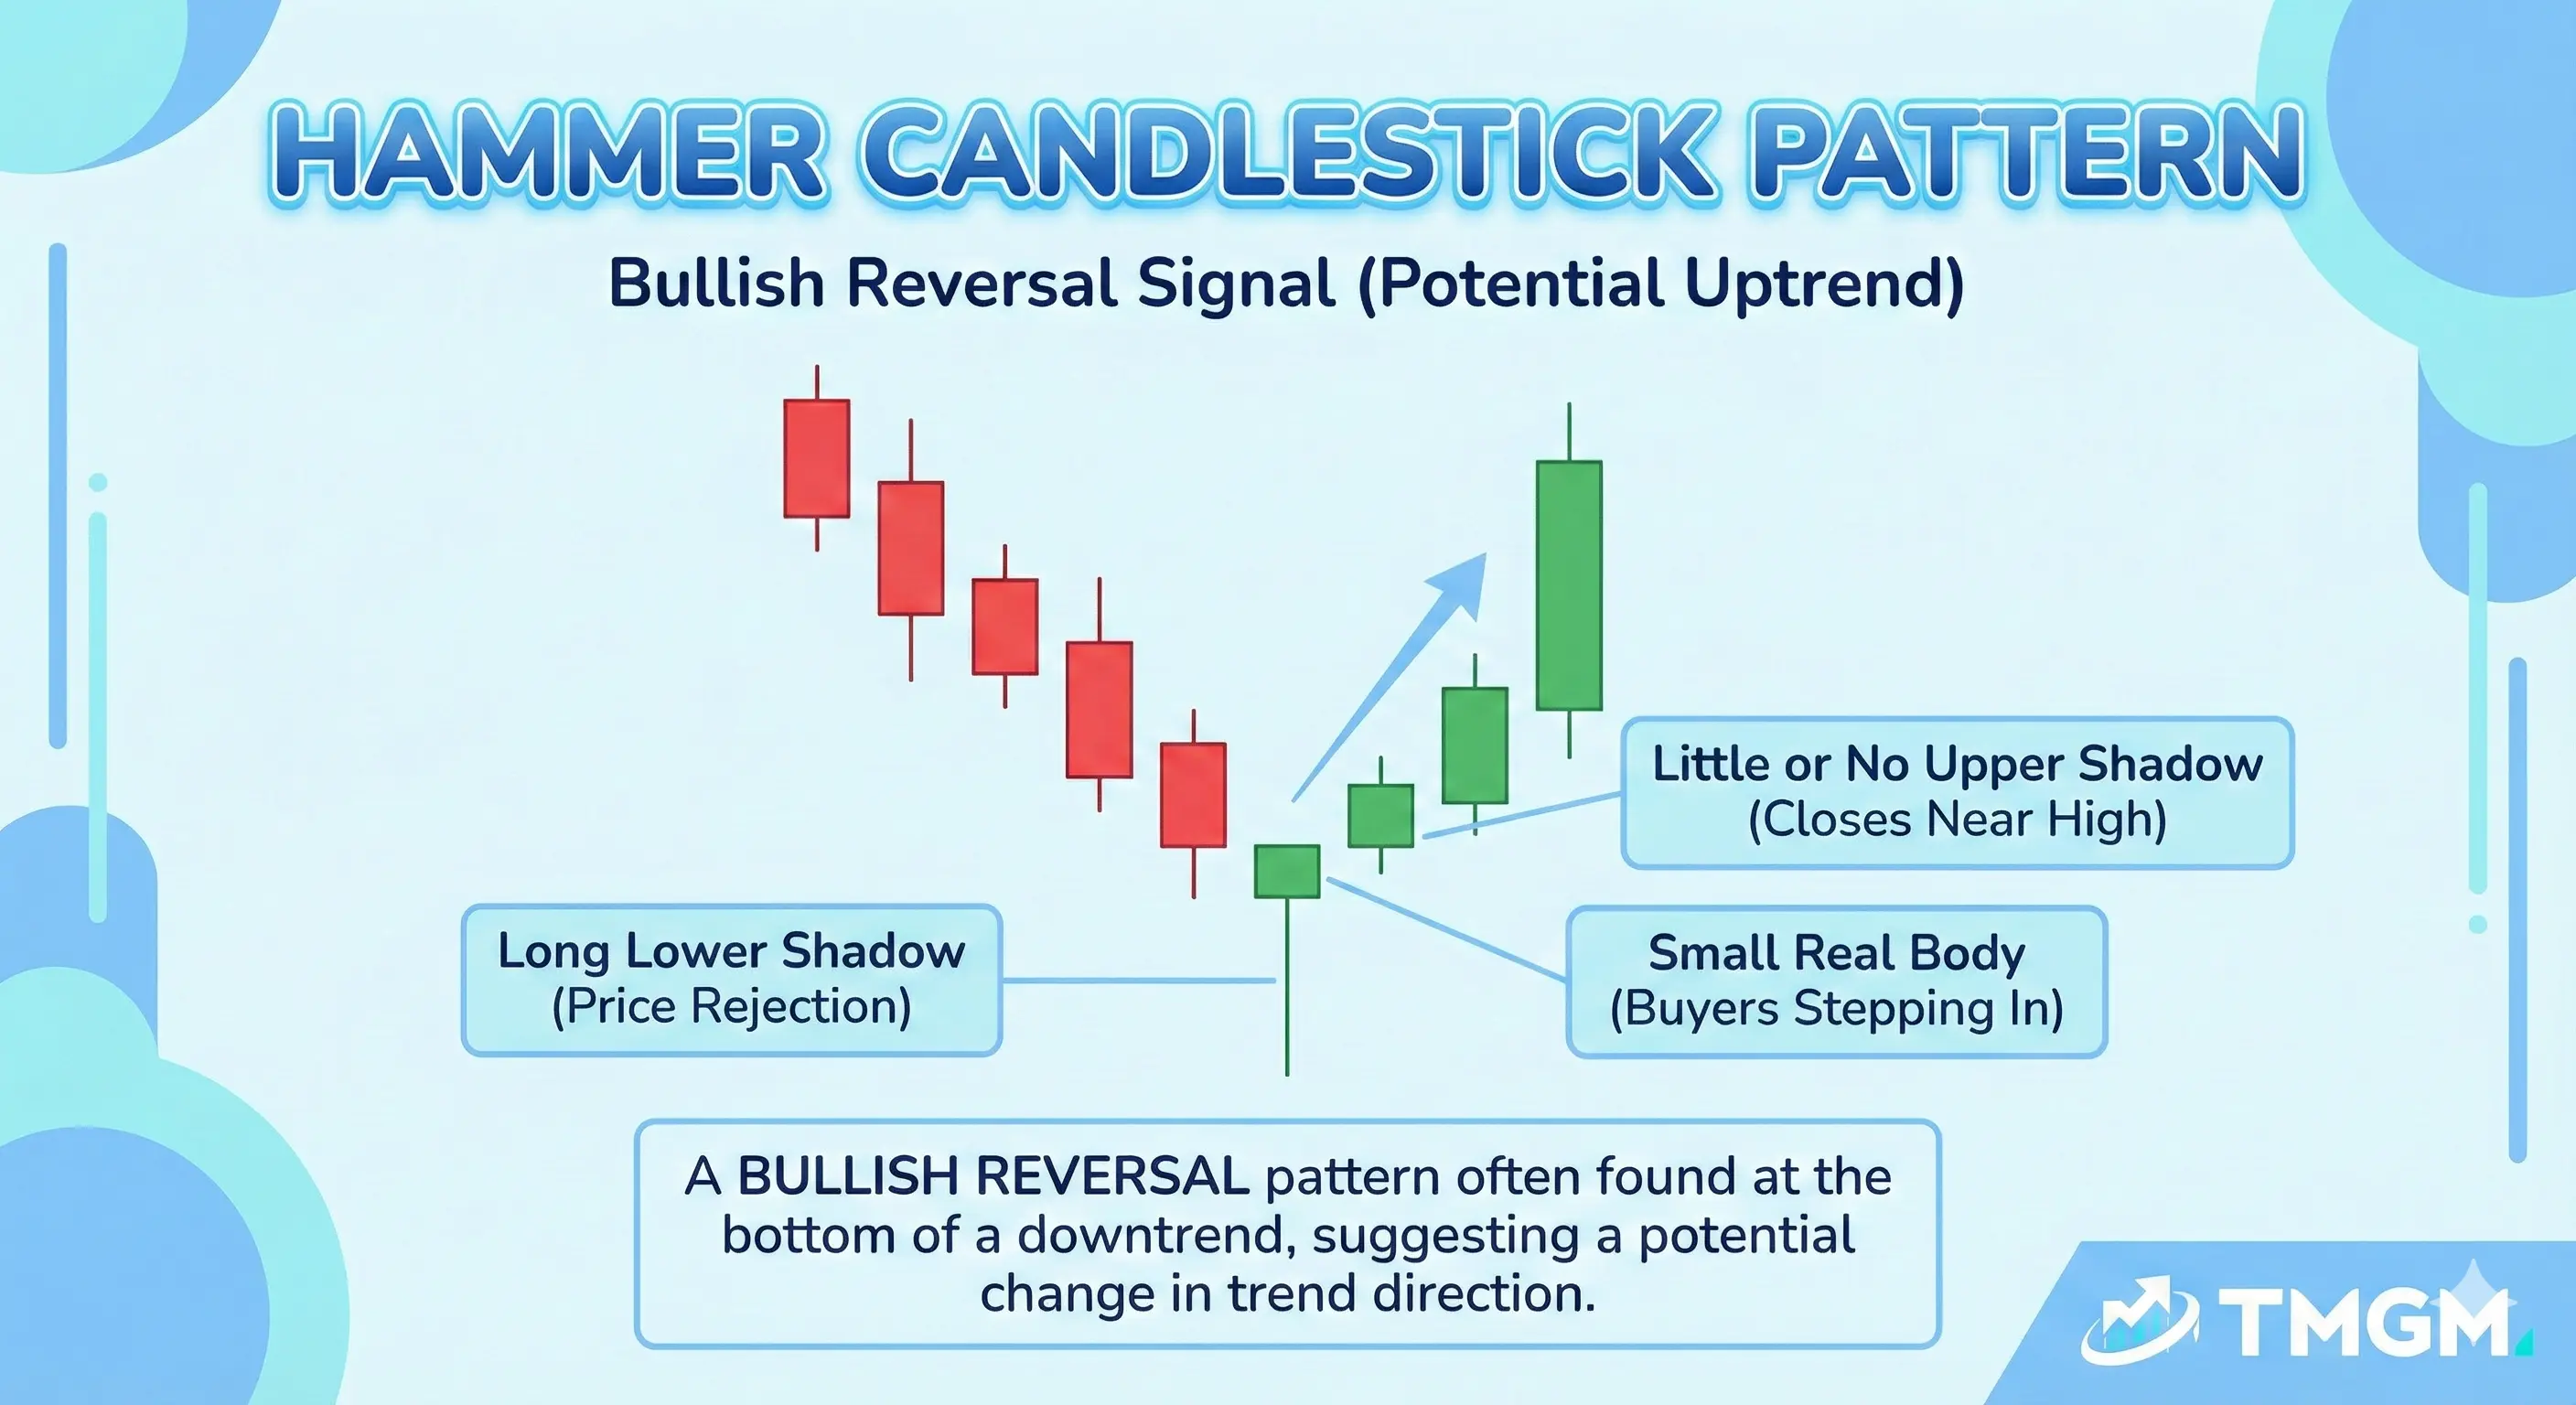
This is a bullish reversal candlestick pattern. It has a small body near the top of the range with a long lower wick, showing sellers drove price down but buyers absorbed the move and reclaimed control into the close. It is most reliable after a decline and near support, where a failed breakdown can trap late sellers. It is confirmed when the next candle closes higher, ideally breaking and closing above the hammer high.
Hammer Candlestick Variations
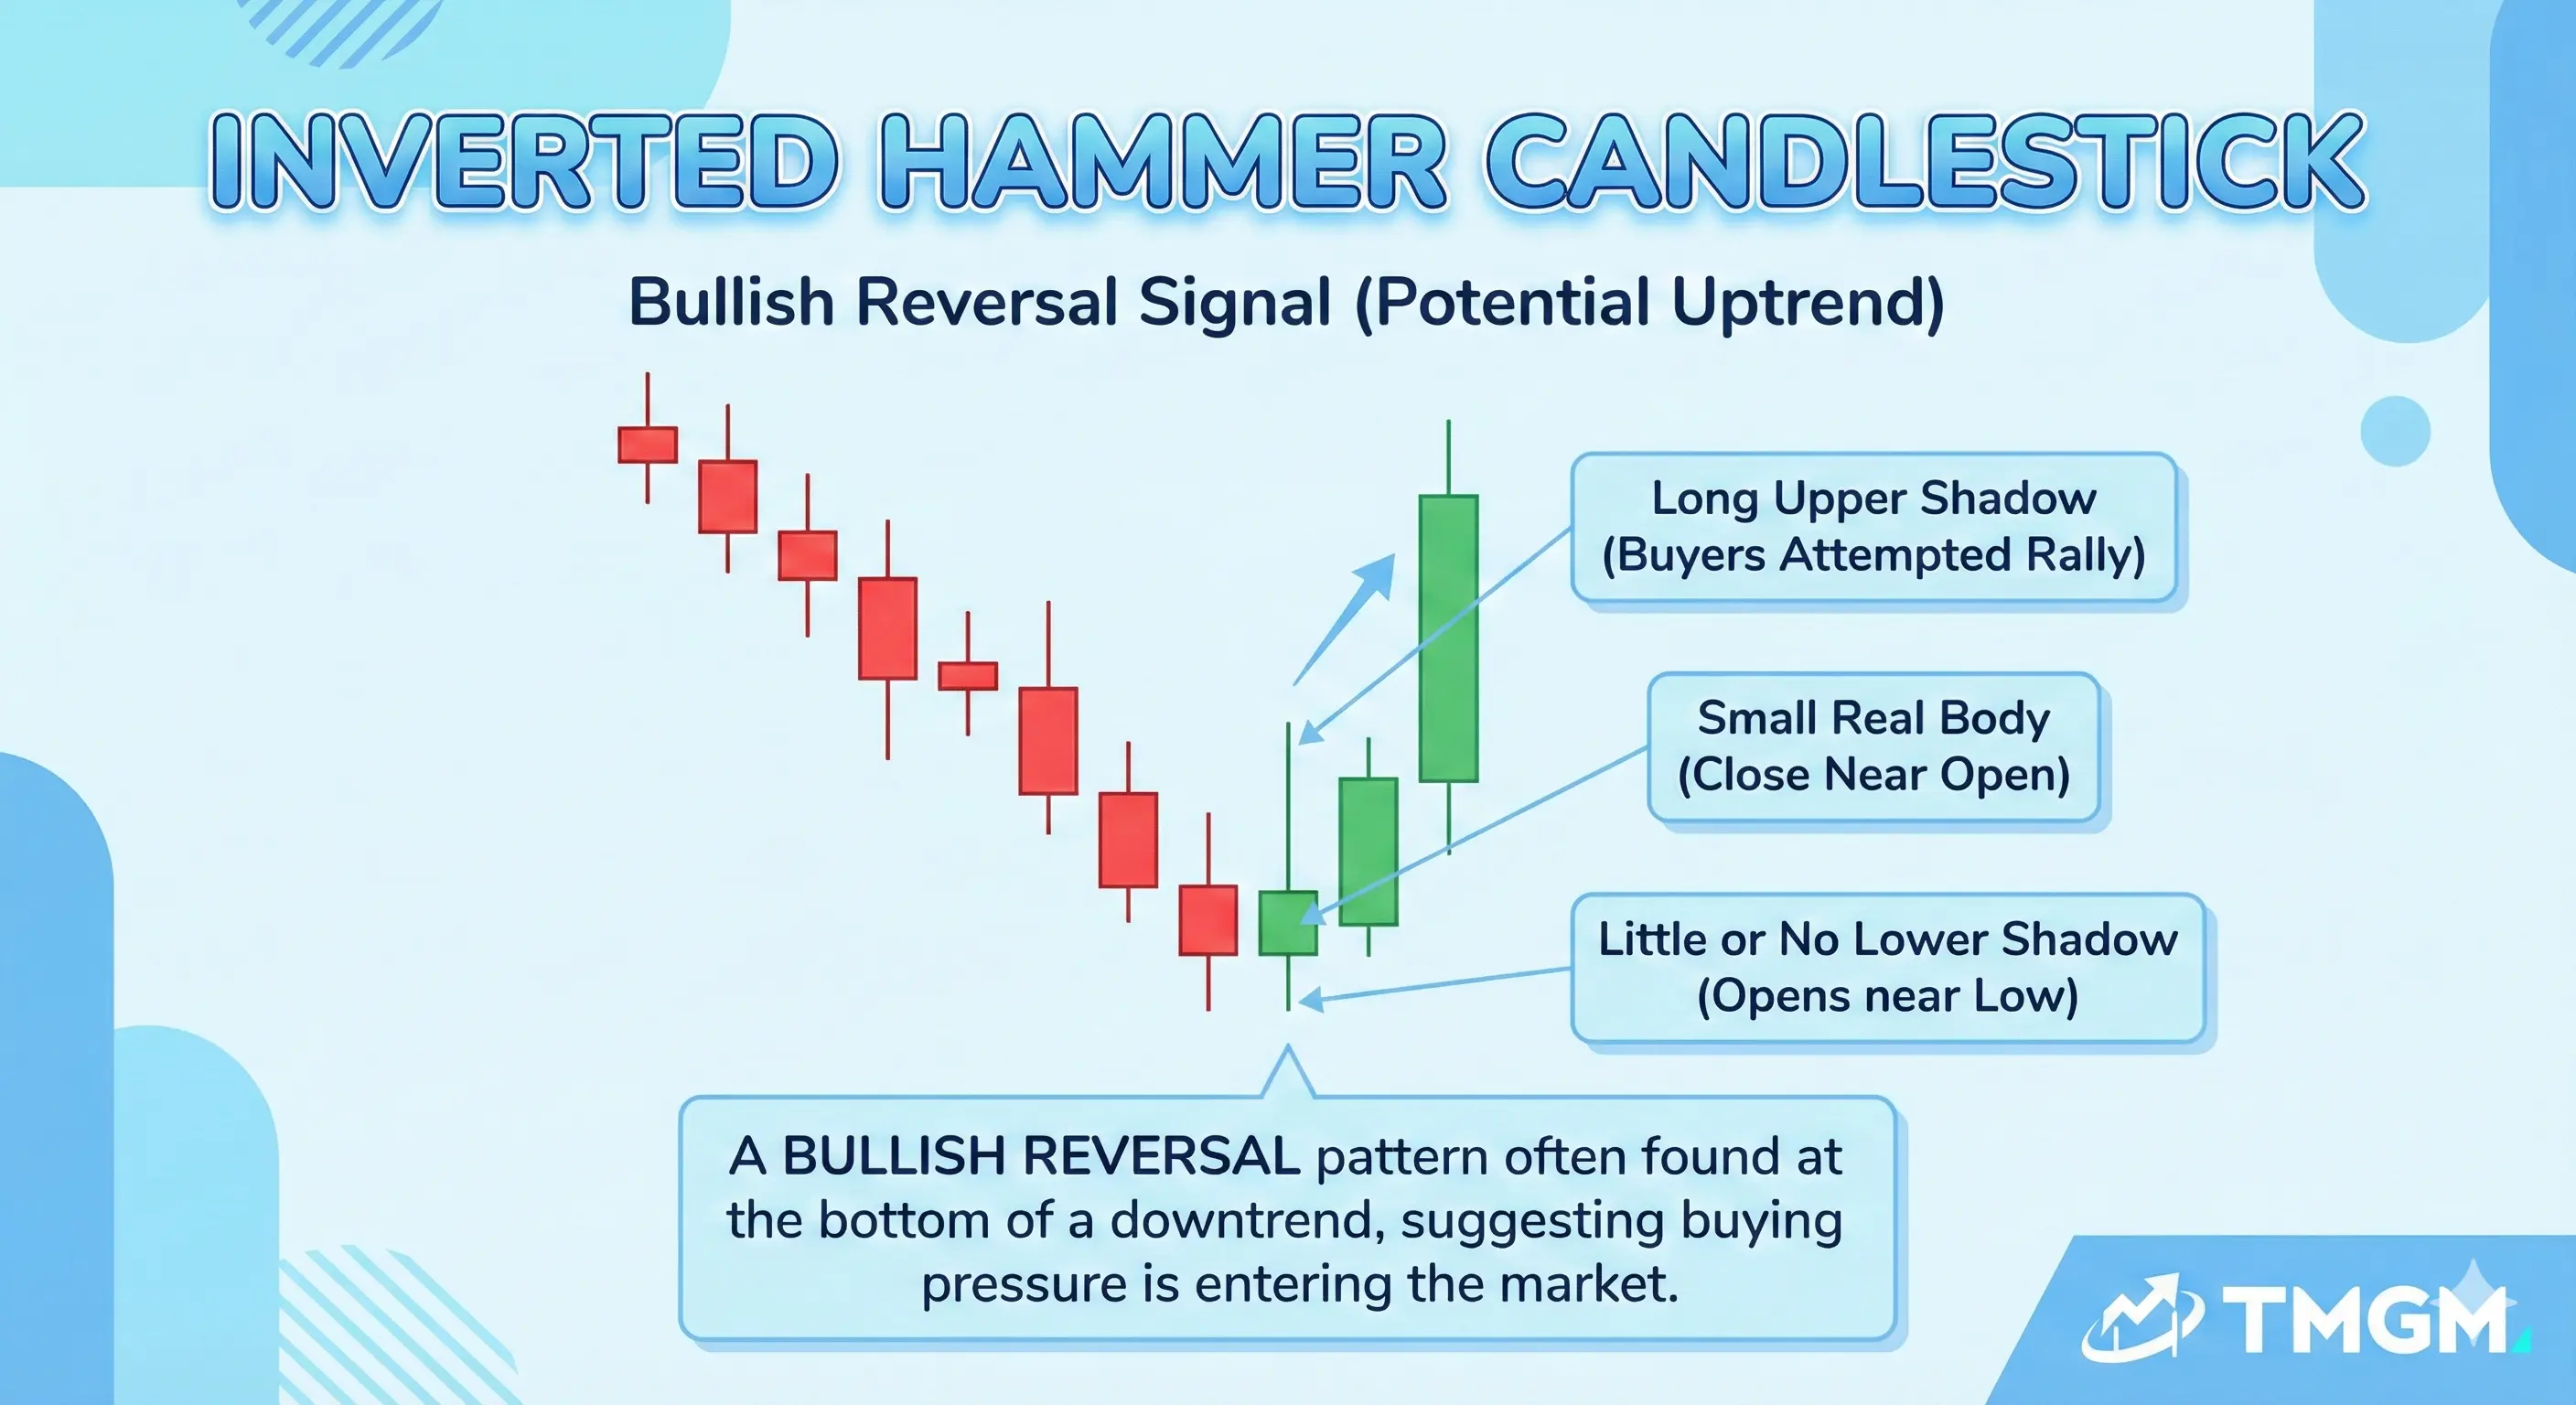
Inverted hammer candlestick: Can be bullish after a downtrend because it shows buyers forcing an upside probe and rejection from below, even if confirmation is still require
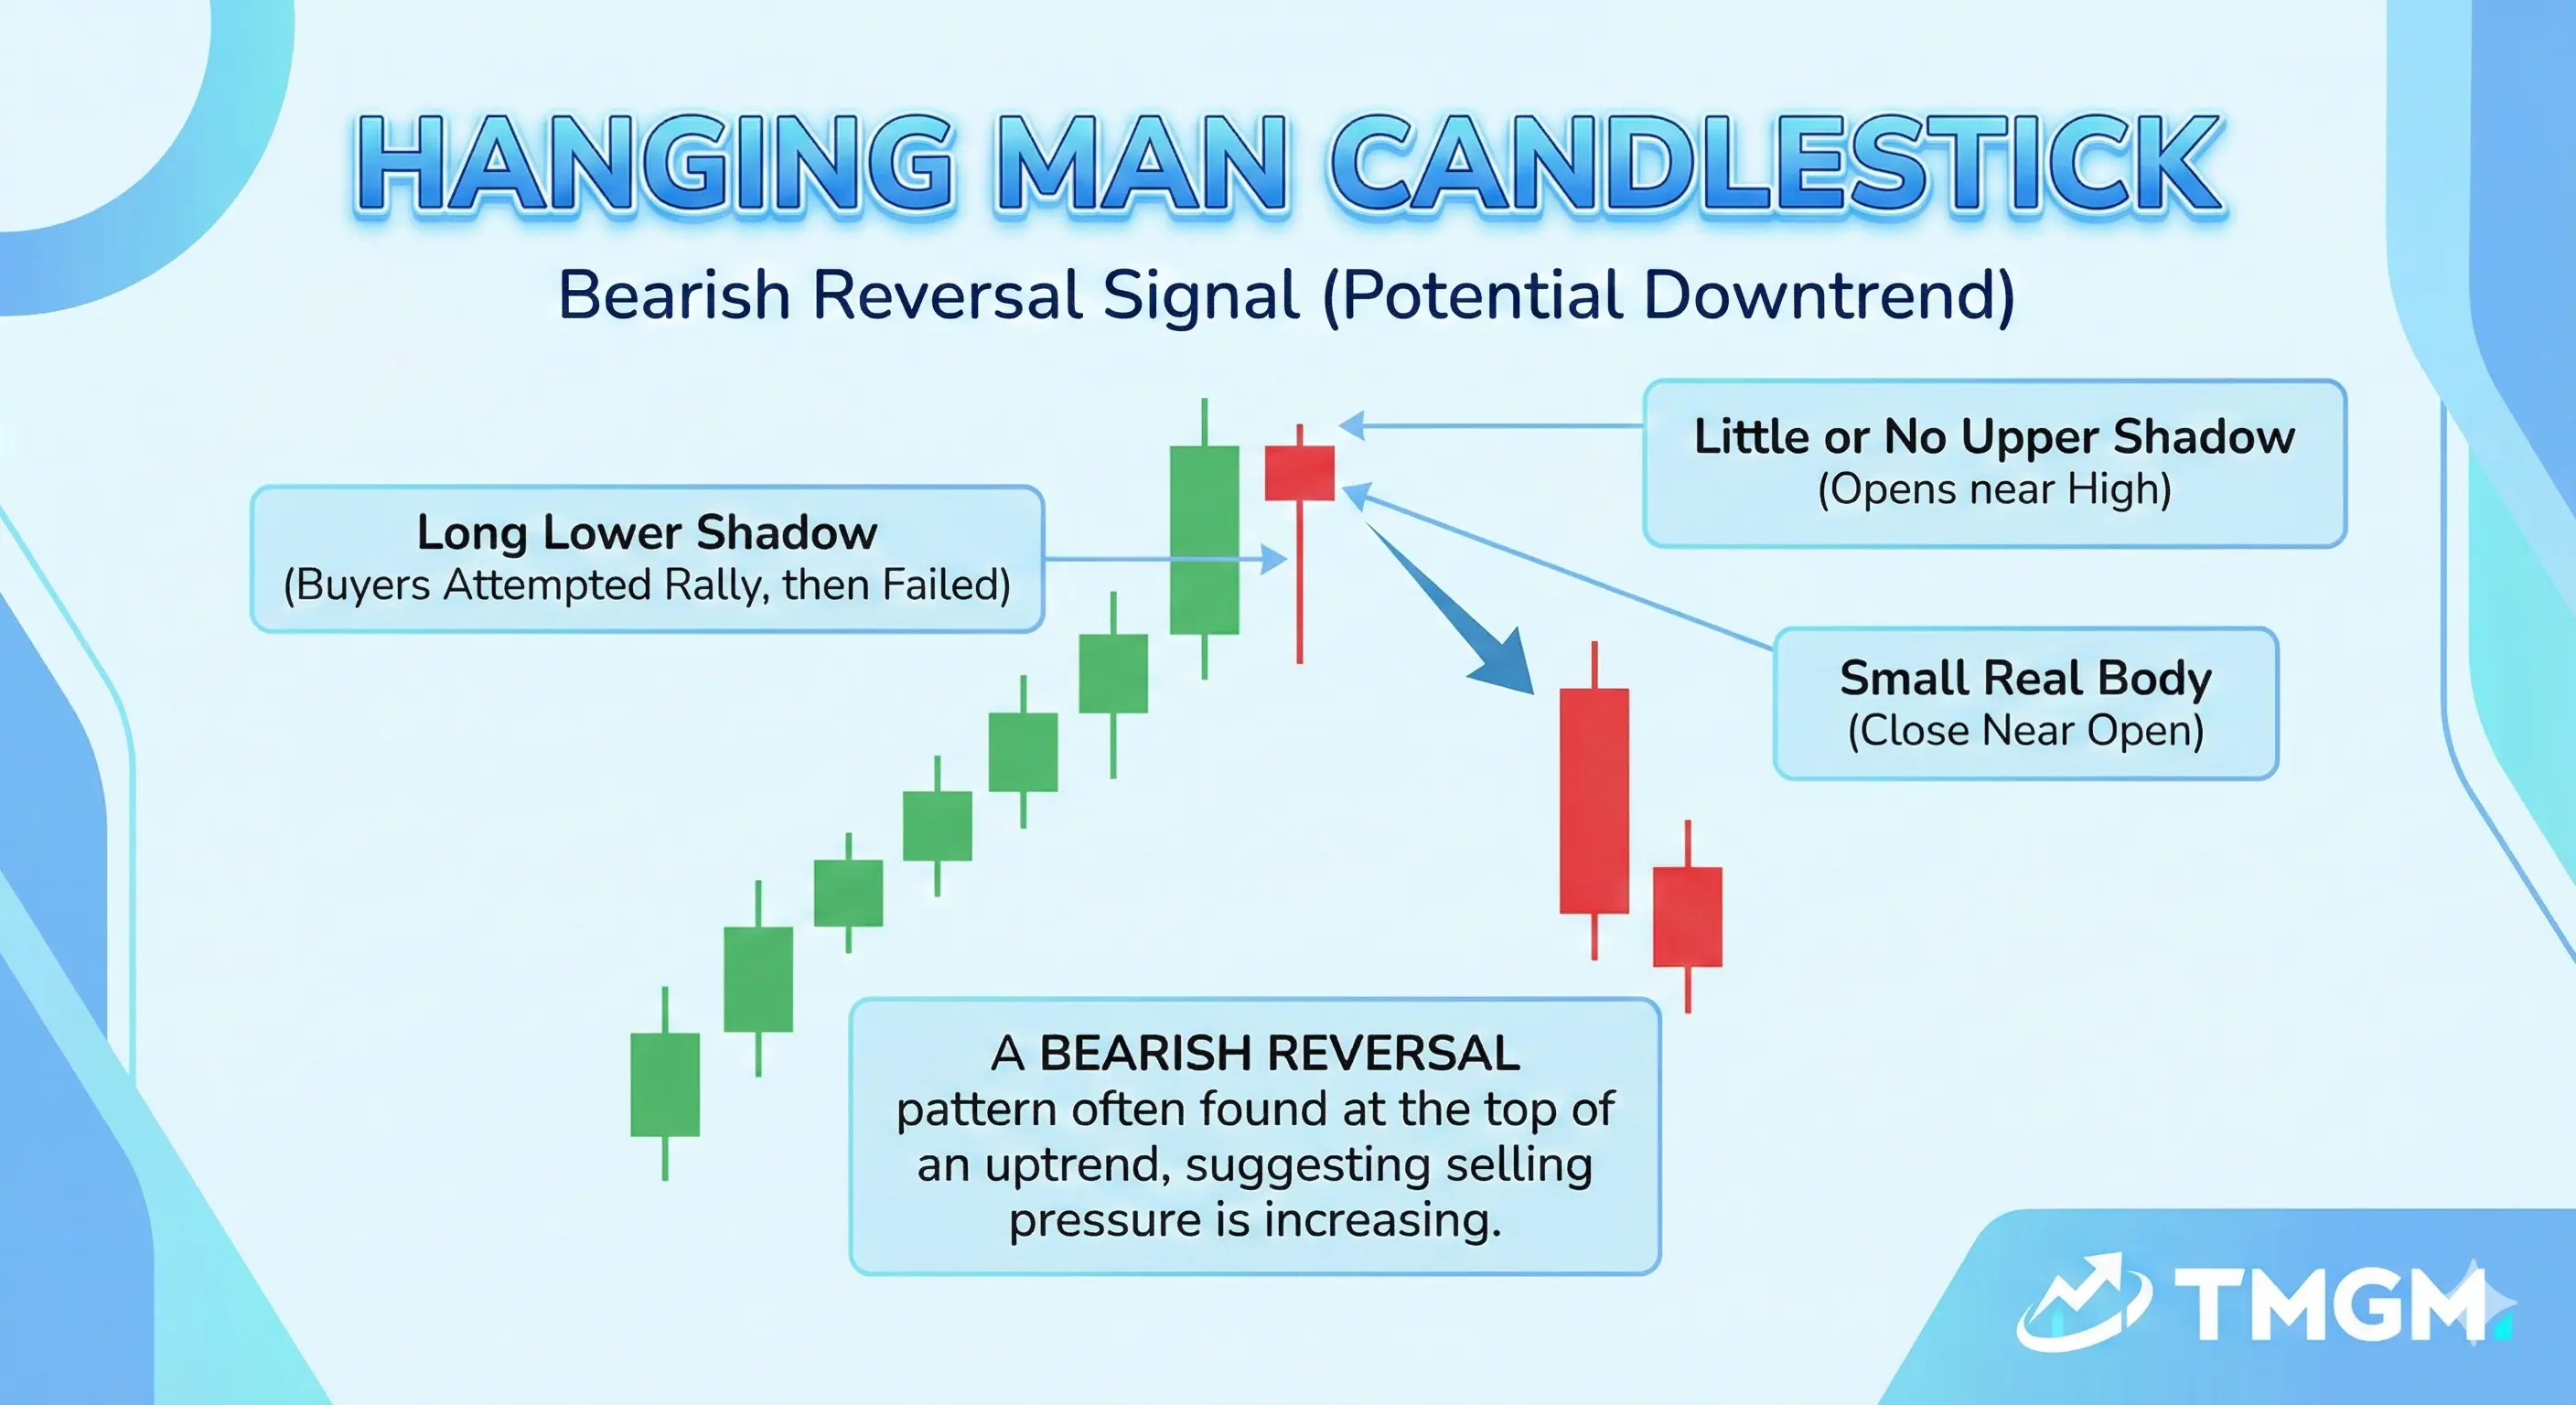
Hanging man candlestick: Same shape as a hammer, but becomes a bearish warning after an uptrend because it shows sellers could press price lower intraday, even if buyers recovered some ground by the close.
Shooting Star Candlestick
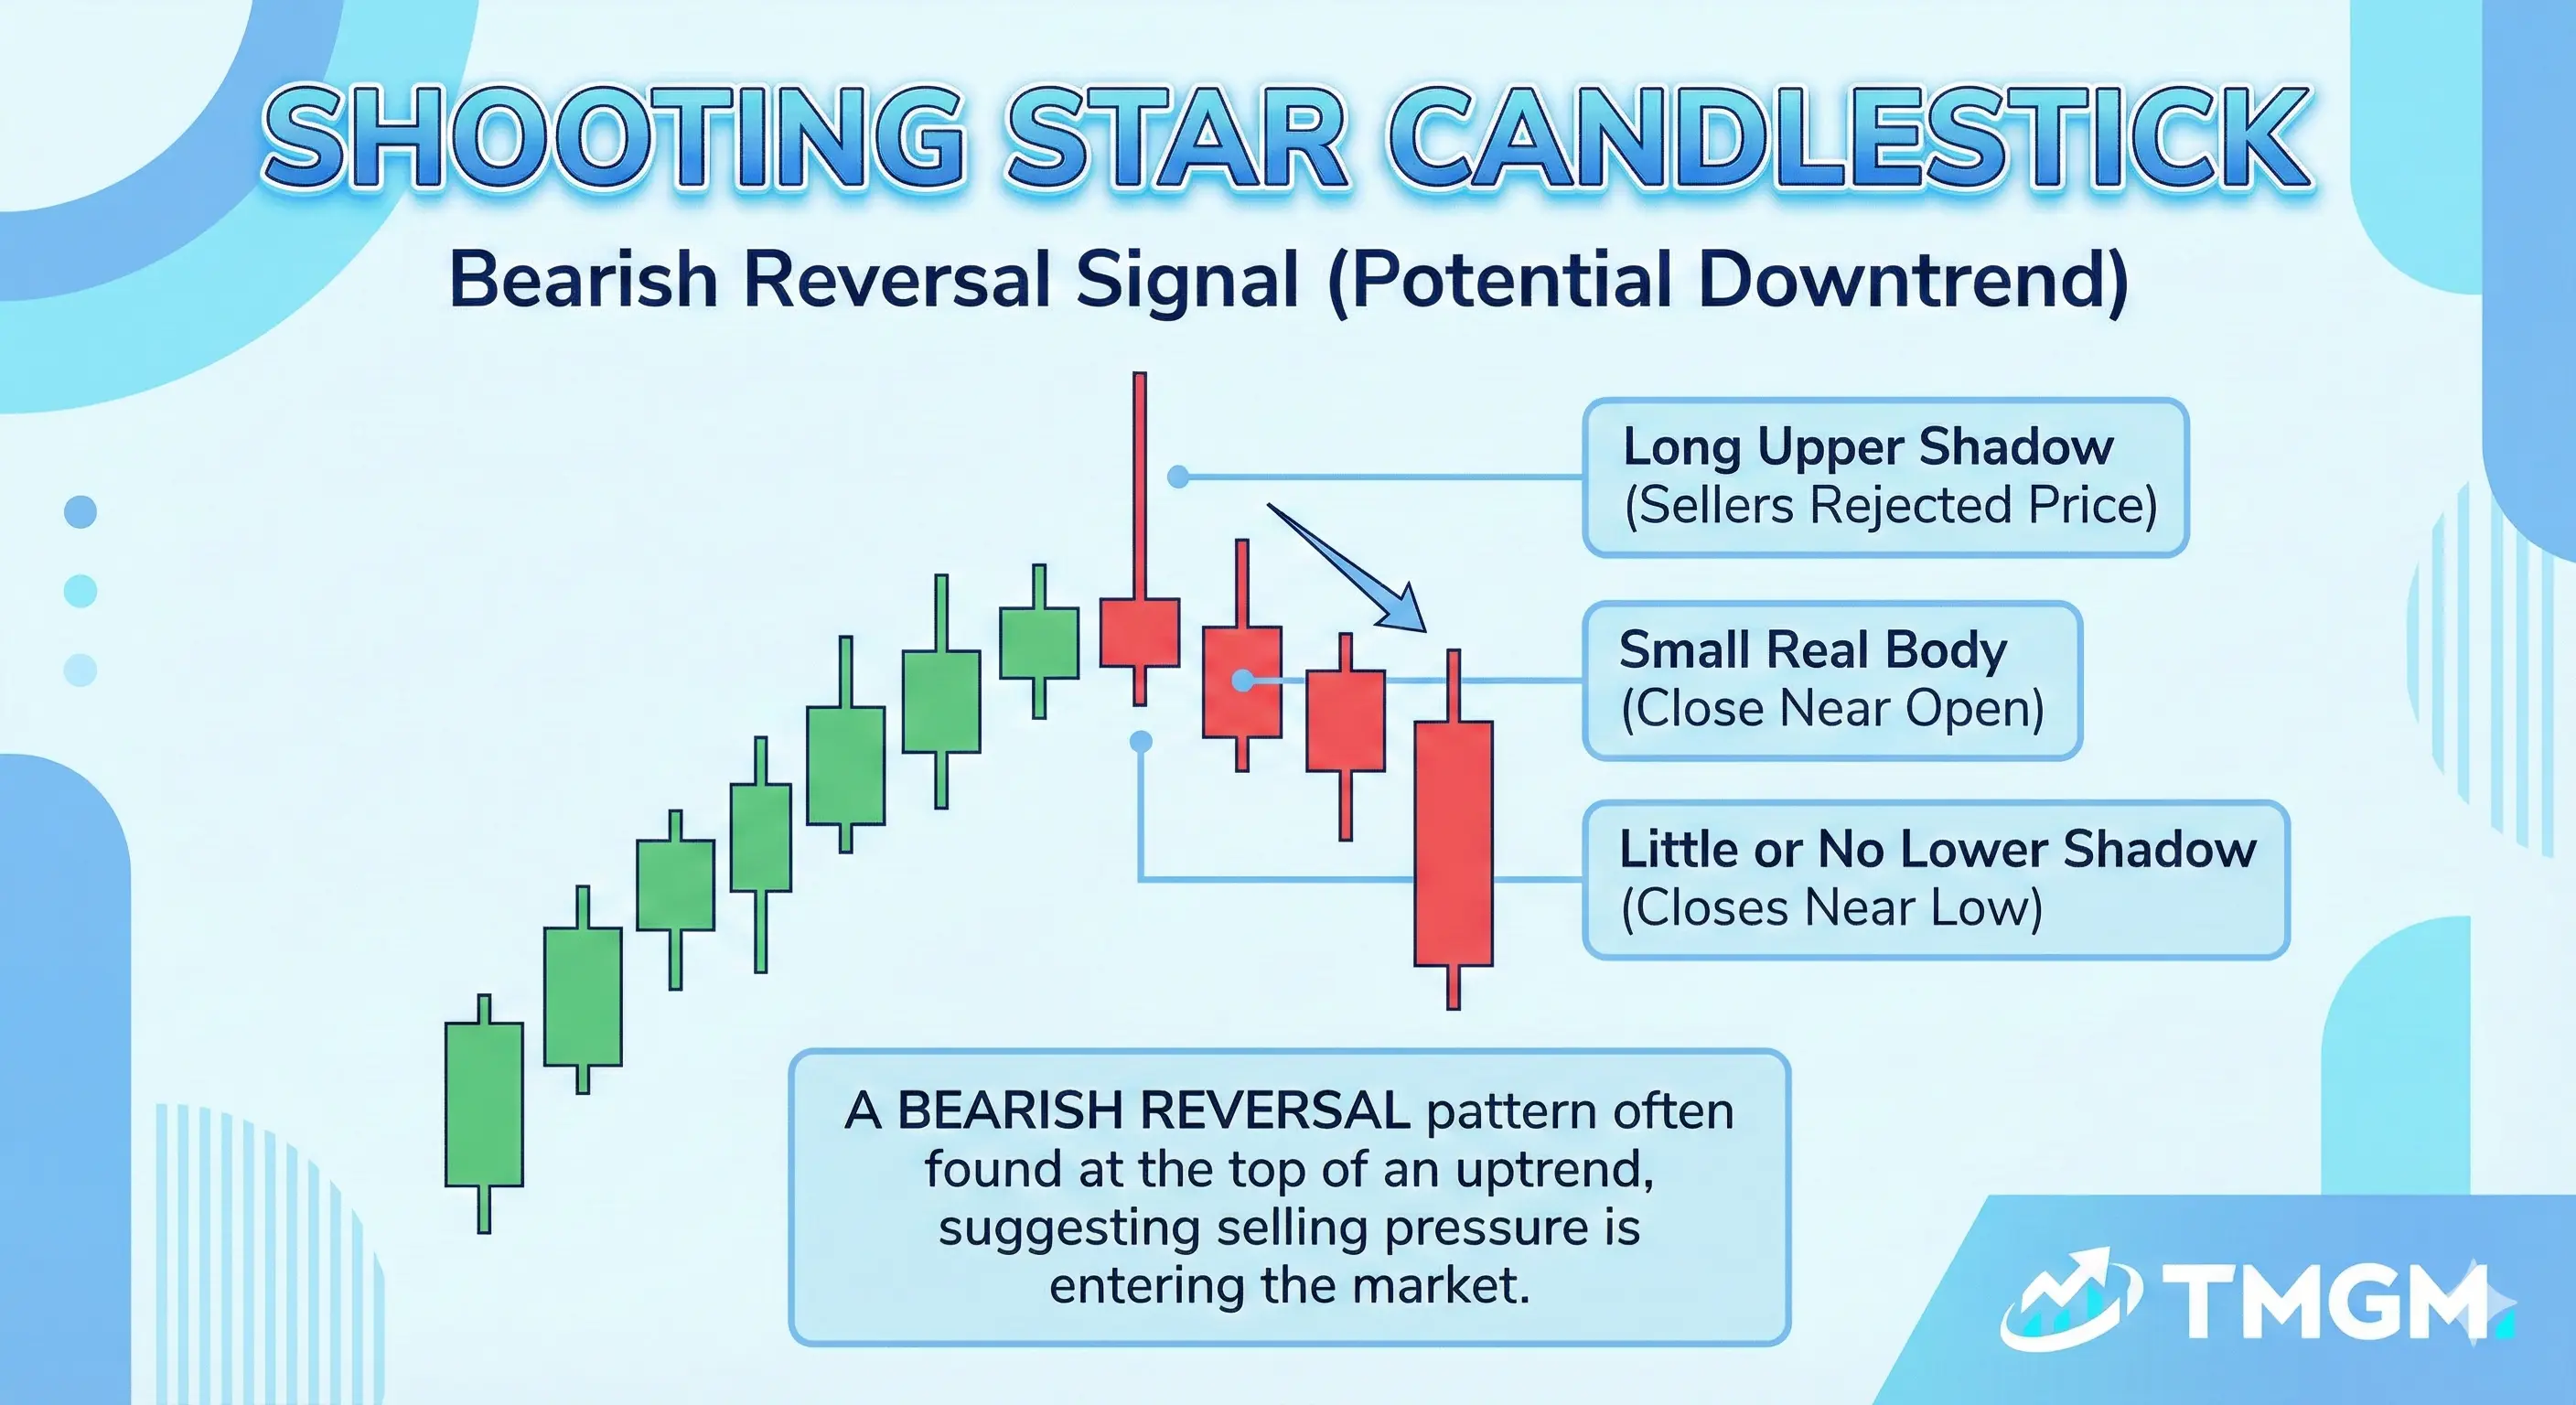
This is a bearish reversal candlestick pattern. It forms with a small body near the low and a long upper wick, showing buyers pushed higher but sellers rejected the high and forced a weak close. It is most reliable after an uptrend and near resistance, especially after a fast run up. It is confirmed when the next candle closes lower, ideally breaking and closing below the shooting star low.
The shooting star candlestick pattern is strongest when it forms after an uptrend because it shows buyers losing the ability to keep control into the close. A shooting star in the middle of chop is often just noise and should be treated as indecision, not a reversal.
Marubozu Candle
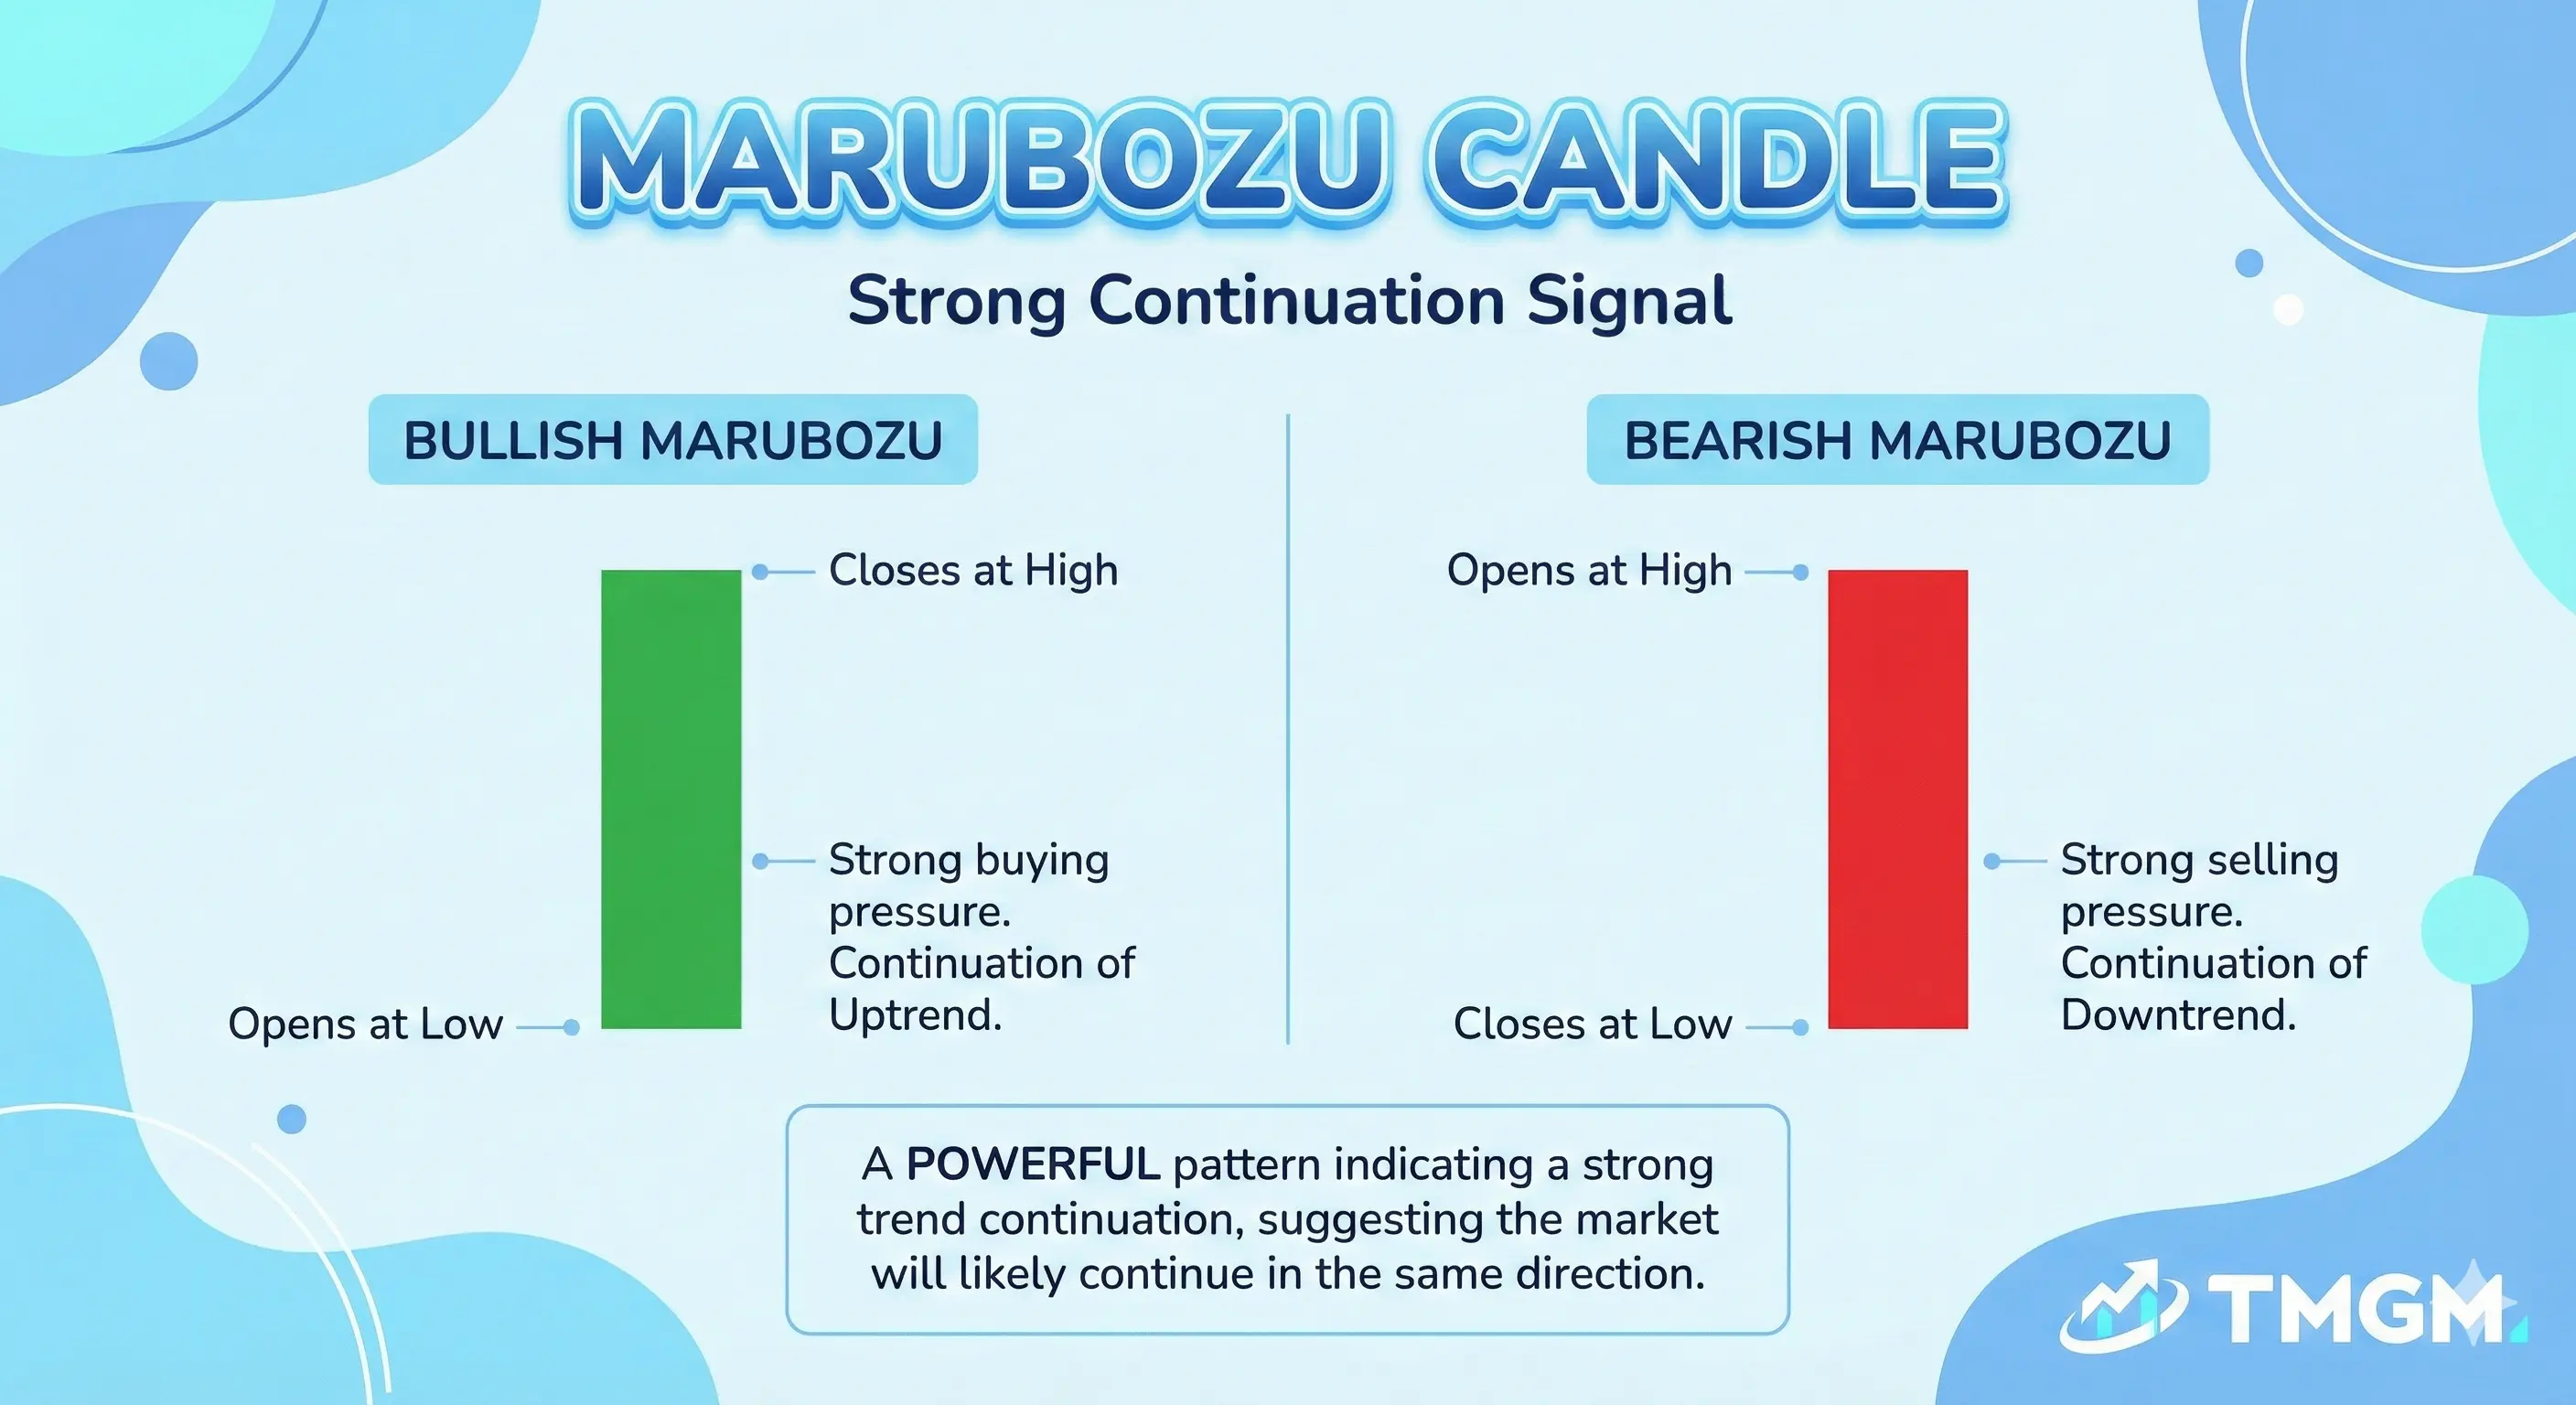
This is a trend continuation candlestick pattern most of the time. It prints as a large real body with little to no wicks, showing one side controlled the open to close auction with minimal rejection and strong close dominance. It is most reliable early in a trend, on a breakout with room to run, or after consolidation where imbalance can persist. It is confirmed by follow through closes in the same direction, but if it appears into a major level after an extended move it can signal exhaustion, so you still want the market to hold above or below that level on subsequent closes.
A marubozu often signals continuation rather than reversal, because clean dominance tends to persist. But if a marubozu prints into a major level after an extended move, it can be exhaustion, so location decides whether it is strength or a late move.
Pro Tip: The most reliable single candle reads come from where it closes relative to a level, not from the candle shape in isolation.
Brief mention
A spinning top candlestick has a small body with upper and lower wicks, showing a tug of war and a stall in momentum. A spinning top candlestick pattern is most useful as a “pause” candle that needs the next close to choose direction.
Double Candlestick Patterns
Two candle patterns can show a clearer shift in control because they compare one session’s conviction against the next session’s response. This makes them better at separating a pause from a true takeover in trading candlestick patterns.
Harami candlestick pattern
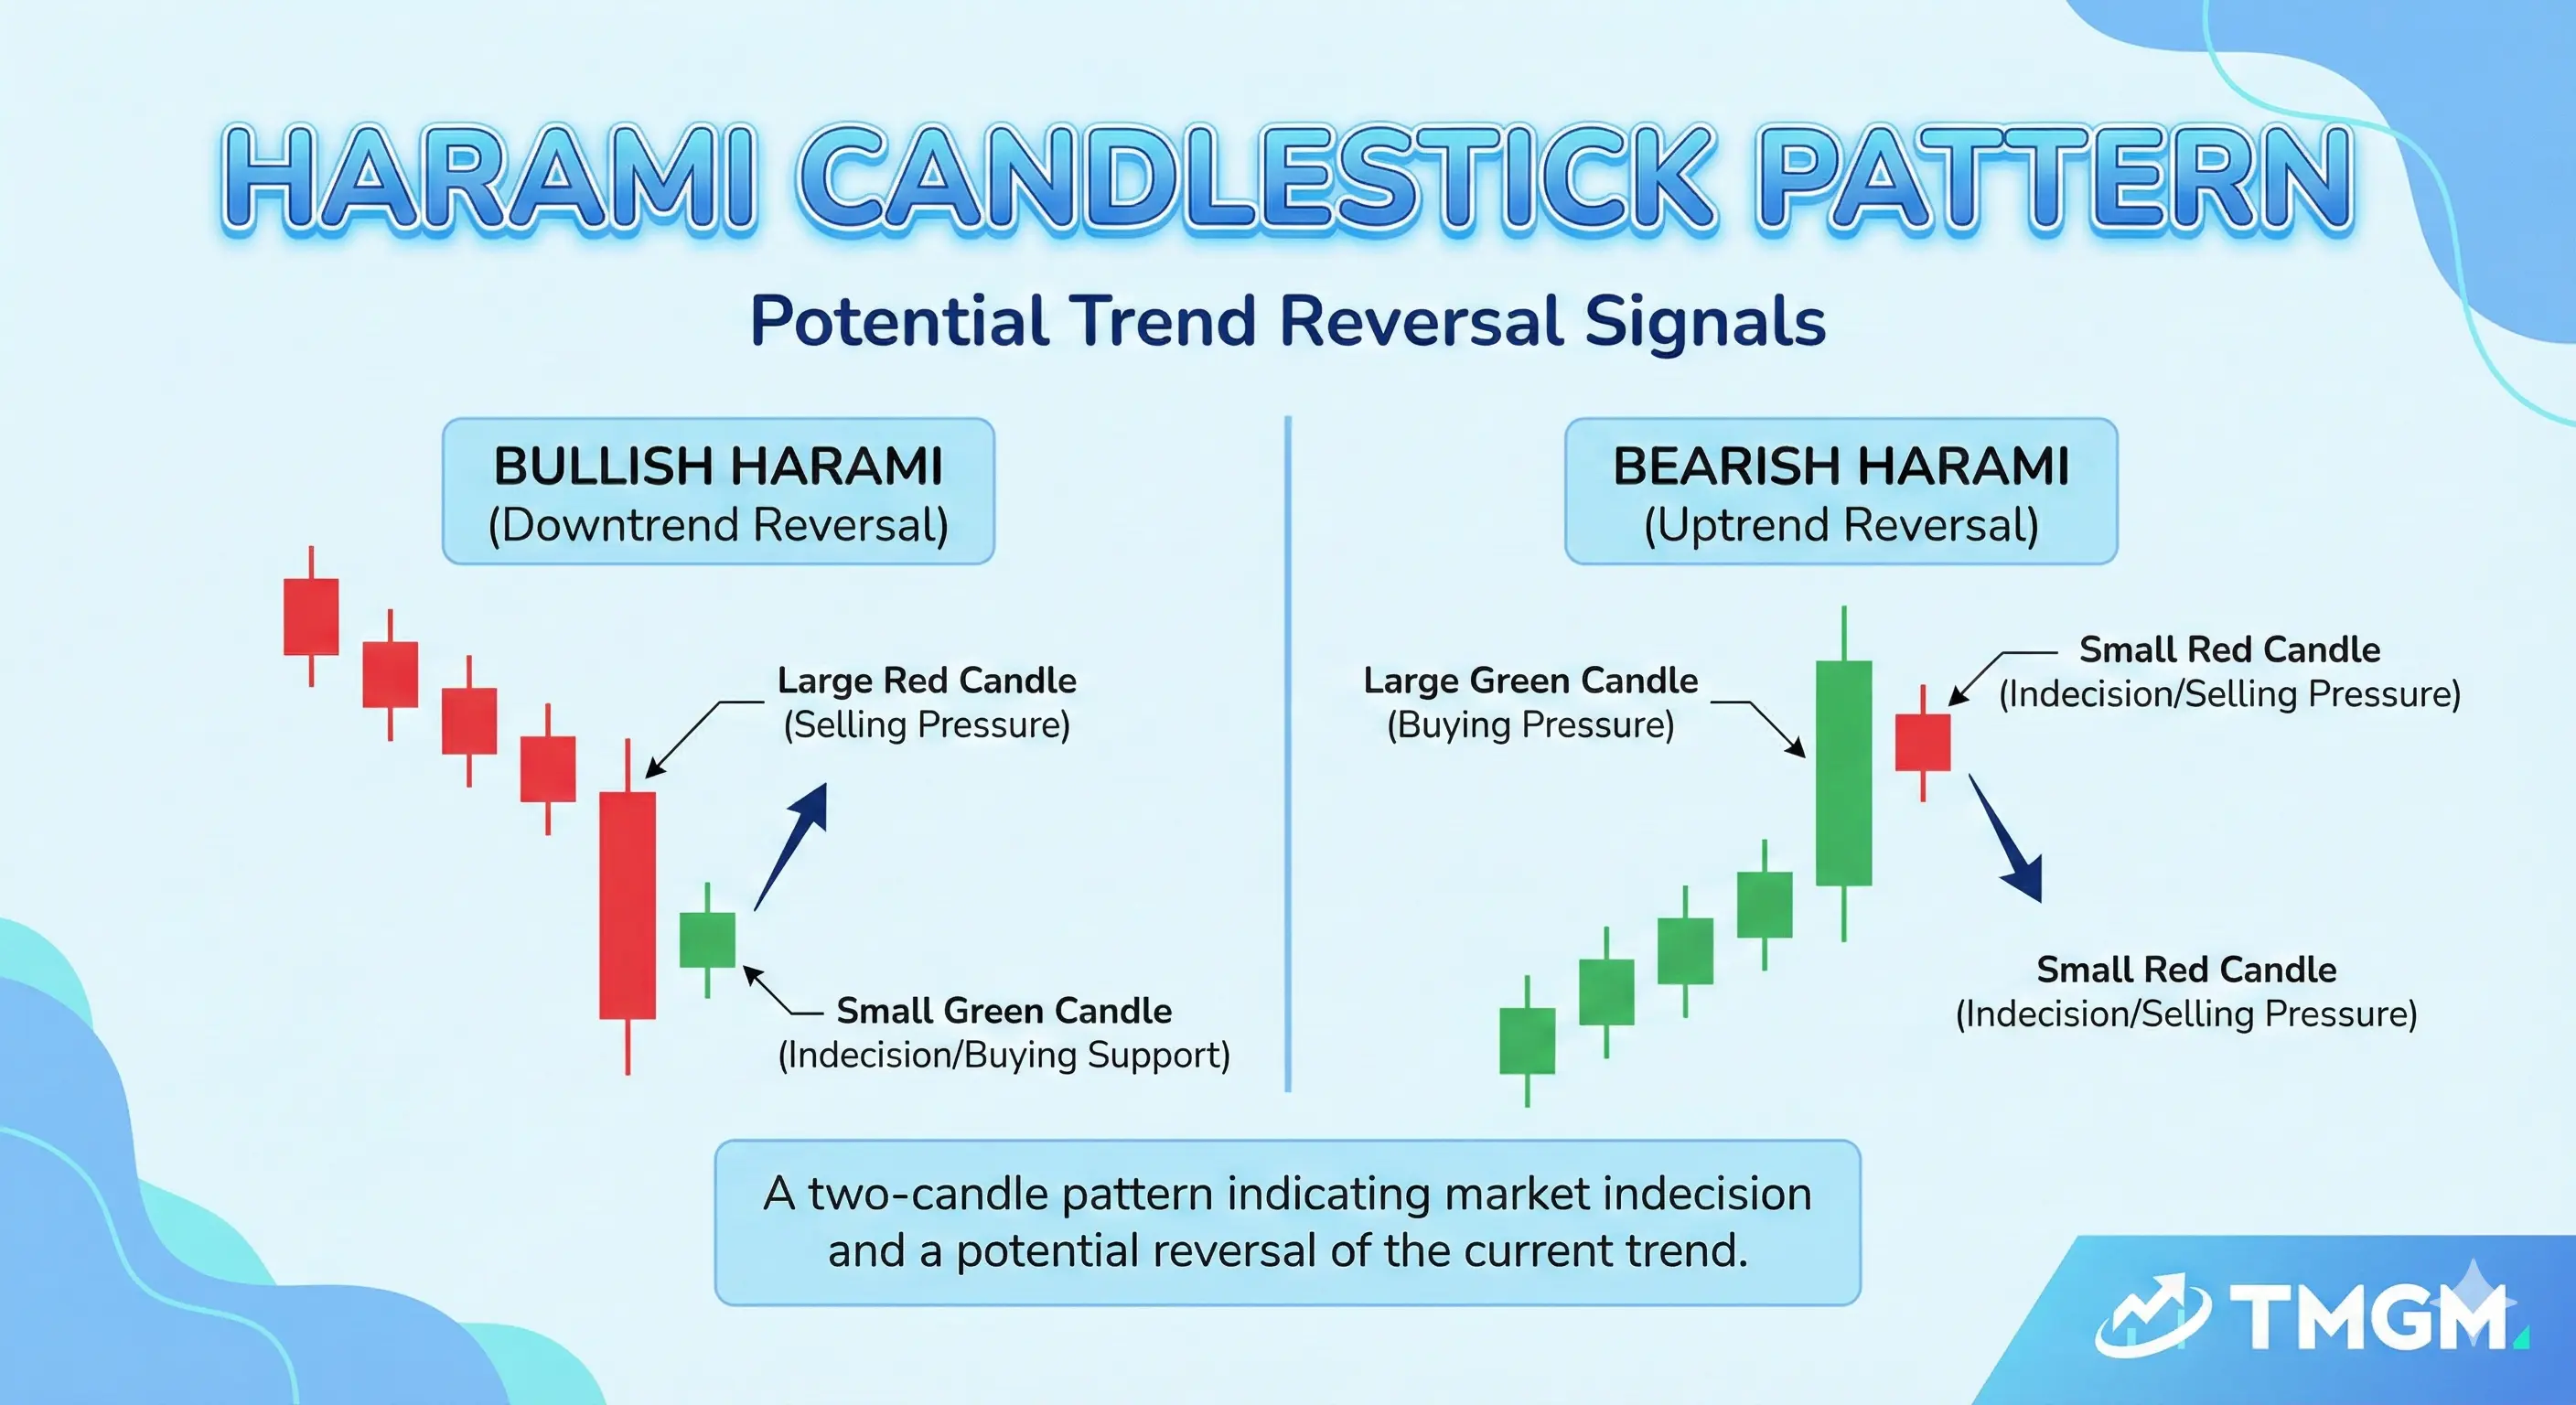
This is a momentum slow down candlestick pattern, not a guaranteed reversal. It forms when a large candle is followed by a smaller candle contained within the prior body, showing the prior side is losing expansion power and the market is compressing. It is most useful after a sharp move where you expect either consolidation or a turning point near a level. It is confirmed when price breaks and closes beyond the harami high or low with follow through.
The harami candlestick pattern is an early warning, not a guarantee of reversal. Many harami setups simply become consolidation, so you should treat it as a cue to wait for a range break rather than forcing a trade.
Engulfing candlestick
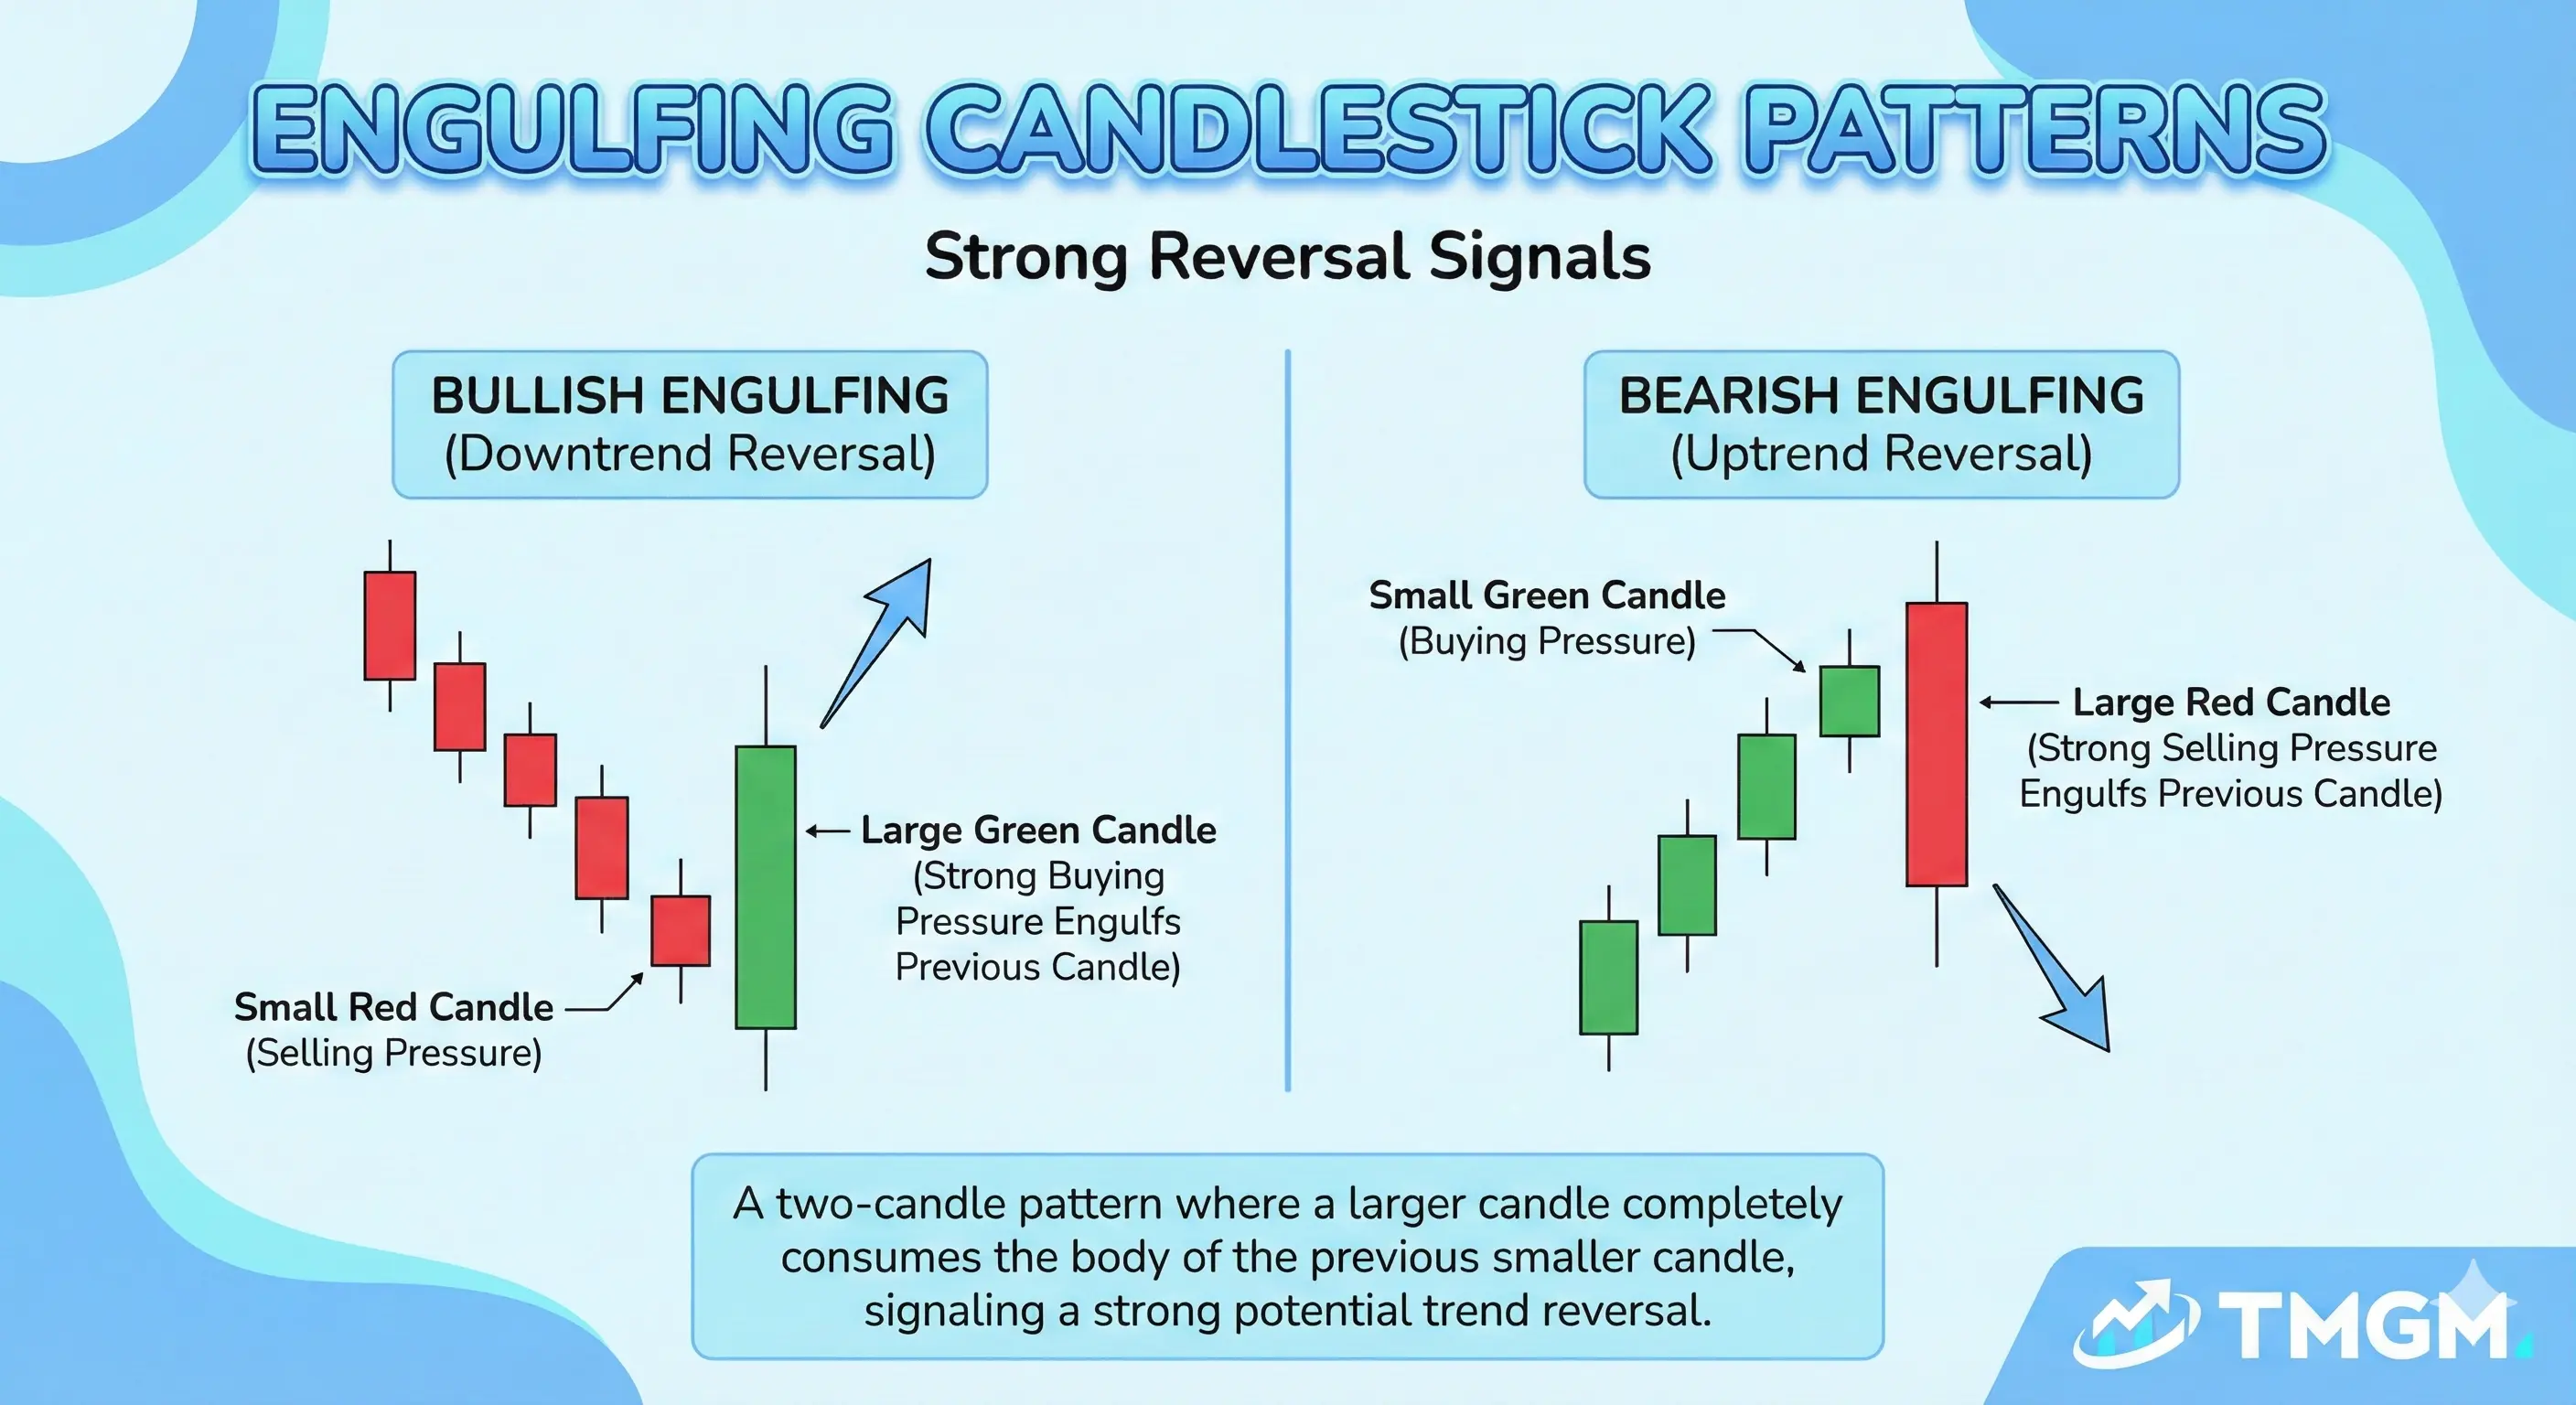
This is a reversal takeover candlestick pattern. It forms when the second candle’s real body fully covers the prior candle’s real body, showing momentum shifted strongly enough to erase the prior session and close with authority. It is most reliable at support or resistance or after a trend leg that looks stretched. It is confirmed by a follow through that closes beyond the engulfing candle’s high or low rather than immediately fading back into the range.
An engulfing candlestick is stronger than a harami because it shows takeover, not just hesitation. Even so, an engulfing candle inside a choppy range can fail quickly, so location and trend decide whether it is signal or noise.
Triple Candlestick Patterns
Three candle patterns can embed follow through because they show impulse, transition, then confirmation. This is why many reversal frameworks treat them as higher sureness, provided they form in the right context.
Morning star candlestick
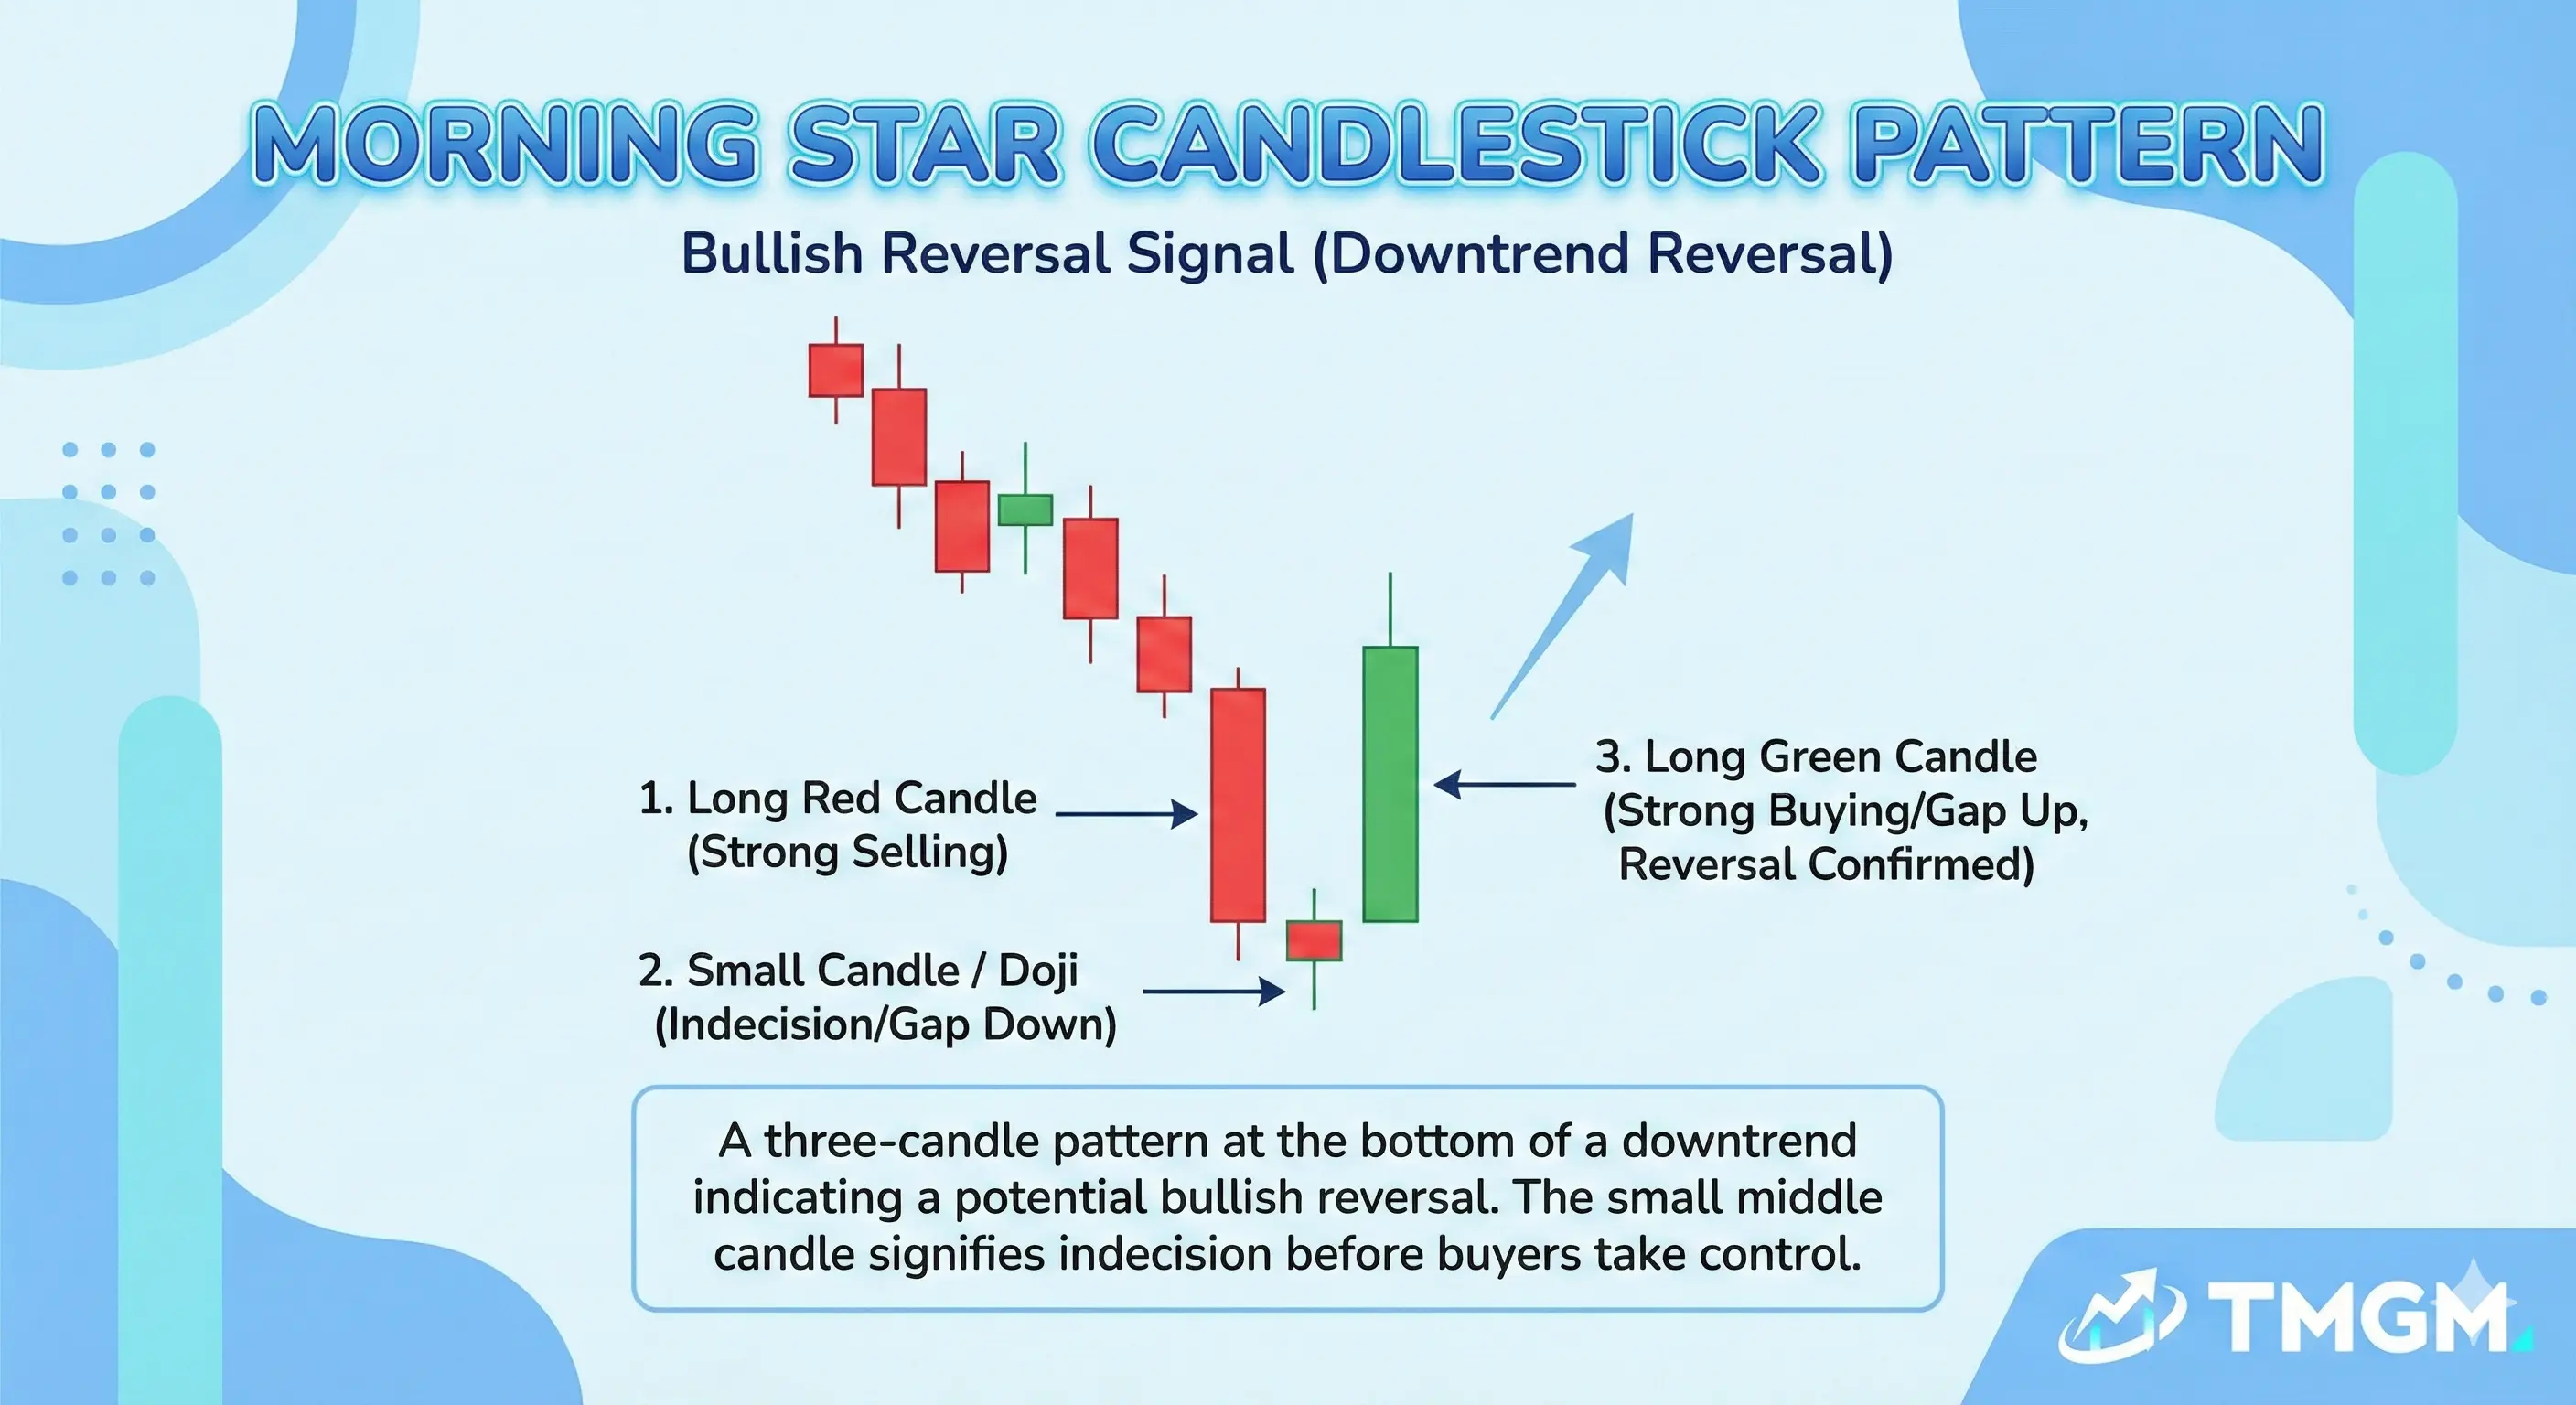
This is a bullish reversal candlestick pattern. It forms as a strong bearish candle, then a small indecision candle, then a strong bullish candle, which shows bearish momentum stalls, balance appears, and buyers reclaim control into the close. It is most reliable after a decline into support or after selling exhaustion. It is confirmed when the third candle closes strong, ideally reclaiming at least the midpoint of the first candle, and subsequent closes hold above the reversal zone.
Star Candlestick Patterns Variations
Morning star candlestick: A momentum rotation setup across three candles, not a one candle trick, because it needs the transition and the reclaim close.
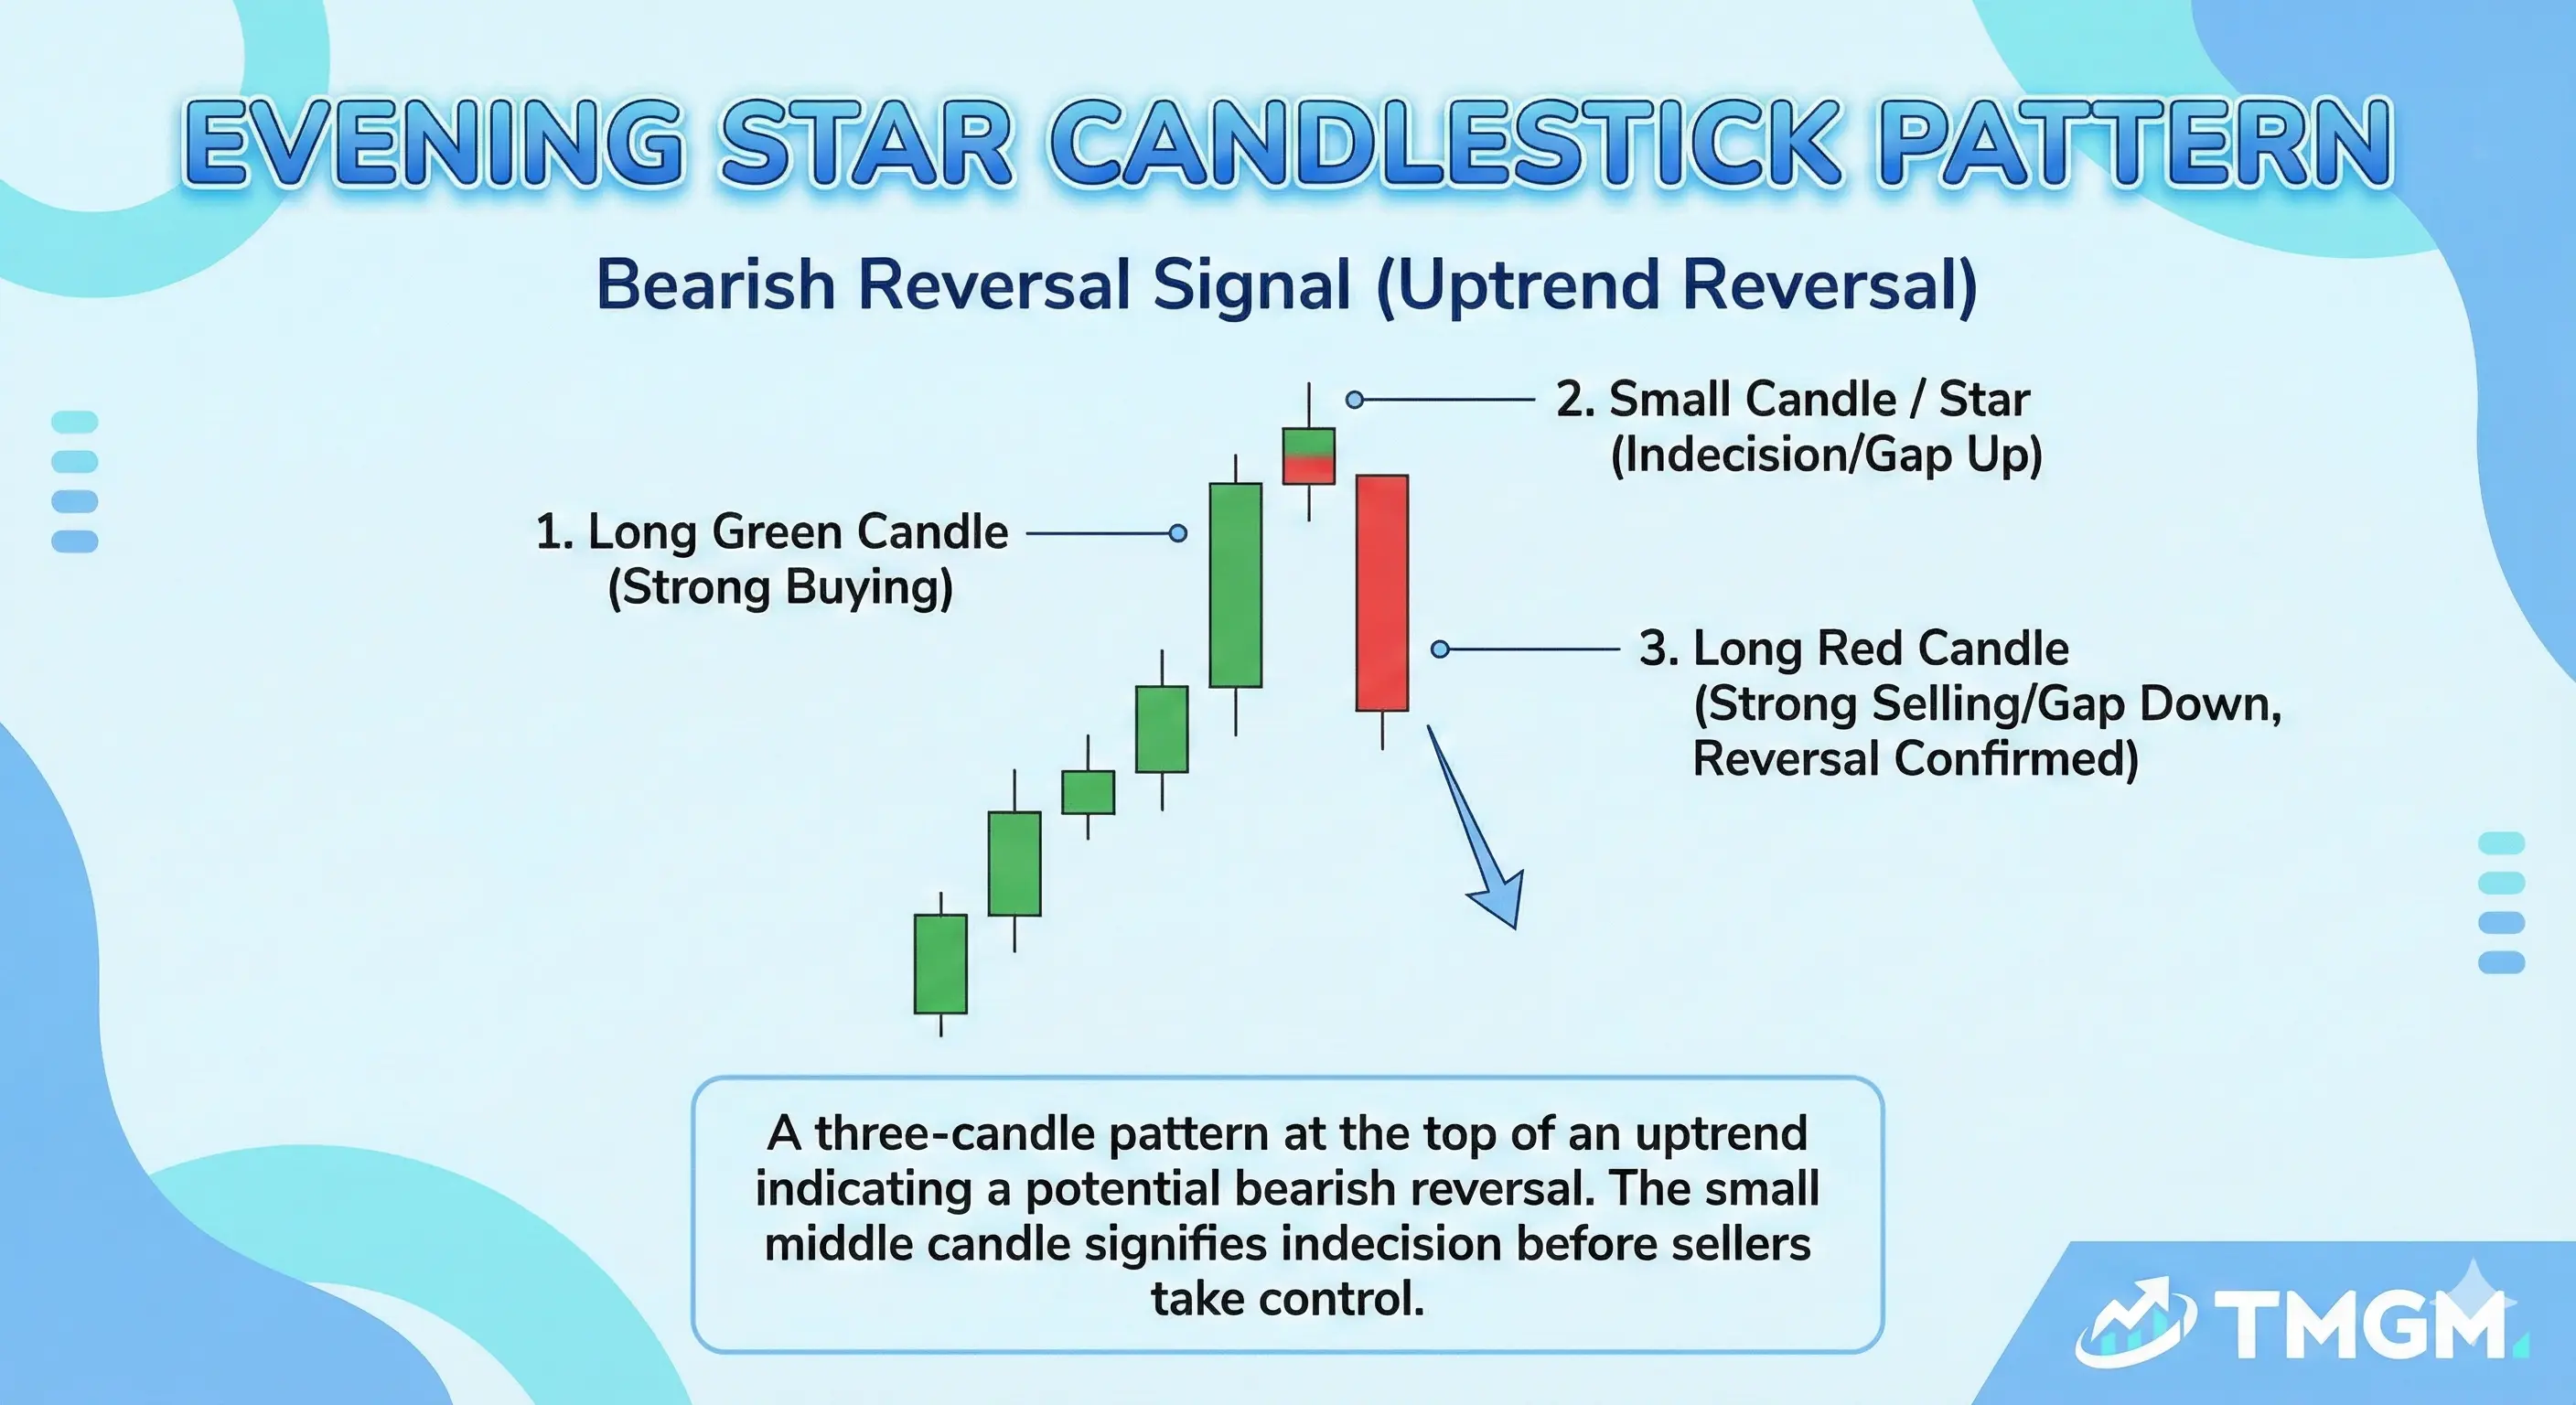
Evening star candlestick: The bearish counterpart after an uptrend, where bullish impulse stalls, indecision forms, then sellers reclaim control into the close.
Three White Soldiers
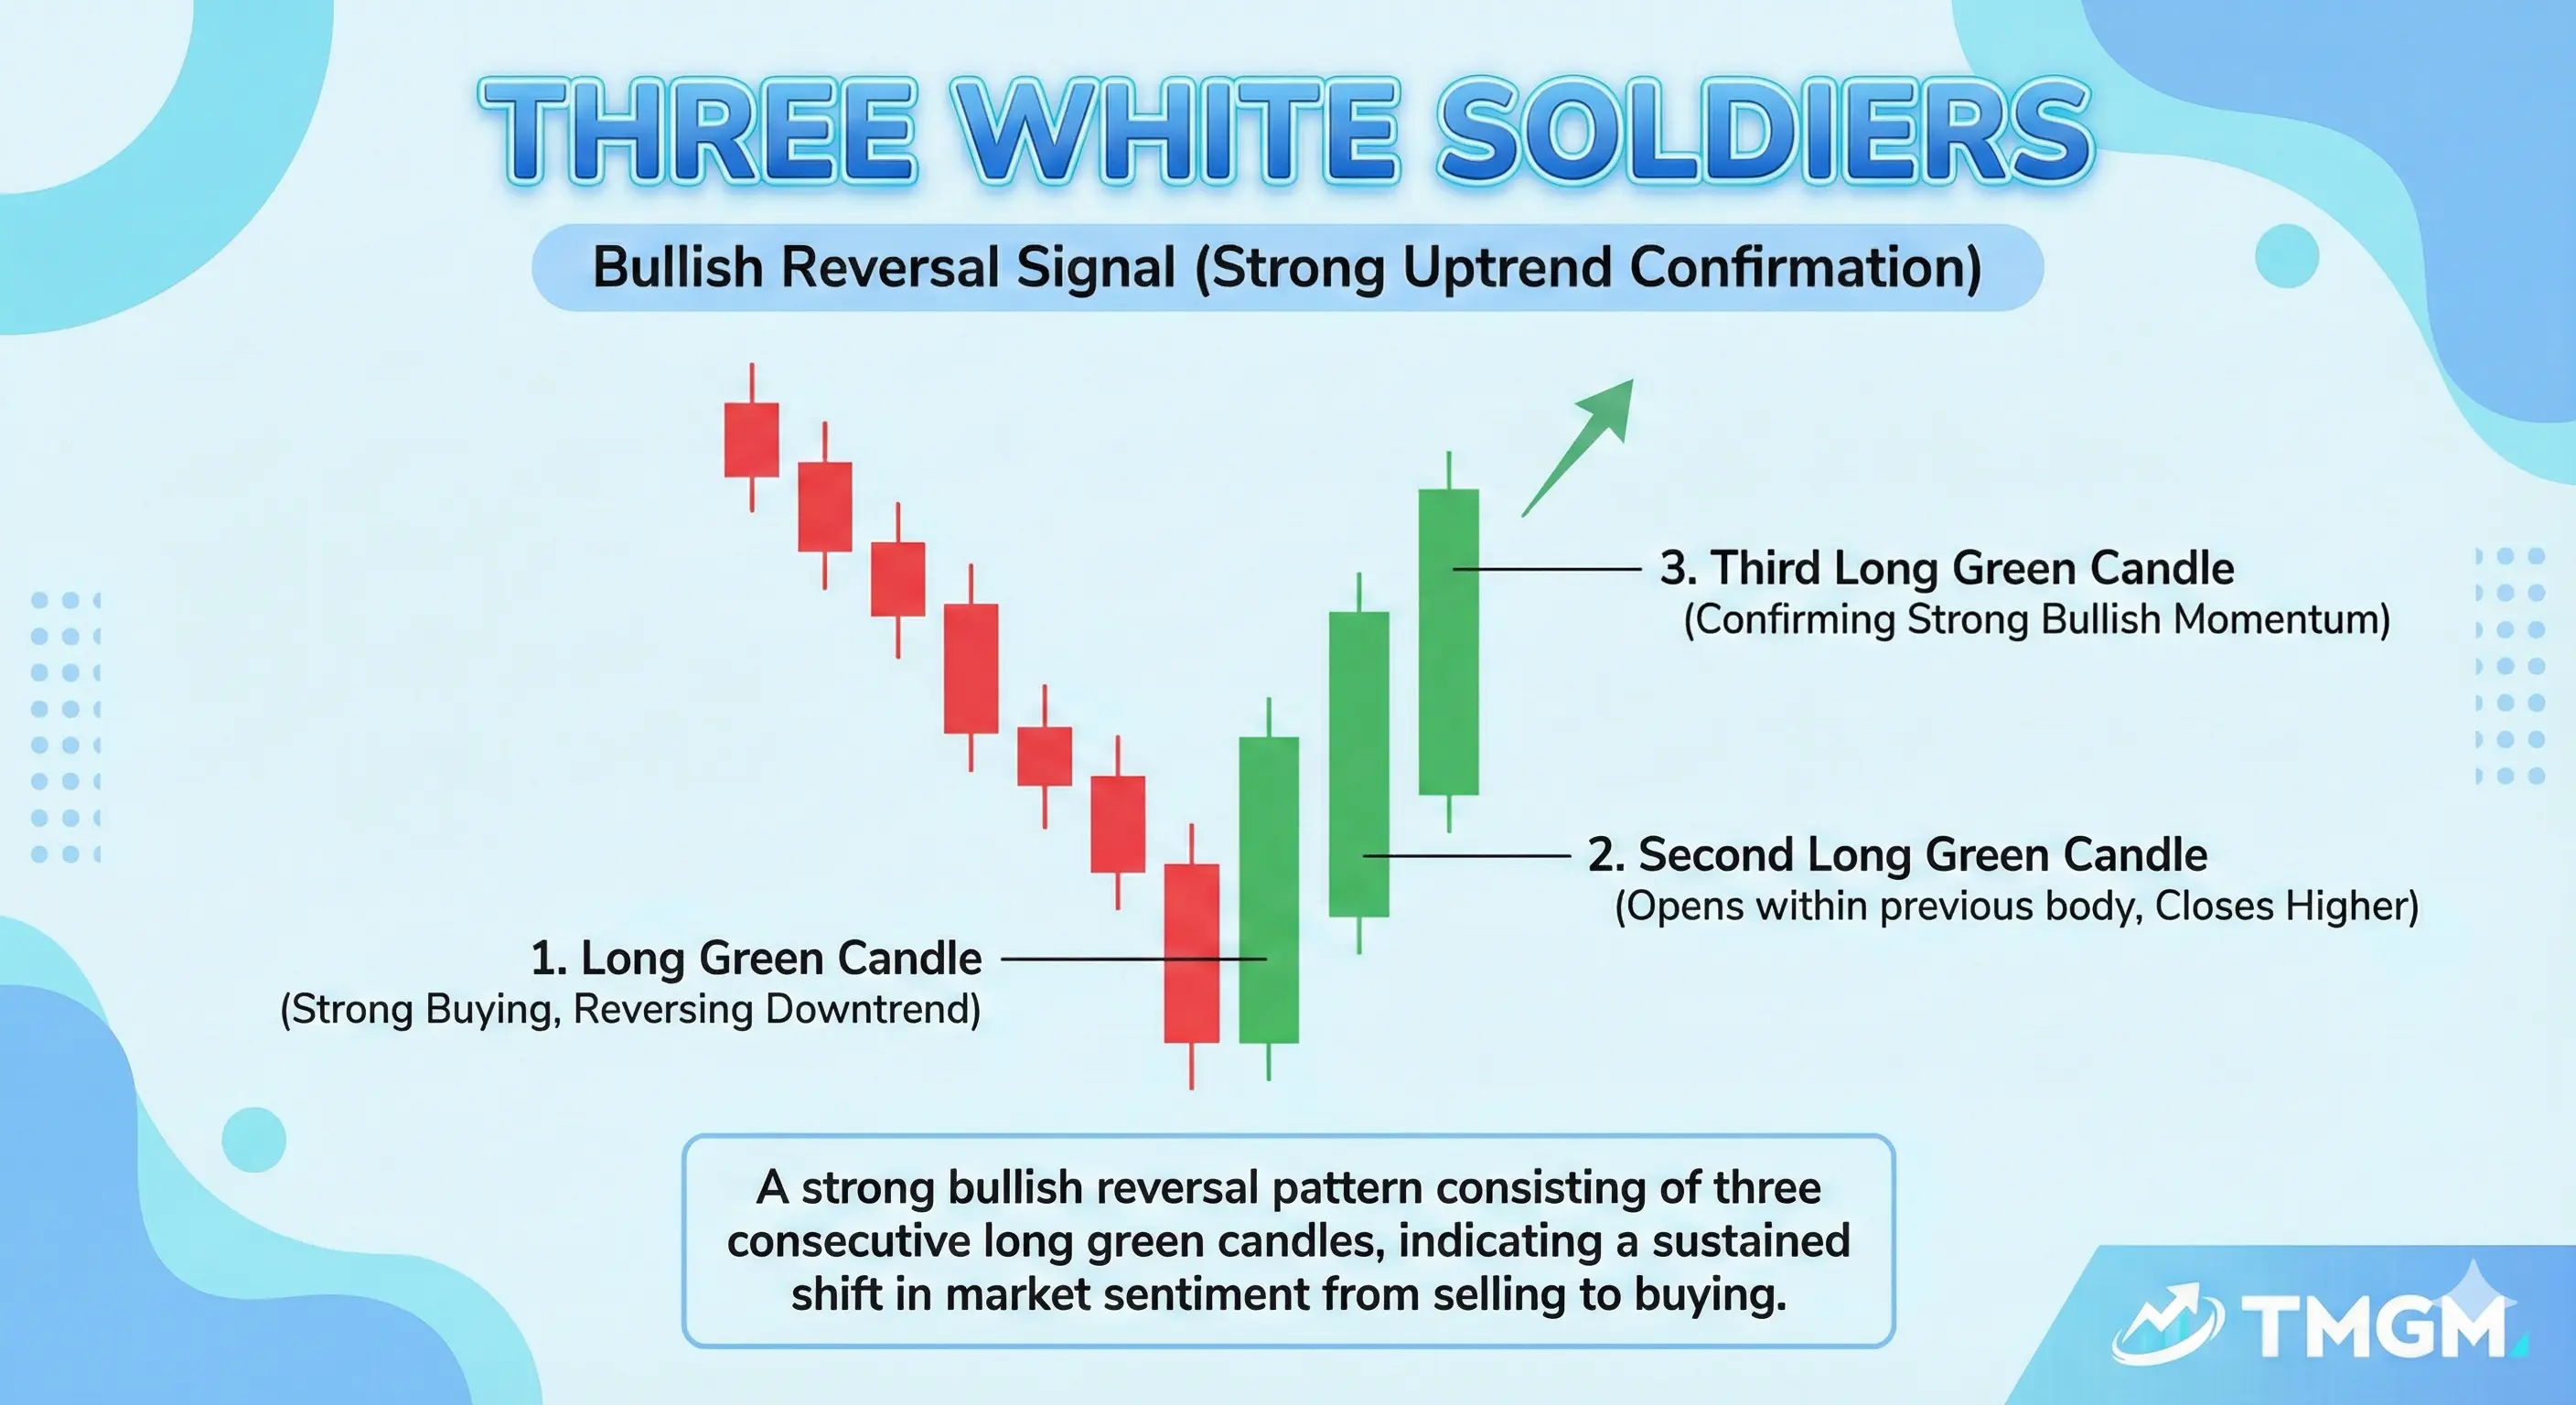
This is a bullish trend reversal to continuation candlestick pattern that reflects sustained demand. It forms as three consecutive bullish candles with strong closes, showing buyers maintain control into the close for multiple sessions and momentum is persisting. It is most reliable after a decline or a base where new buying can drive repricing, and it is weaker after a long rally because it can be late and overextended. It is confirmed when price accepts above prior resistance or holds a retest of the breakout area without immediately reversing.
The three White Soldiers Pattern is strongest after a decline or base and weaker after a long rally because it can be late and overextended. If it appears into resistance, it can mark a buy climax rather than a clean continuation.
Important: A pattern is not a signal by itself, it is evidence, and the trade comes from confirmation through the next close, a break and close beyond the pattern, and the right trend plus level context.
Usage Tips
Wait for Close
Directional confirmation means the next candle closes in the expected direction, not just wicks there intraday. Waiting for the close reduces false signals because it forces the market to prove control, which is the core of how to read candlestick charts.
Context Matters
Context confirmation means trend plus support or resistance, because patterns behave differently in trend versus chop. Many reversal candlestick patterns fail inside ranges because there is no trend to reverse, only rotation.
Combine with Indicators
Traders often use Technical Indicators as an additional source of context, so the intepretation from the candlesticks can be more reliable. For example, an engulfing reversal with rising volume, a bullish divergence on RSI, or a MACD momentum shift can improve signal quality without turning the setup into an indicator system.