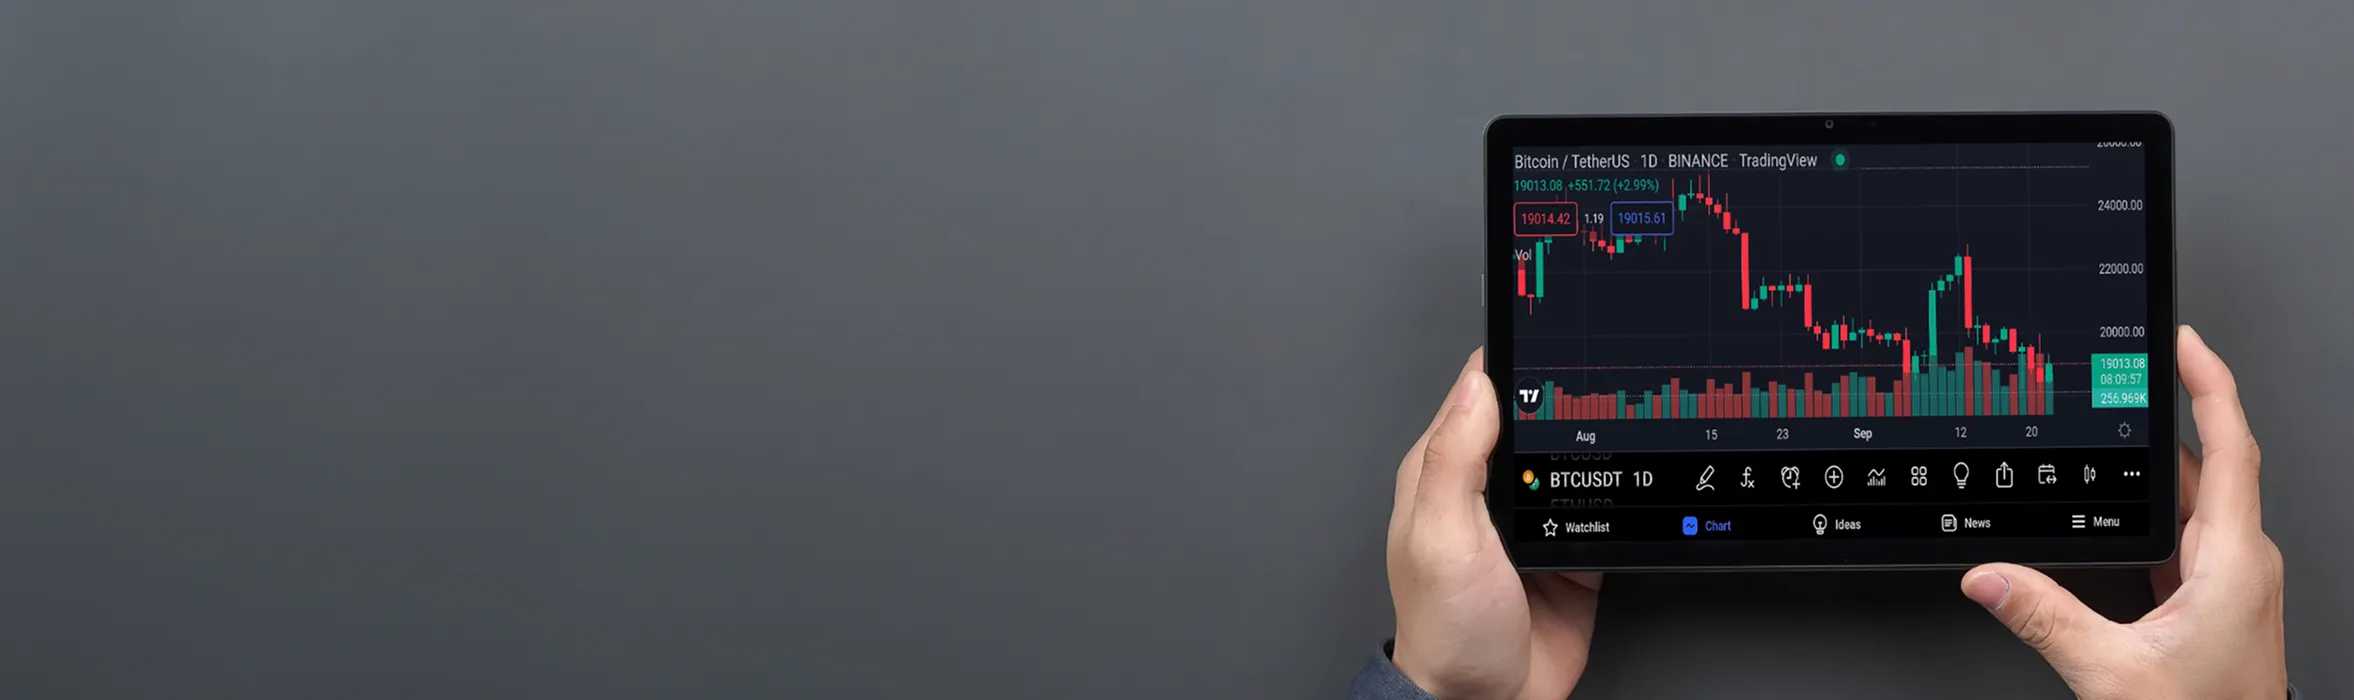


What is Technical Analysis? The 3 Pillars of Technical Analysis.
Technical Analysis is supported by 3 Pillars: Theory, Price Action, and Confirmation Tools (Volume and Indicators).
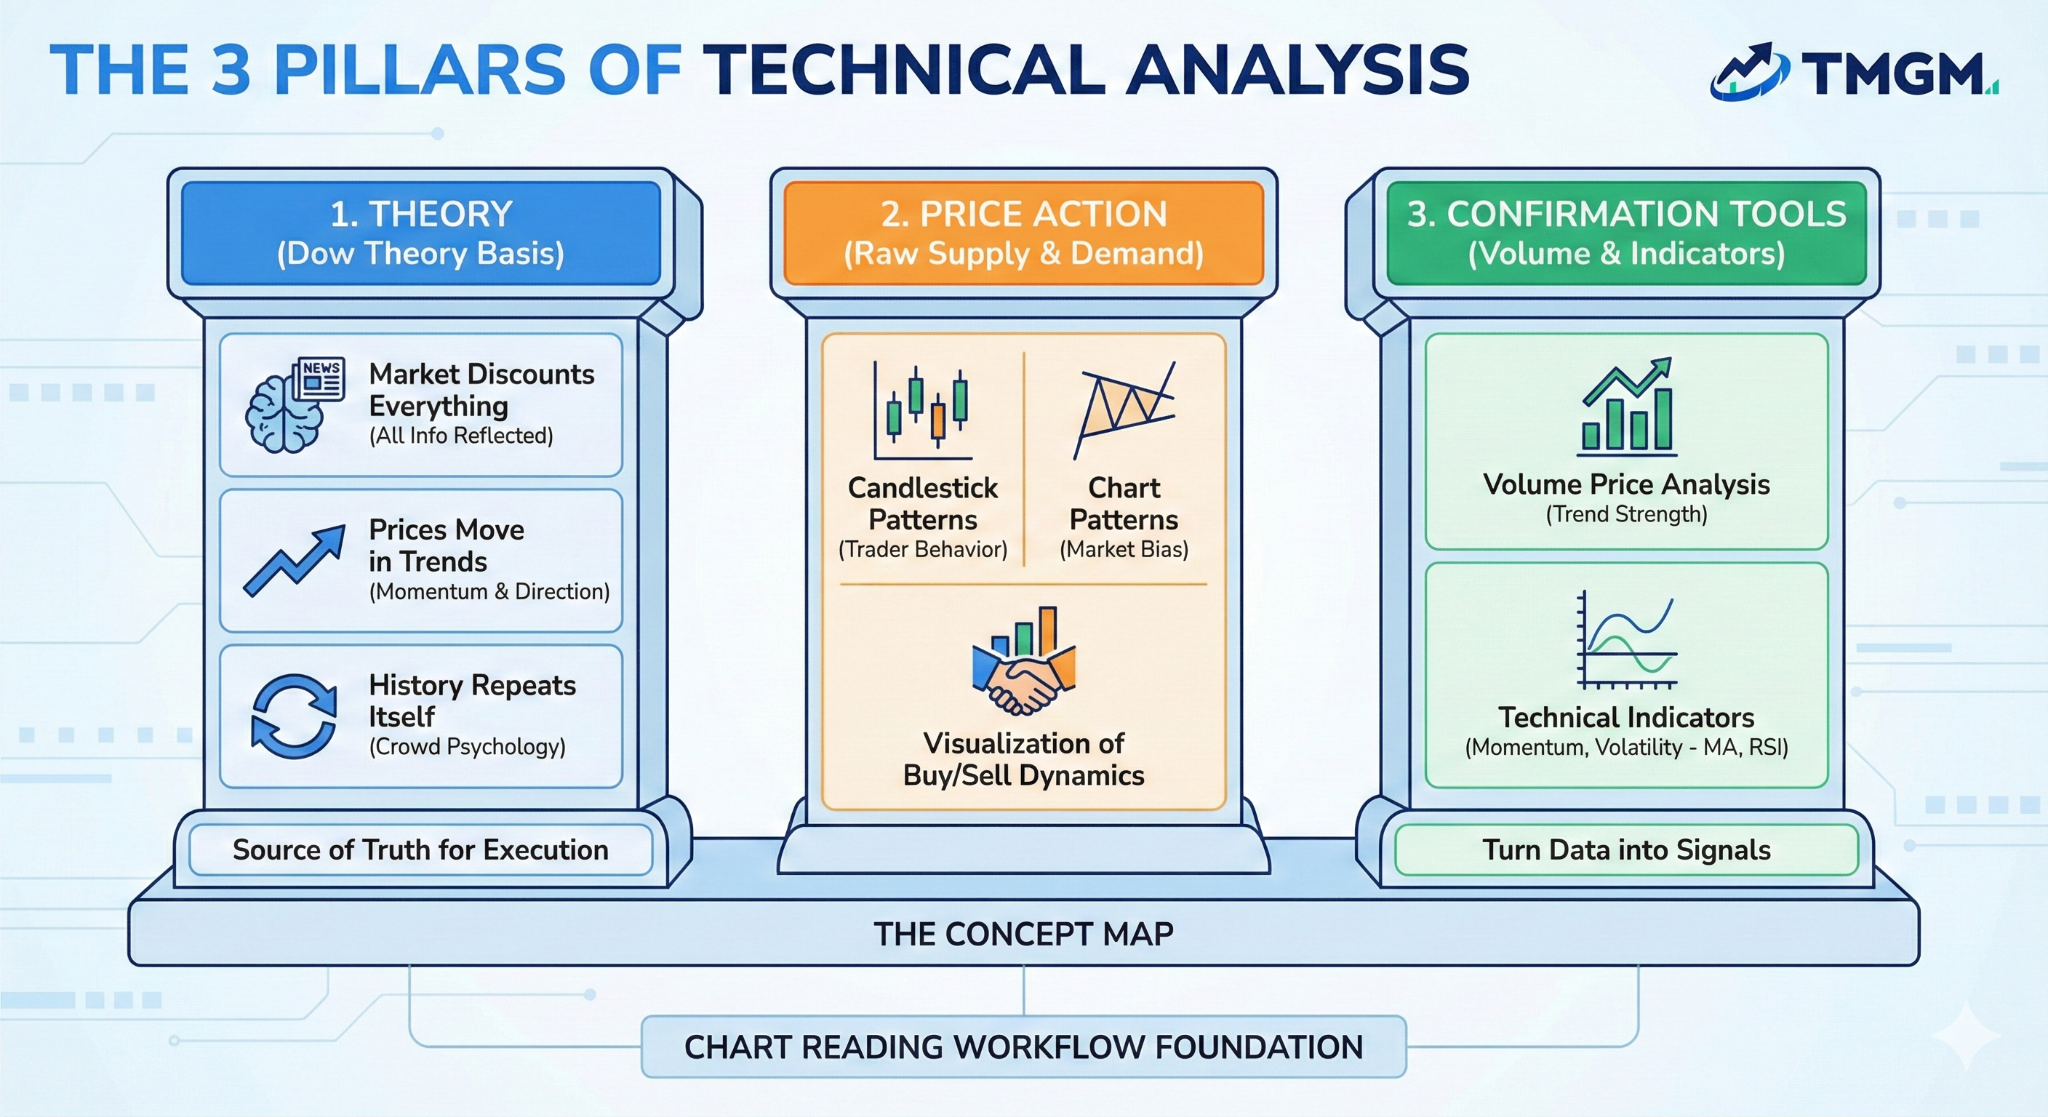
This is the concept map. In the next section, you will learn the workflow of reading charts using these pillars.
Pillar 1: The Dow Theory framework is the backbone of most chart based trading (Technical Analysis): the market’s actions reflect the sum of available information, prices tend to trend, and behavior often repeats because market participants repeat. This is why technicians prioritize the chart as the “source of truth” for execution.
Dow Theory Assumptions
The Market Discounts Everything: The current price reflects all available information, including earnings, economic data, and psychology. It implies that studying price action alone is sufficient, as all supply and demand factors are already incorporated.
Prices Move in Trends: Prices always either carry Buy side and Sell side Momentums, forming Price Trends (Primary, Secondary, and Minor trends) until a definitive reversal signal occurs.
History Repeats Itself: Market & Crowd Psychology is constant. Fear and greed drive predictable chart patterns today just as they did a century ago.
Pillar 2: Price Action includes candlestick patterns and chart patterns. Basically they explain the trader behaviours, trader’s psychology and thought process behind producing the ‘price action’ on the chart, forming a bullish (going up) or bearish (going down) opinion (called bias) on the current market.
In short, price action shows the raw visualization of Supply and Demand dynamics (buying and selling) on the chart.
Pillar 3: Confirmation Tools. Volume Price Analysis and technical indicators turn price and volume data into simple signals that help confirm trend strength, momentum, and volatility. Common examples include moving averages (trend), RSI (momentum), and Bollinger Bands (volatility).
Technical Analysis vs. Fundamental Analysis
While Fundamental Analysis evaluates intrinsic value (earnings, economic health, management), Technical Analysis focuses purely on timing and price mechanics.
Pro tip: Professional traders often use Fundamentals to determine what to buy, and Technicals to determine when to buy it.
How to Read (Analyze) Any Chart? From Pillars to Workflow
After learning about the pillars of Technical Analysis, next, we convert this concept map into an actual chart reading workflow. Charts are built bottom up (candles form patterns, which form market structure), but analysis should be done top down (structure first, then chart pattern and levels, then candles for entry trigger).
To avoid analysis paralysis, traders view charts through three distinct layers:
Step 1: Market Structure (The Context & Bias):
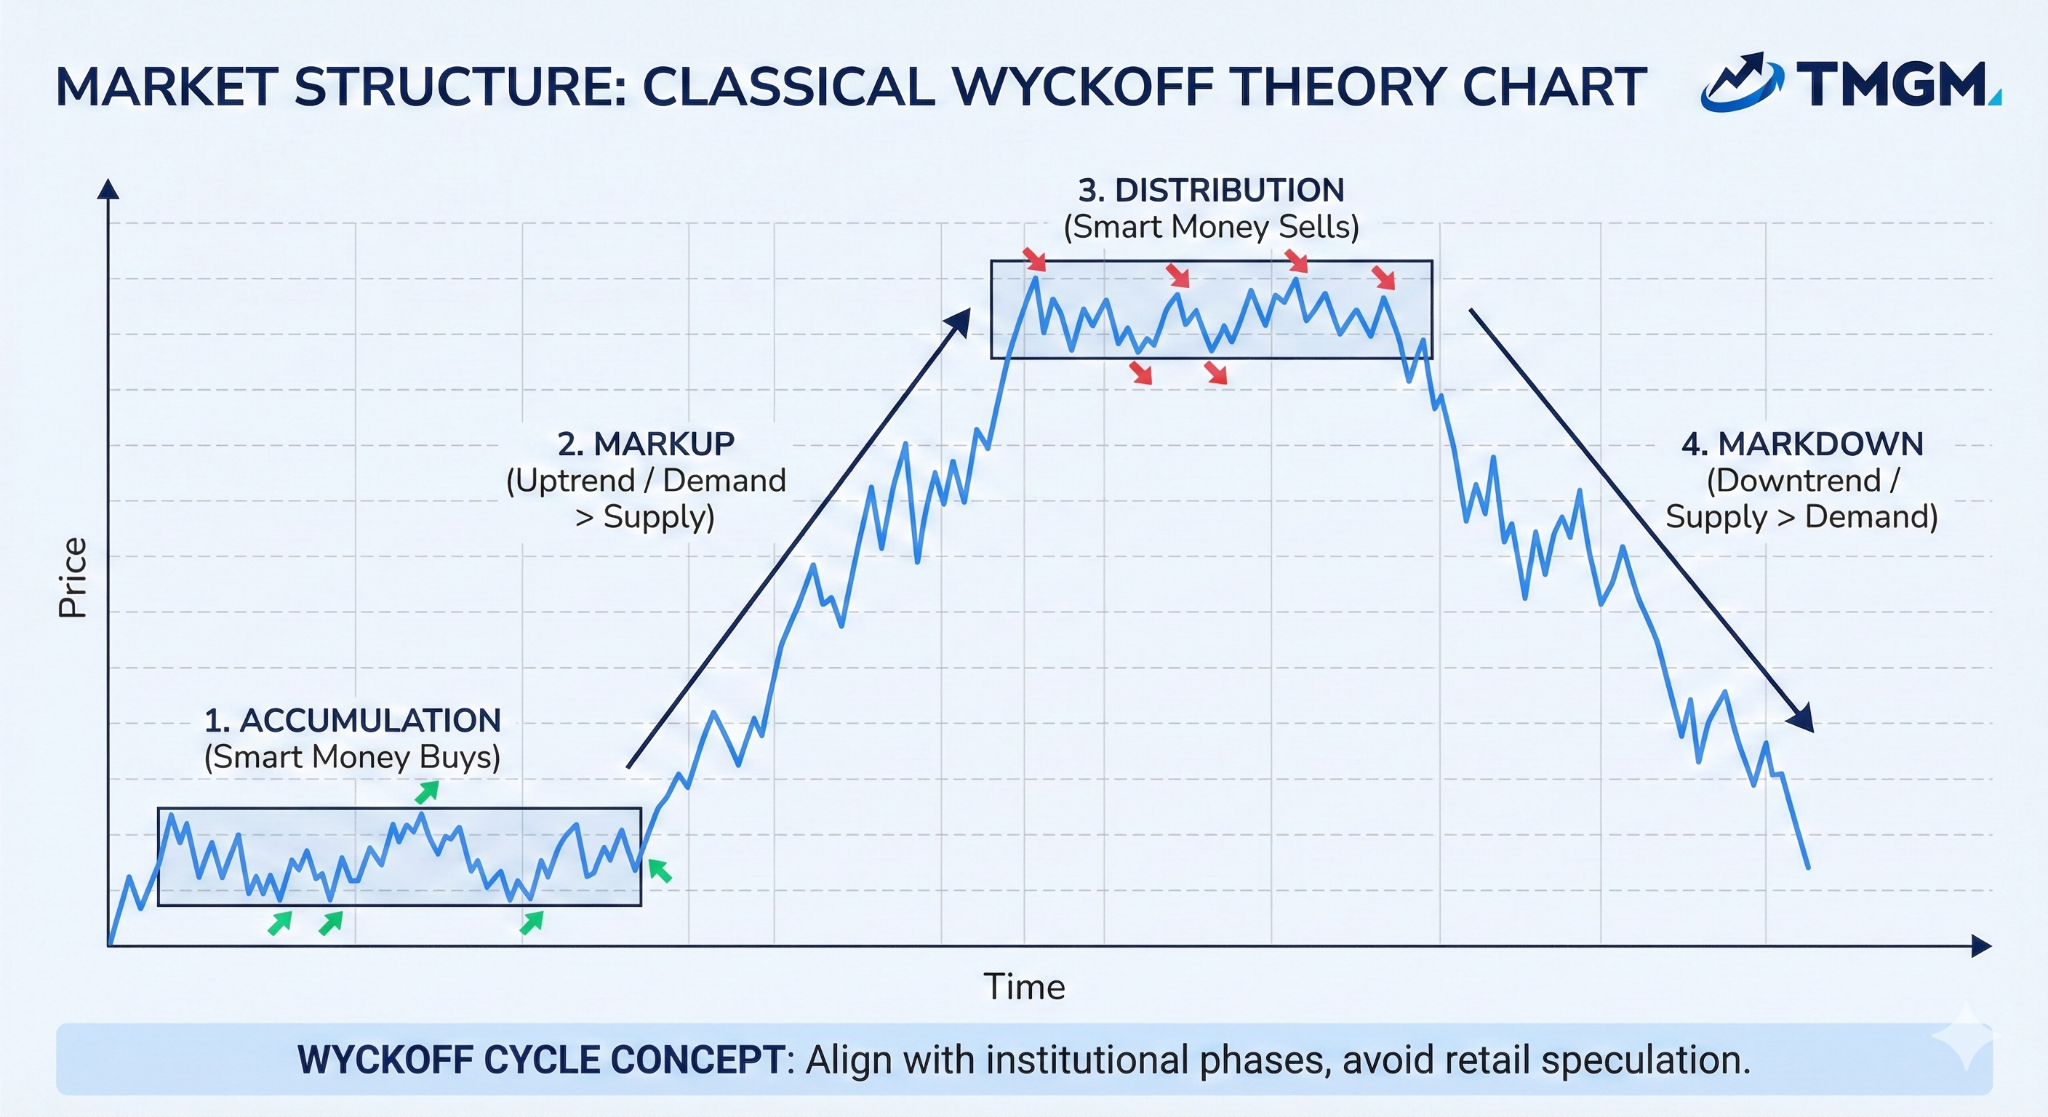
Market Structure tells you which phase (Accumulation, Markup, Distribution, Markdown) the entire market is in right now. It is the ‘big picture’ that becomes clear when you zoom out and identify the dominant trend or range.
Purpose: Helps you identify if the market is in an Accumulation, Markup, Distribution, or Markdown phase.
Why it comes first: You must know the dominant direction (Bias) before you look for a trade. Never trade against the structure.
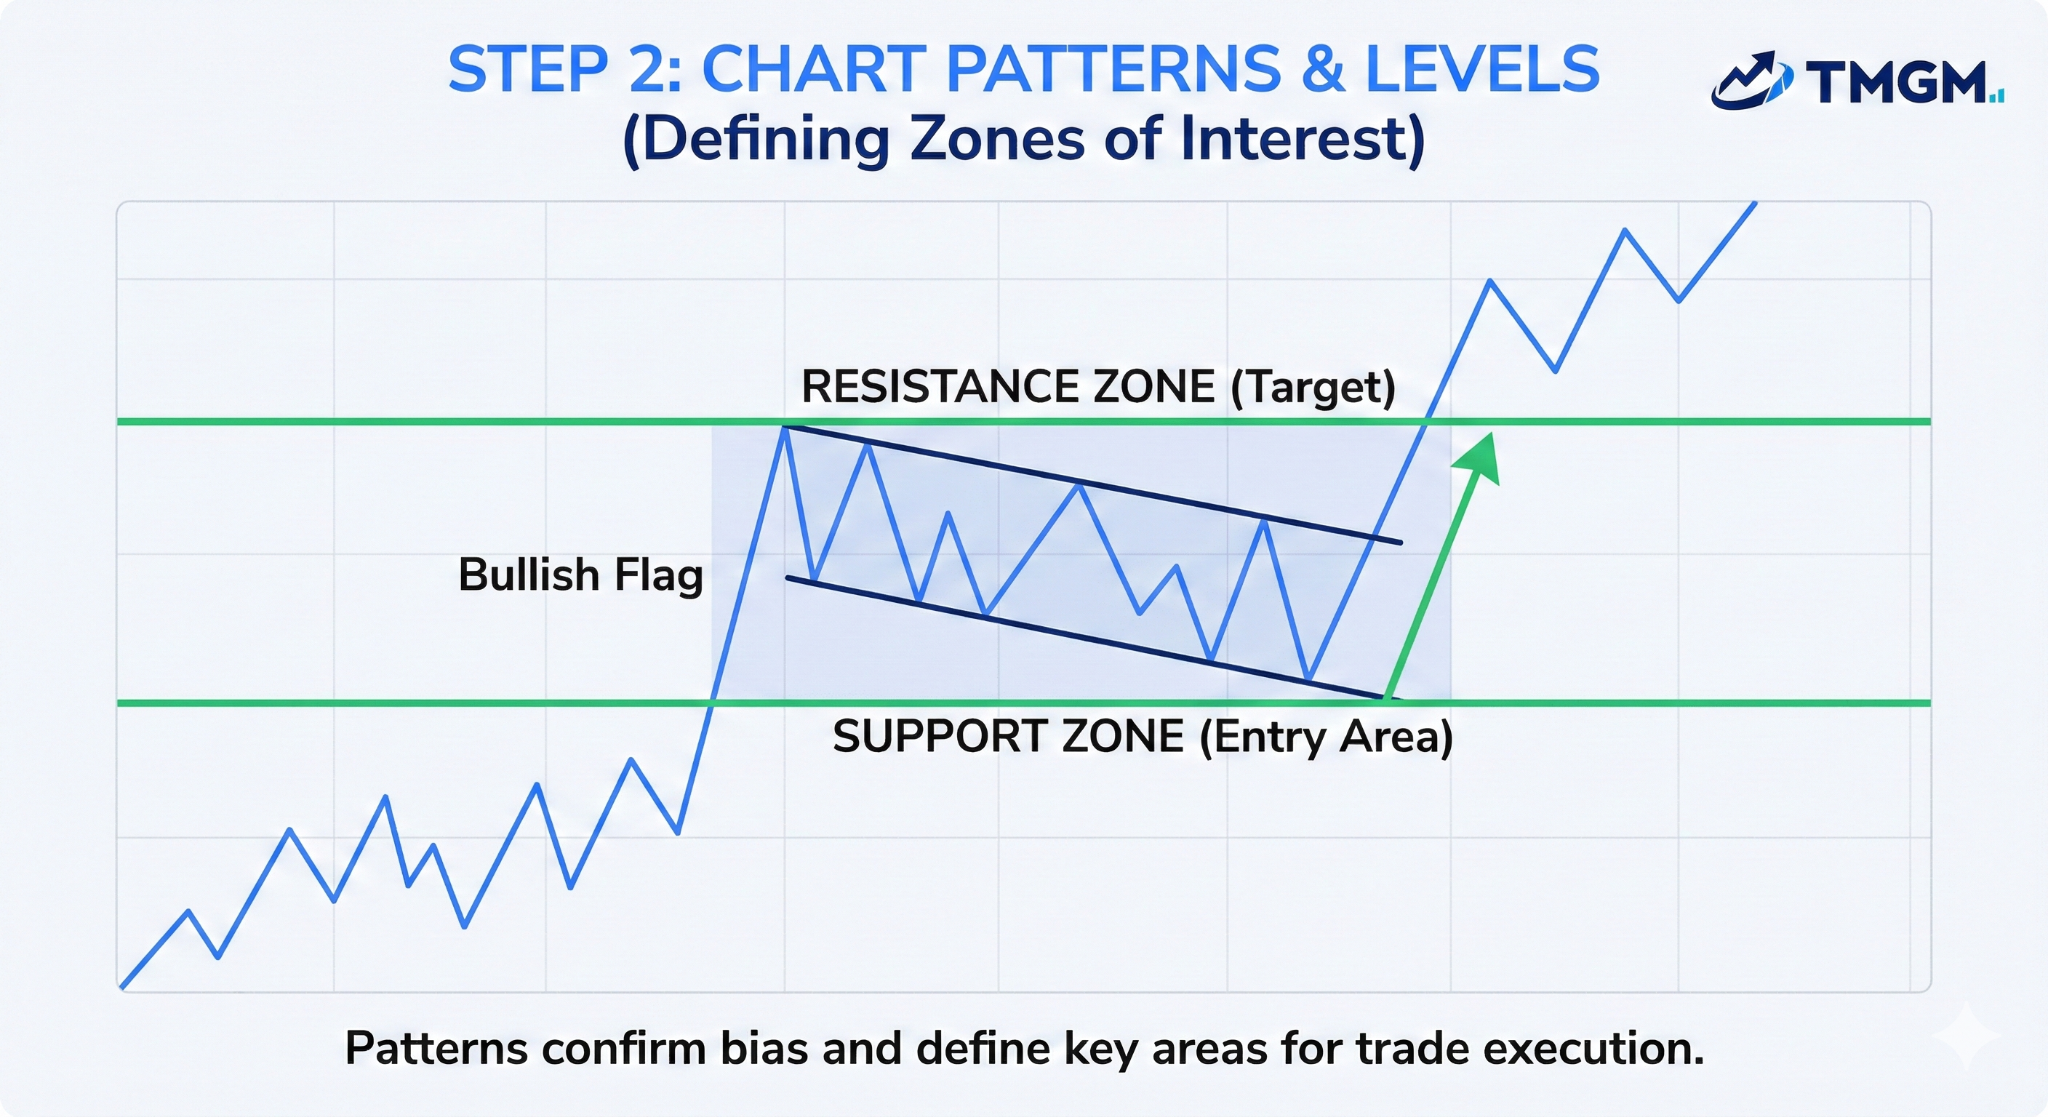
Step 2: Chart Patterns & Levels (Where Decisions Form):
Once the structure is clear, you look for Chart Patterns. These show the result of the Buy-Sell side battle over time, creating recognizable momentum for the winning side.
Purpose: Helps you confirm the current phase or trend (for example markup vs markdown, or accumulation vs distribution) and identify key Support and Resistance levels where a trade might happen.
Why it comes second: Patterns confirm that the structural bias is still valid and help you define zones of interest (support and resistance or supply and demand zones) for an entry.
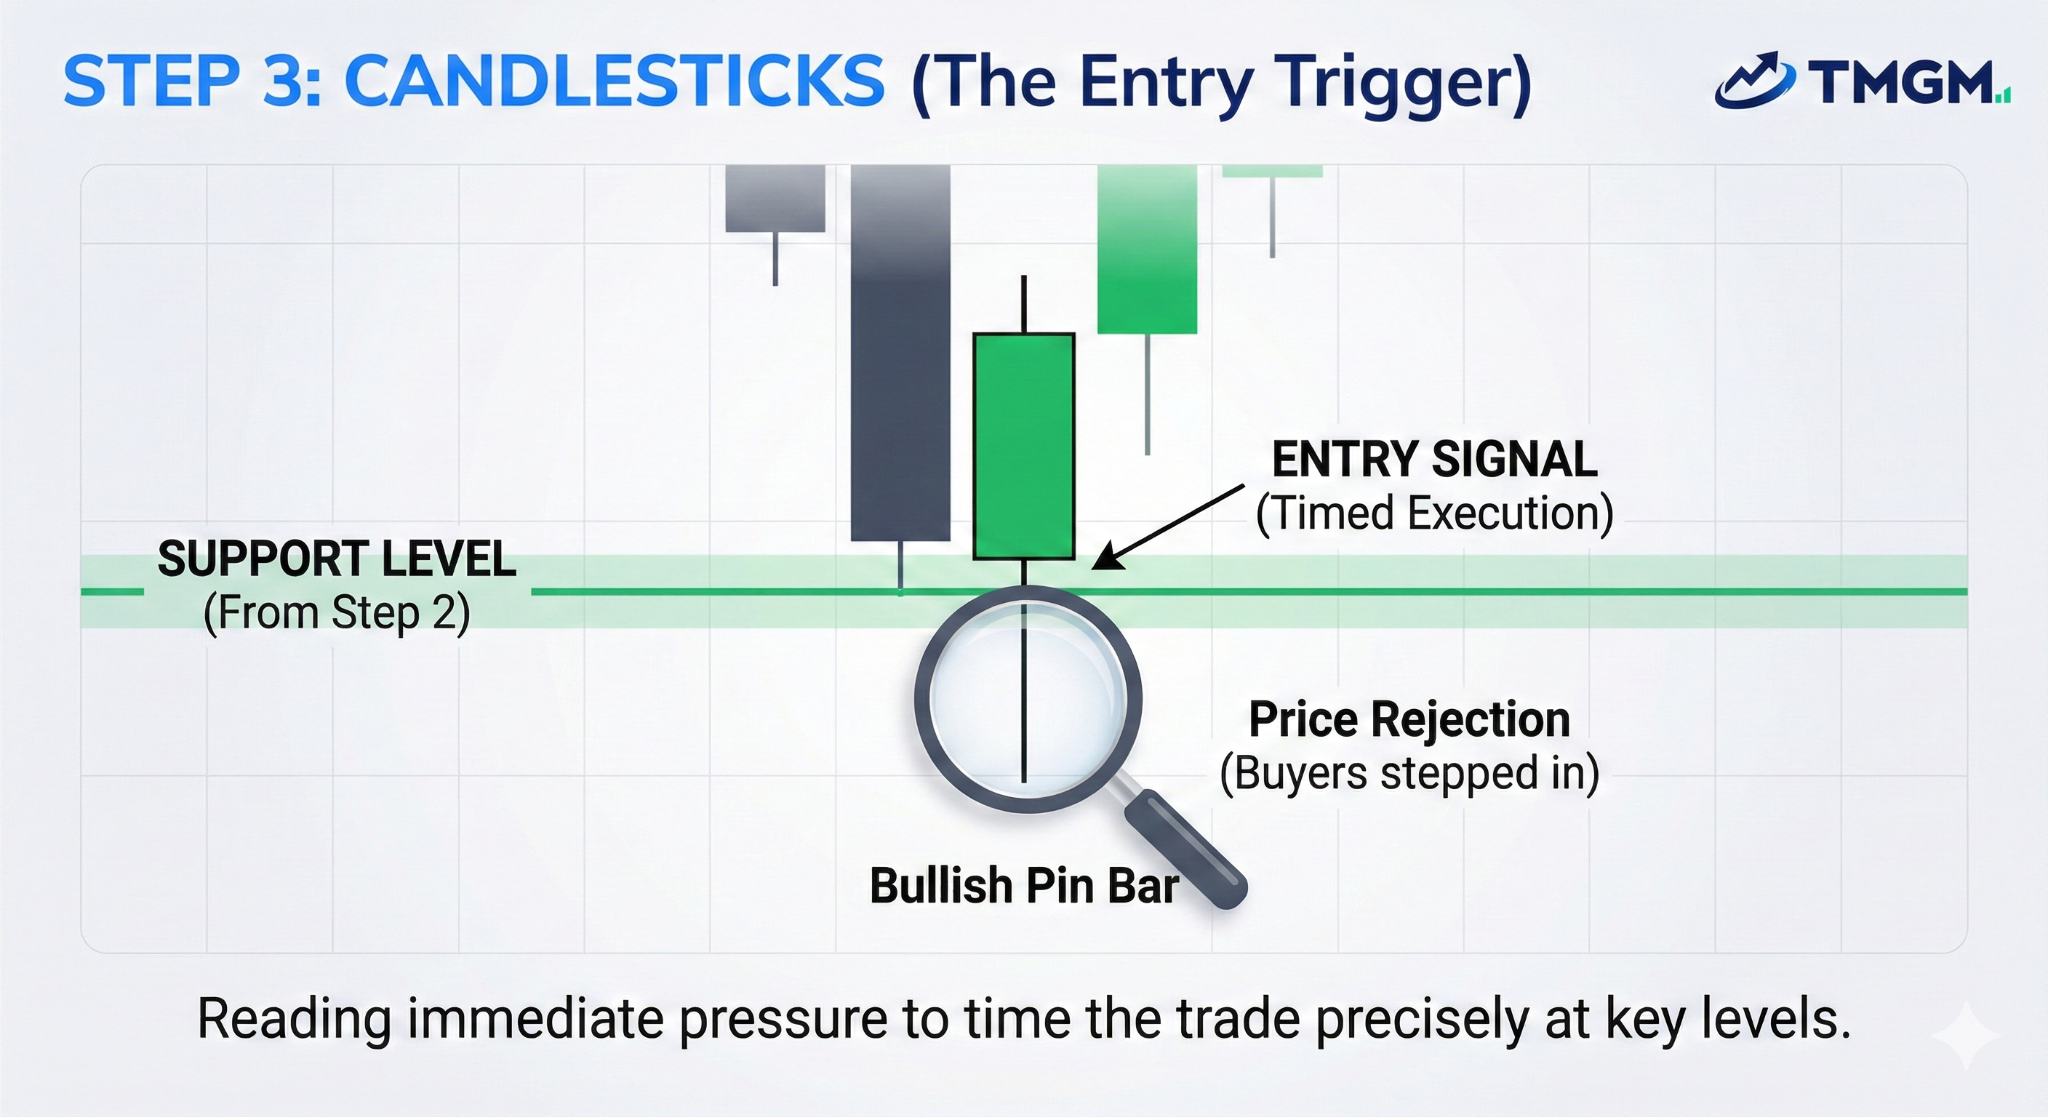
Step 3: Candlesticks (The Entry Trigger):
Finally, you zoom in to the individual Candlesticks. Every candlestick’s body and wick is a compact record of the immediate battle (failed moves, acceptance, and rejection).
Purpose: Helps you read immediate pressure to time and decide your entry and exit precisely.
Why it comes last: This is because a bullish candle is only useful if it appears at a key Level (Step 2) within a bullish Structure (Step 1).
Optional: Confirmation (Volume & Indicators):
Use tools like RSI or Volume to validate the strength of the move. High volume on a breakout confirms that institutional money is supporting your trade idea.
Important: Technical Indicators are not an essential part of technical analysis. They are heavily used, but they do not make up the basic building blocks of the price chart, not the market structure, but they are useful to many traders. But Volume is highly recommended.
Tools for Each Step of Technical Analysis
Now that you have the workflow, here are the main tool categories and strategy modules traders use. Effective analysis is built on a hierarchy of tools, ranging from granular price data to broad structural concepts.
Step 1 Market Structure (Tool): Wyckoff
The Wyckoff Method defines the market cycle into four phases: Accumulation, Markup, Distribution, and Markdown. This "Smart Money" concept helps traders align with institutional accumulation rather than retail speculation.
Step 2 Chart Patterns & Support/Resistance Tools
Chart Patterns: Patterns like triangles or double tops highlight where price is compressing or failing, and where a breakout or reversal is more likely.
Support and Resistance (S/R): These are not distinct lines but zones of liquidity. Price returns to these levels because institutional orders (Limit Orders) are stacked there, waiting to be filled.
Examples of Chart Patterns:
Cup and Handle
Flags
Pennants
Triangles
Head and Shoulders
Double Tops/Bottom
Triple Tops/Bottom
Step 3 Candlesticks & Patterns Tools
Candlesticks are the DNA of price. They reveal the battle between bulls and bears within a specific timeframe.
OHLC Data: Open, High, Low, Close data points visualize volatility.
Psychology: A long "wick" indicates price rejection and liquidity grabs, often triggering reversals.
Examples of Candlesticks: Heikin Ashi Candlestick
Examples of Candlestick Patterns:
Shooting Stars Candlestick Pattern
Hammer Candlestick Pattern
Pin Bar Candlestick Pattern
Bullish and Bearish Engulfing Candlestick Patterns
Doji Candlestick patterns
Morning Star and Evening Star Candlestick Patterns
Marubozu Candle
Confirmation Tools: Technical Indicators and Volume Price Analysis
Technical Indicators
While professionals often rely on "naked" charts, indicators like
Moving Averages (SMA, EMA)
Used as a dynamic support and resistance level
Used as a dynamic support and resistance level
VWAP (Volume Weighted Average Price)
ATR (Average True Range)
Pivot Points
Volume Price Analysis
Volume confirms validity. Volume is a direct measure of market participation, and finance research shows that trading volume is positively related to the magnitude of price changes.
Reference: [”Market Statistics and Technical Analysis: The Role of Volume – The American Finance Association, Publishers of the Journal of Finance.”, “Karpoff JM. The Relation between Price Changes and Trading Volume: A Survey. Journal of Financial and Quantitative Analysis. – 1987;22(1):109-126. doi:10.2307/2330874”]
According to standard market theory, price movement accompanied by high volume is authoritative; movement on low volume is suspect. Tools like Volume Profile help identify "High Volume Nodes" where the most trading occurred, acting as magnetic zones for price.
Volume is a direct measure of market participation, and finance research shows that trading volume is positively related to the magnitude of price changes. In practice, technicians treat a breakout or trend move as more credible when it is supported by stronger volume because the joint information in price and volume can be informative. Volume Profile visualizes volume by price, so high volume nodes highlight price areas where trading concentrated and where price may later react because many positions were built there.
Important: Indicators are lagging derivatives of price. They should be used for divergence confirmation, not as primary entry signals.
Risk Management
Risk management is what keeps a trading account alive through inevitable losing streaks. Regulators consistently warn that leverage and margin can magnify losses, and in some markets investors can lose their entire initial funds and may be required to deposit more. Because outcomes are uncertain, controlling position size, defining invalidation points, and limiting downside per trade are the practical foundations of long term survival. – “Leveraged Investing Strategies – Know the Risks Before Using These Advanced Investment Tools, by U.S. Securities and Exchange Commission”, “CFTC hosted FIA Combined Disclosure Statement, by CFTC”
Position Sizing
Position size should be dynamic, based on the distance to the stop loss, not a fixed dollar amount.
Formula: Risk Amount / (Entry Price - Stop Price) = Number of Units.
Application: Whether Day Trading or Swing Trading, risking 1-2% of total equity per trade prevents "Risk of Ruin."
Risk-Reward Ratio (R:R)
The Risk Reward Ratio (RRR) dictates the exit strategy. A minimum 1:2 R:R means for every $1 risked, the target is $2 profit. This allows a trader to be wrong 50% of the time and still be profitable. Stop losses must be placed at invalidation points (where the trade thesis is proven wrong), not arbitrary dollar levels.
Trading Psychology
Psychology dictates execution. Even a perfect strategy fails if the trader succumbs to cognitive biases.
Fear & Greed: Drives irrational exits and late entries.
FOMO (Fear Of Missing Out): Entering a trade after the move has happened, usually into resistance.
Revenge Trading: Immediately re-entering after a loss to "make it back," ignoring the plan.
Prospect Theory: The tendency to hold losers too long (hoping for a rebound) and sell winners too early (fearing profit loss).
Pro Tip: "The zone" in trading is achieved when you accept the risk completely. If you are anxious while in a trade, your position size is too big.
How to Learn Technical Analysis
Mastery requires a blend of academic study and screen time.
Study the Basics: Master candlestick anatomy and Dow Theory. Read seminal texts like Technical Analysis of the Financial Markets by John Murphy.
Utilize Resources: Leverage charting platforms like TradingView and credible educational sources (Investopedia, CME Group education).
Practice Skills: Use a simulator or "Paper Trading" account to test strategies without financial risk. Log trades to track psychological errors.
Develop a Plan: Create a written Trading Plan detailing specific setups, risk parameters, and review schedules.
Limitations of Technical Analysis
Technical analysis is a probability game, not a crystal ball.
Subjectivity: Two traders can interpret the same chart differently (e.g., wave counts or trendline placement).
Lagging Nature: most tools analyze past data. Sudden geopolitical shocks (Black Swan events) are not visible on charts until they happen.
Efficient Markets: In highly efficient markets (theory suggests), past price data offers no advantage, though high-frequency trading (HFT) challenges this view.
"False Signals": Breakouts often fail (fakeouts). Professional traders anticipate these ‘liquidity grabs’ (fake breakouts that trigger stops) while novices get trapped by them.
FAQ
Is technical analysis effective for long-term investing?
Yes, technical analysis aids long-term investing by optimizing entry and exit points. While fundamentals dictate what to buy, technicals help investors avoid buying at market tops or selling during temporary corrections.
Can technical analysis be used for cryptocurrency?
Absolutely. Cryptocurrency markets are highly speculative and driven by retail sentiment, making them exceptionally responsive to technical analysis, specifically support/resistance zones and psychological chart patterns.
What is the best timeframe for technical analysis?
The "best" timeframe depends on the trader's style. Day traders rely on 5-minute to 1-hour charts, while swing traders focus on 4-hour and Daily charts. However, all analysis should begin with a higher timeframe to establish the dominant trend.
Action Plan for you Right Now: Use the workflow above to build a simple trading plan, then practice it in a paper trading account.