Day Trading Strategy Fundamentals for Beginners
Understanding Market Structure in Day Trading
Learning profitable day trading strategies, starts with understanding market structure, technical analysis, and risk management techniques like how experienced traders use them. It helps beginners and seasoned traders refine their approach for consistent profitability.
Before implementing any cfd day trading strategy, it's essential to understand the structure of the market you're trading. Different markets—stocks, forex, futures, or cryptocurrencies—have unique characteristics:
Stock Markets: Influenced by company fundamentals, sector trends, and overall market sentiment
Forex Markets: Driven by macroeconomic factors, interest rate differentials, and geopolitical events
Futures Markets: Affected by supply and demand dynamics, seasonality, and underlying cash markets
Cryptocurrency Markets: Impacted by technology developments, regulatory news, and market adoption
These clear structural differences should help you identify which strategies work best in specific market conditions and can effectively help you decide a market to trade in.
Selecting the Right Time Frames for Your Day Trading Strategy
Day traders typically focus on shorter time frames, but successful traders often incorporate multiple time frame analysis:
1-minute and 5-minute charts: Used for precise entry and exit timing
15-minute and 30-minute charts: Help identify intraday trends and support/resistance levels
1-hour and 4-hour charts: Provide context for the broader intraday trend
Daily charts: Offer perspective on key levels and overall market direction
Using multiple time frames creates a more comprehensive view of market conditions and helps avoid false signals often appearing in lower time frames.
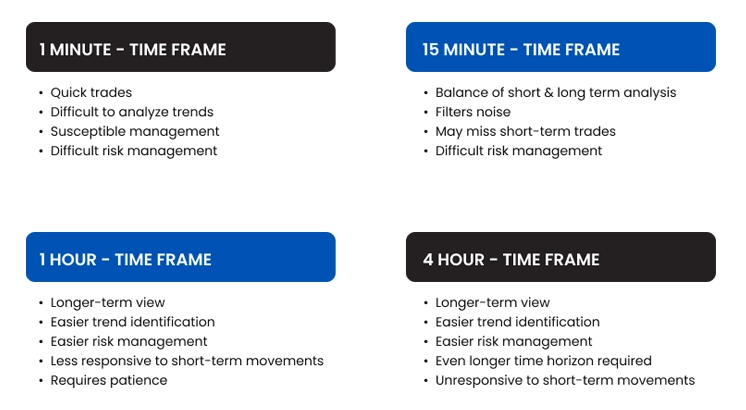
Figure 1: Informational chart titled "Day Trading Time Frames", explaining different time frames used in day trading and their respective advantages and challenges
Core Risk-Management Principles for Traders
Before exploring specific strategies, it's crucial to establish sound risk management principles. A key rule is to never risk more than 1-2% of your trading capital on a single trade, ensuring that losses remain manageable. Maintaining a risk-reward ratio of at least 1:1.5, preferably 1:2 or higher, also helps maximize gains relative to potential losses.
Hard stop-losses are essential to protect against unexpected market movements and prevent significant drawdowns. Lastly, tracking performance metrics allows traders to identify strengths and weaknesses, enabling continuous improvement. These fundamentals form the foundation for profitable and sustainable day trading strategies.
Top Profitable Day Trading Strategies
Trend-Following Strategy That Works
Trend following remains one of the most reliable approaches to day trading, based on the principle that prices tend to continue moving in the same direction until a significant shift occurs.
Mastering the Moving-Average Trading Strategy
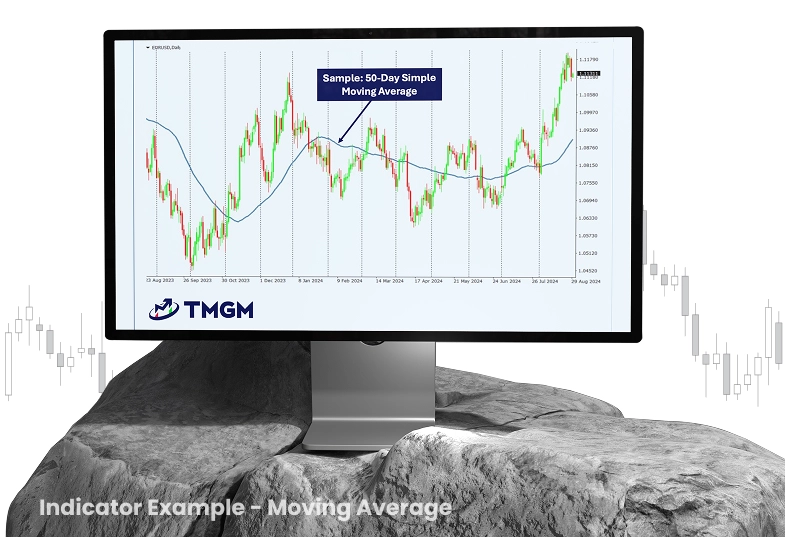
Figure 2: Technical analysis chart showing the EUR/USD (Euro/US Dollar) currency pair on a daily timeframe with a 50-day Simple Moving Average (SMA) applied
This strategy uses moving averages to identify trend direction and potential entry points:
Plot two moving averages—typically a 20-period EMA and a 50-period EMA
Enter long when the shorter MA crosses above, the longer MA
Enter short when the shorter MA crosses below, the longer MA
Place stop-loss orders below recent swing lows (for longs) or above recent swing highs (for shorts)
Take profit at predefined levels or when moving averages signal a potential reversal
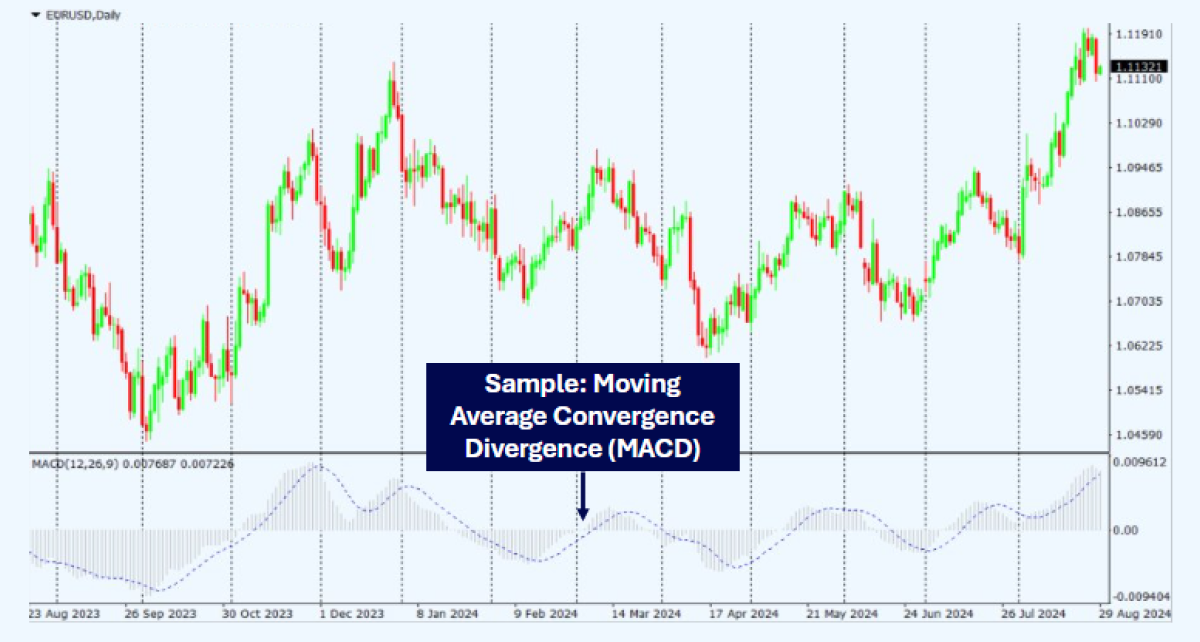
MACD Trend-Trading: Day Trading Tool
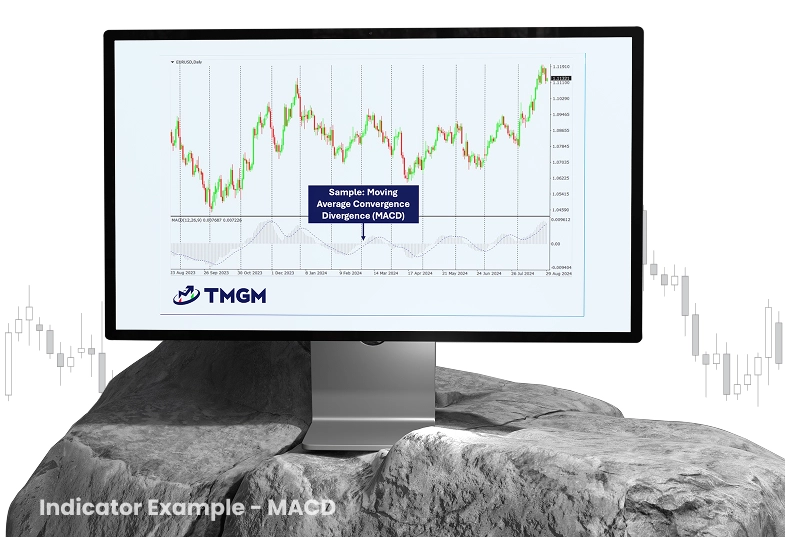
Figure 3: Technical analysis chart illustrating the use of the Moving Average Convergence Divergence (MACD) indicator on the EUR/USD daily chart
The Moving Average Convergence Divergence (MACD) indicator helps identify trend strength and potential reversals:
Enter long positions when the MACD line crosses above the signal line during an uptrend
Enter short positions when the MACD line crosses below the signal line during a downtrend
Confirm signals with additional indicators like RSI or volume
Exit when the MACD line crosses back in the opposite direction
Reversal-Trading Strategy to Capture Market Turns
Reversal strategies aim to capture the beginning of new trends as markets change direction.
Oversold/Overbought Reversals
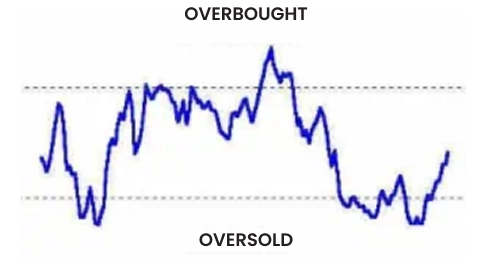
Figure 4: Technical analysis chart illustrating the concept of overbought and oversold conditions, commonly associated with momentum indicators like the Relative Strength Index (RSI) or Stochastic Oscillator.
This strategy uses momentum oscillators like Relative Strength Index (RSI) to identify potential reversal points:
Identify extremely overbought markets (RSI above 70) or oversold (RSI below 30)
Look for divergence between price and oscillator (price makes new highs/lows while indicator doesn't)
Wait for confirmation candles (engulfing patterns, hammer/shooting star, etc.)
Enter positions with tight stop-losses beyond the extreme price point
Take profit at key resistance/support levels or when price momentum wanes
Another Reversal strategy is called Mean Reversion Strategy. The Mean-reversion strategy is based on the idea that prices tend to shift back to their historical averages. By analysing moving averages, MACD, regression lines, and other indicators, traders can identify potential reversal points and trade to profit once they revert to the expected price range.
Double-Top & Bottom Formations Explained
This pattern-based strategy targets reversals at key technical levels:
Identify markets that have tested the same support/resistance level twice
Enter short positions when the price breaks below the "neckline" after a double top
Enter long positions when the price breaks above the "neckline" after a double-bottom
Place stop-losses above/below the pattern
Target profits at a distance equal to the height of the pattern
Breakout Trading Strategies: Perfect for Super Alpha Return
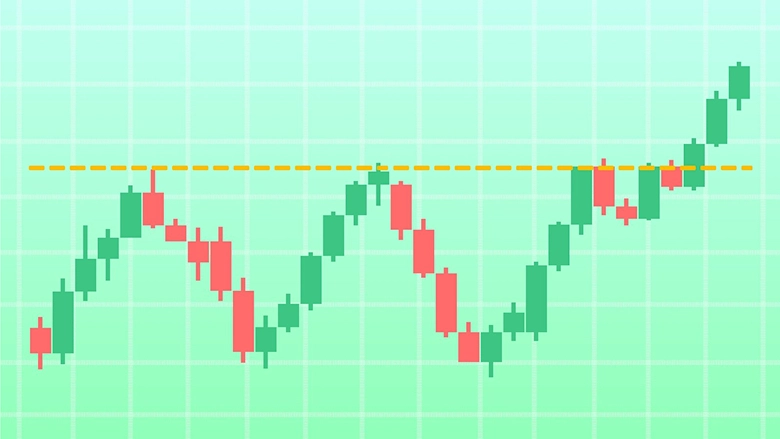
Figure 5: Illustrates a resistance breakout, a key concept in technical analysis used by traders to identify potential trend reversals or continuations
Breakout strategies capitalize on significant price movements when markets break through established support or resistance levels.
Range-Breakout Strategy: Capturing Early Moves
Identify markets trading in a defined range (between clear support and resistance)
Wait for the price to approach range boundaries with increasing volume
Enter long positions when the price breaks above resistance or short positions when the price breaks below support
Place stop-losses just inside the broken range
Target profits at a distance equal to the height of the range
Opening-Range Breakout for Intraday Success
This strategy takes advantage of the initial trading range established during the market opening:
Define the high and low of the first 30 minutes (or first hour) of trading
Enter long positions when the price breaks above the opening range high
Enter short positions when the price breaks below the opening range low
Place stop-losses at the opposite end of the range
Take profits at key support/resistance levels or use a trailing stop
Scalping Techniques: Quick-Fire Profits
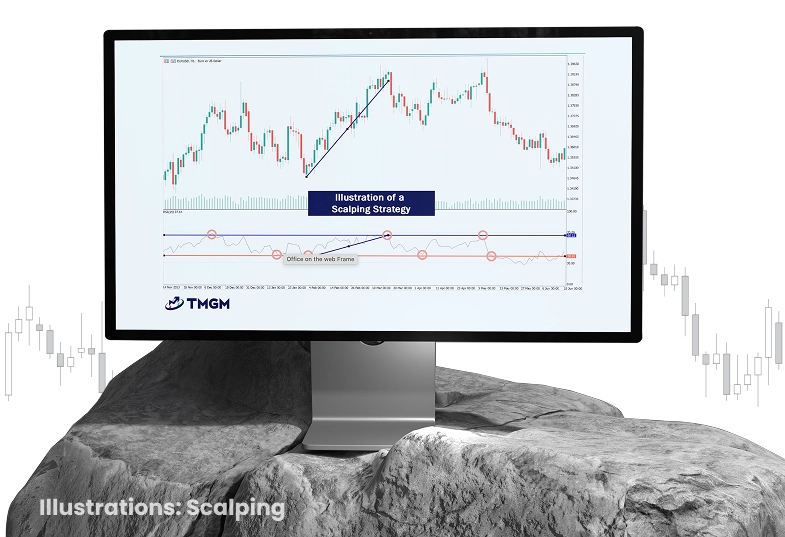
Figure 6: Illustrates a scalping strategy applied to a EUR/USD (Euro/US Dollar) forex chart on an H1 (hourly) timeframe
Scalping involves making numerous daily trades, aiming to profit from small price movements.
Bid-Ask-Spread Scalping Tactics
This technique works particularly well in forex and futures markets:
Identify assets with tight bid-ask spreads
Enter positions in the direction of the immediate short-term trend
Aim for 5-10 pip/tick profits
Use tight stop-losses (typically 2-5 pips/ticks)
Exit positions quickly, usually within minutes
Order-Flow Scalping: Reading Market Depth
This advanced technique uses order flow analysis to identify institutional buying and selling:
Use time and sales data and/or depth of market information
Look for large orders or imbalances between buy and sell orders
Enter in the direction of the dominant order flow
Exit when the order flow imbalance subsides
Maintain extremely tight risk management with predefined stop-losses
Gap-Trading Approaches for Intraday Moves
Gap trading capitalizes on price gaps between the market close and the next day's opening.
Gap-Fill Strategy: Trading Overnight Gaps
Identify stocks or futures that open with a significant gap from the previous day's close.
Analyze the gap type (common gap, breakaway gap, runaway gap, or exhaustion gap)
For common gaps, enter positions expecting the gap to be filled (price returns to the previous close)
For breakaway or runaway gaps, enter positions in the direction of the gap
Place stop-losses beyond key support/resistance levels
Take profits when the gap is filled or at predetermined price targets
News Trading Tactics for Day Trading Beginners
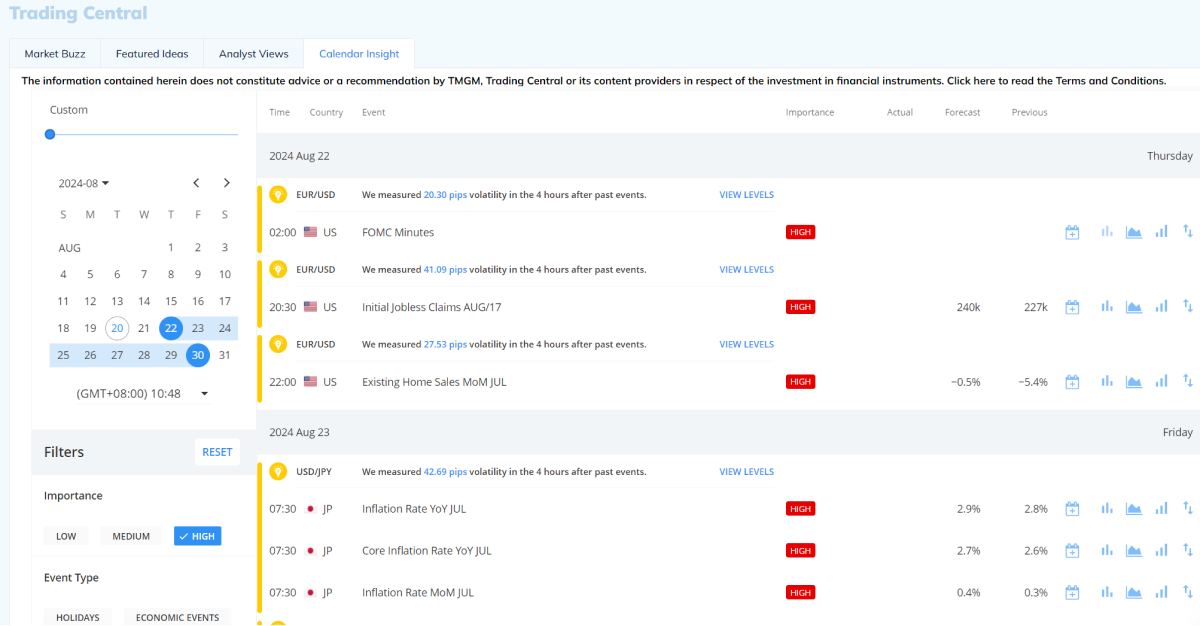
This strategy involves trading based on economic news and market events. By staying informed about scheduled announcements and reacting quickly to the latest news and information, you can capitalise on the market volatility surrounding these events, as most financial news are scheduled in advance in the economic calendar(such as the latest economic updates, job forecasts, and company earnings reports).
This allows you to capitalize on volatility, while technical analysis dominates day trading, "News Trading" exploits the immediate volatility caused by economic releases.
Identify High-Impact Events: Use the Economic Calendar to track "Red Folder" events like Non-Farm Payrolls (NFP), CPI Inflation data, or Central Bank rate decisions.
Understand Asset Correlation: As noted in our basics, Crude Oil reacts heavily to inventory reports, while Gold is sensitive to USD inflation data.
The Straddle Setup: Place pending buy stop and sell stop orders above and below the consolidation range 5 minutes before the news release.
Risk Management: Volatility can cause slippage. Use wider stops or guaranteed stops during high-impact news.
Essential Technical Analysis Tools for Day Trading Strategies
Must-Know Technical Indicators
Successful day traders typically utilize a combination of the following technical indicators:
Moving Averages (SMA & EMA): Identify trend direction and potential support/resistance
Using RSI for Overbought/Oversold Signals: Measure overbought/oversold conditions
Stochastic Oscillator for Entry Timing: Identify potential reversal points
Bollinger Bands for Volatility Breakouts: Determine volatility and potential price targets
VWAP (Volume-Weighted Average Price) Tactics: Benchmark for intraday price action
ATR-Based Stops: Adapting to Volatility: Measure volatility for stop-loss placement
The key is not to use too many indicators simultaneously but to select complementary tools that address different aspects of price action.
Chart Patterns Every Day Trader Should Master
Recognizing high-probability chart patterns can significantly enhance trading performance by providing insights into potential price movements. Continuation patterns, such as flags, pennants, and triangles, indicate that the prevailing trend will likely persist. Reversal patterns, including head and shoulders, double tops/bottoms, and island reversals, signal potential trend reversals and key turning points in the market.
Additionally, candlestick patterns, such as engulfing patterns, doji, hammer, and shooting star, offer valuable insights into market sentiment and momentum shifts. Each pattern helps traders identify optimal entry and exit points while also providing natural locations for stop-loss and take-profit levels, improving risk management and overall strategy execution.
Volume-Analysis Techniques for Better Entries
Volume confirms price action and provides invaluable insights:
Spotting Volume Spikes for Confirmation: Often indicate potential reversals or breakouts
Identifying Volume Divergence to Validate Trends: When price makes new highs/lows but volume doesn't confirm
Leveraging Relative Volume Effectively: Comparing current volume to average volume helps identify unusual activity
Day traders should always confirm price signals with corresponding volume activity for higher-probability trades.
Psychological Aspects of Successful Day Trading Strategies
Managing Emotions During Live Trading
Emotional control is one of the most critical factors that separate profitable day traders from unsuccessful ones. Fear often leads to premature exits or hesitation in entering valid setups. Greed can result in holding positions for too long or increasing position sizes inappropriately. Revenge trading, the urge to recover losses through higher-risk trades, is particularly destructive. Successful day traders develop systematic approaches to combat these emotional responses and maintain discipline.
Cultivating a Winning Trading Mindset
A proper trading mindset is essential for long-term success. Probability thinking helps traders understand that no single trade guarantees success. Process orientation shifts the focus from immediate profit and loss to strategy execution. Detachment from outcomes allows traders to make decisions without emotional bias. Additionally, continuous learning ensures that each trade becomes a learning opportunity for improvement.
Building Discipline for Consistent Results
Discipline in day trading means strictly following a trading plan and risk management rules without exception. Traders should only take setups that meet their predefined criteria. Keeping detailed trading journals allows for performance tracking and identifying areas for improvement. Regularly reviewing trades ensures traders stay on track and make necessary adjustments to enhance their strategy.
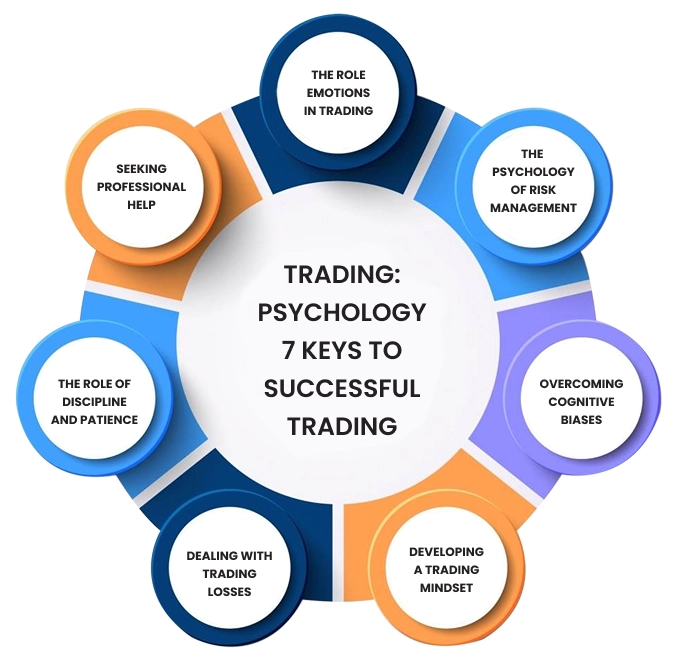
Figure 7: Psychological aspects of successful trading by outlining seven key principles traders should master.
Building Your Day Trading Strategy System
A comprehensive trading plan is essential for maintaining consistency and structure in day trading. It should define the markets and time frames to trade, along with specific entry and exit criteria to identify trade setups. Position sizing guidelines help manage risk, while risk management rules ensure capital protection. Establishing a trading schedule and routine promotes discipline, and a performance review process allows for continuous strategy refinement. A well-documented plan should be so clear that another trader could execute it precisely as intended.
How to Backtest Your Day-Trading Strategy
Before committing to real capital, traders must backtest their strategies to evaluate performance and reliability. This involves collecting historical data for the target markets and applying strategy rules to past price actions.
Recording hypothetical trades and outcomes provides insights into profitability, while key performance metrics such as win rate, profit factor, and drawdown help measure risk and consistency. Based on these results, traders can refine their strategies to enhance effectiveness before live trading.
Forward-Testing & Paper-Trading Best Practices
Following backtesting, traders should paper trade in real-time market conditions before risking actual capital. This step allows them to assess execution quality, understand emotional responses, and identify practical challenges that may not have been apparent during backtesting.
By making final adjustments, traders can refine their systems further. When transitioning to live trading, starting with small position sizes helps minimize risk while building confidence in real-market conditions.
Risk Management in Day Trading Strategies
Risk management is the backbone of successful day trading. Even the best trading setups can lead to significant losses without a solid strategy. Here’s how to manage risk effectively:
Position-Sizing Fundamentals
Position sizing controls how much of your capital is exposed in a single trade.
Risk per trade: Stick to 1-2% of your total account balance per trade.
Position-Size Formula: Position Size = Money at Risk ÷ Stop-Loss in Pips (or Points)
Managing Drawdowns to Stay in the Game: If your account is $20,000 and you risk 1% per trade ($200), and your stop-loss is 20 pips, your position size should be $200 ÷ 20 pips = $10 per pip.
Leverage Caution - Using Margin Responsibly: Higher leverage increases exposure. Always align leverage with your risk tolerance.
Setting Stop-Losses to Protect Your Capital
A stop-loss order limits your loss on a trade if the market moves against you.
Types of stop-losses:
Fixed stop-loss: A set percentage (e.g., 1% of capital).
ATR-based stop-loss: Uses the Average True Range (ATR) to adjust stop distances based on volatility.
Technical stop-loss: Placed at support/resistance levels, trendlines, or moving averages.
Trailing stop-loss: Adjusts as the trade moves in your favor, locking in profits while protecting the downside.
Example:
Buying at $100 with a 2% stop-loss → Stop set at $98.
In forex, if ATR is 15 pips, the stop-loss could be 1.5 × ATR = 22.5 pips.
Managing Drawdowns to Stay in the Game
A drawdown is the reduction in account value after a series of losses.
Max drawdown limit: Stop trading if you hit a 5-10% monthly drawdown.
Risk-reward ratio: Aim for at least 1:2 risk-reward (risk $1 to make $2).
Reducing risk in a losing streak:
If the losing streak continues, cut risk per trade in half.
Reassess strategy—are market conditions unfavorable, or is execution flawed?
Example:
A trader starts with $10,000 and loses $1,000 (10% drawdown).
They reduce position size and focus on higher-probability trades.
Elevate Your Day Trading Strategies with TMGM
Implementing profitable day trading strategies requires knowledge and the right trading environment. TMGM provides traders with the ideal platform to execute these strategies effectively:
Lightning-Fast Execution: Execute your day trading strategies with minimal slippage
Finding Competitive Spreads for Cost Efficiency: Maximize your profit potential with tight spreads across all markets
Advanced Trading Platforms: Access professional-grade charting, indicators, and execution tools
Multi-Asset Trading: Implement your strategies across forex, stocks, indices, commodities, and cryptocurrencies
Top Risk-Management Tools for Day Traders: Utilize guaranteed stop-losses and other risk management features
Best Educational Resources for Beginners: Continue developing your trading skills with TMGM's comprehensive educational materials
Leverage 24/5 Expert Support from TMGM: Get assistance whenever you need it from experienced trading professionals
Whether focusing on trend following, breakout trading, or scalping strategies, TMGM provides professional infrastructure, advanced trading tools, and our trading academy needed to execute your day trading plan with precision.
Ready to apply these profitable day trading strategies? Open an account with TMGM today and experience the difference a professional trading environment can make to your trading results.