
Bitcoin Price Forecast: Institutional selling, Middle East tensions keep BTC under pressure
By Manish Chhetri
Updated: 8 Jun 2026


POPULAR ARTICLES

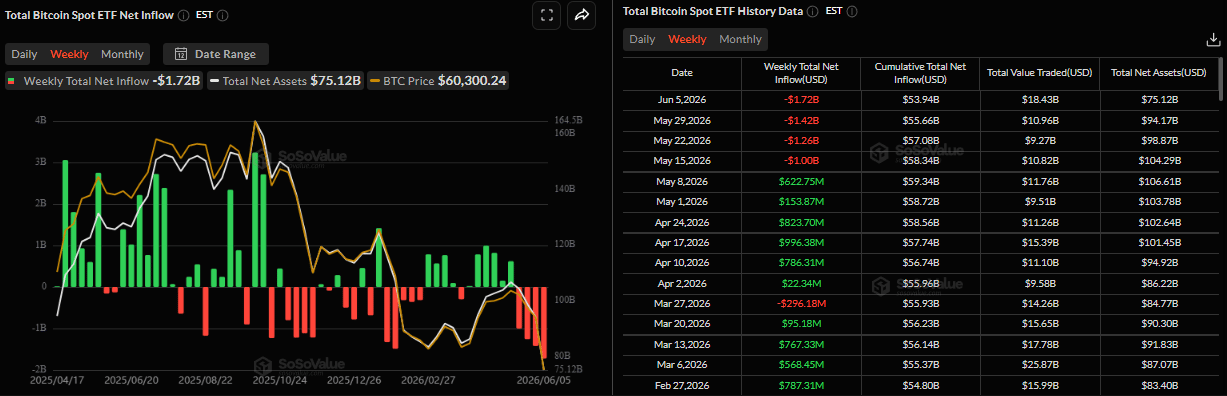
Bitcoin (BTC) remains under pressure, struggling below $64,000 on Monday after posting its worst one-week return this year. Institutional sell-off remains severe with spot Exchange Traded Funds (ETFs) recording the fourth week of steady outflows of billions since mid-May.
- Bitcoin struggles below $64,000 on Monday after posting its worst one-week return this year, down over 14%.
- Institutional sell-off remains severe with spot ETFs recording the fourth week of steady outflows of billions since mid-May.
- Escalating tensions between Israel and Iran continue to dampen risk appetite, weighing on risk-sensitive assets such as BTC.
Bitcoin (BTC) remains under pressure, struggling below $64,000 on Monday after posting its worst one-week return this year. Institutional sell-off remains severe with spot Exchange Traded Funds (ETFs) recording the fourth week of steady outflows of billions since mid-May. Meanwhile, escalating tensions between Israel and Iran continue to dampen risk appetite, weighing on risk-sensitive assets such as Crypto King and potentially capping its recovery.
Billions in sell-off continue
Institutional demand fell severely, leading to a sharp correction in Bitcoin. SoSoValue weekly data show that spot BTC ETFs recorded an outflow of $1.72 billion last week, making it the fourth consecutive week of billions in weekly outflows, signaling weakening institutional demand and potentially leading to a price decline. If this trend continues, BTC could see further correction this week.
Middle East tension weighs on risk sentiment
The Israel-Iran conflict has entered a dangerous new phase, with both sides exchanging attacks across multiple fronts. Israel said that it carried out fresh strikes on military targets in western and central Iran after the latter fired waves of ballistic missiles at Israel’s Ramat David air base on Sunday night. The tensions have spilled beyond the two countries, with reports of Israeli strikes in southern Lebanon and Iranian military action in northern Iraq, raising fears of a wider regional conflict.
The developments threaten a fragile ceasefire and temper hopes for a deal to end a three-month-old war, assisting the safe-haven US Dollar (USD) to preserve its recent strong gains to two-month highs, while weighing on risk-sentiment assets such as Bitcoin, which remains under pressure on Monday after reaching a low of $59,130 last week.
Strategy’s mild sell-off fuels speculations
Strategy’s disclosure last week that it sold 32 BTC between May 26 and May 31 marked a notable break from a policy that had become central to Michael Saylor’s public narrative. The sale, worth roughly $2.5 million at an average price of $77,135 per Bitcoin, reduced the company’s holdings to 843,706 BTC.
In practical terms, the transaction was immaterial, representing less than 0.004% of Strategy’s treasury. However, it was the company’s first net Bitcoin sale since December 2022, when it sold 704 BTC as part of a tax-loss harvesting strategy, then quickly repurchased a larger amount. This sell-off had fueled fear, uncertainty and doubt (FUD) in the market, leading to a correction of over 14% in BTC last week.
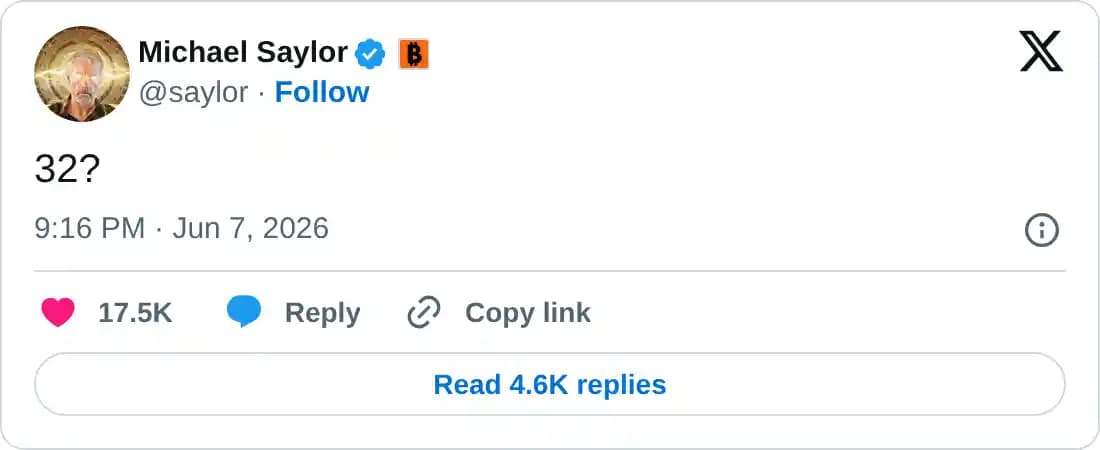
However, on Sunday, Michael Saylor posted “32?” on his X account, a cryptic message hinting at the recent sale of exactly 32 BTC, continuing his long-standing accumulation strategy.
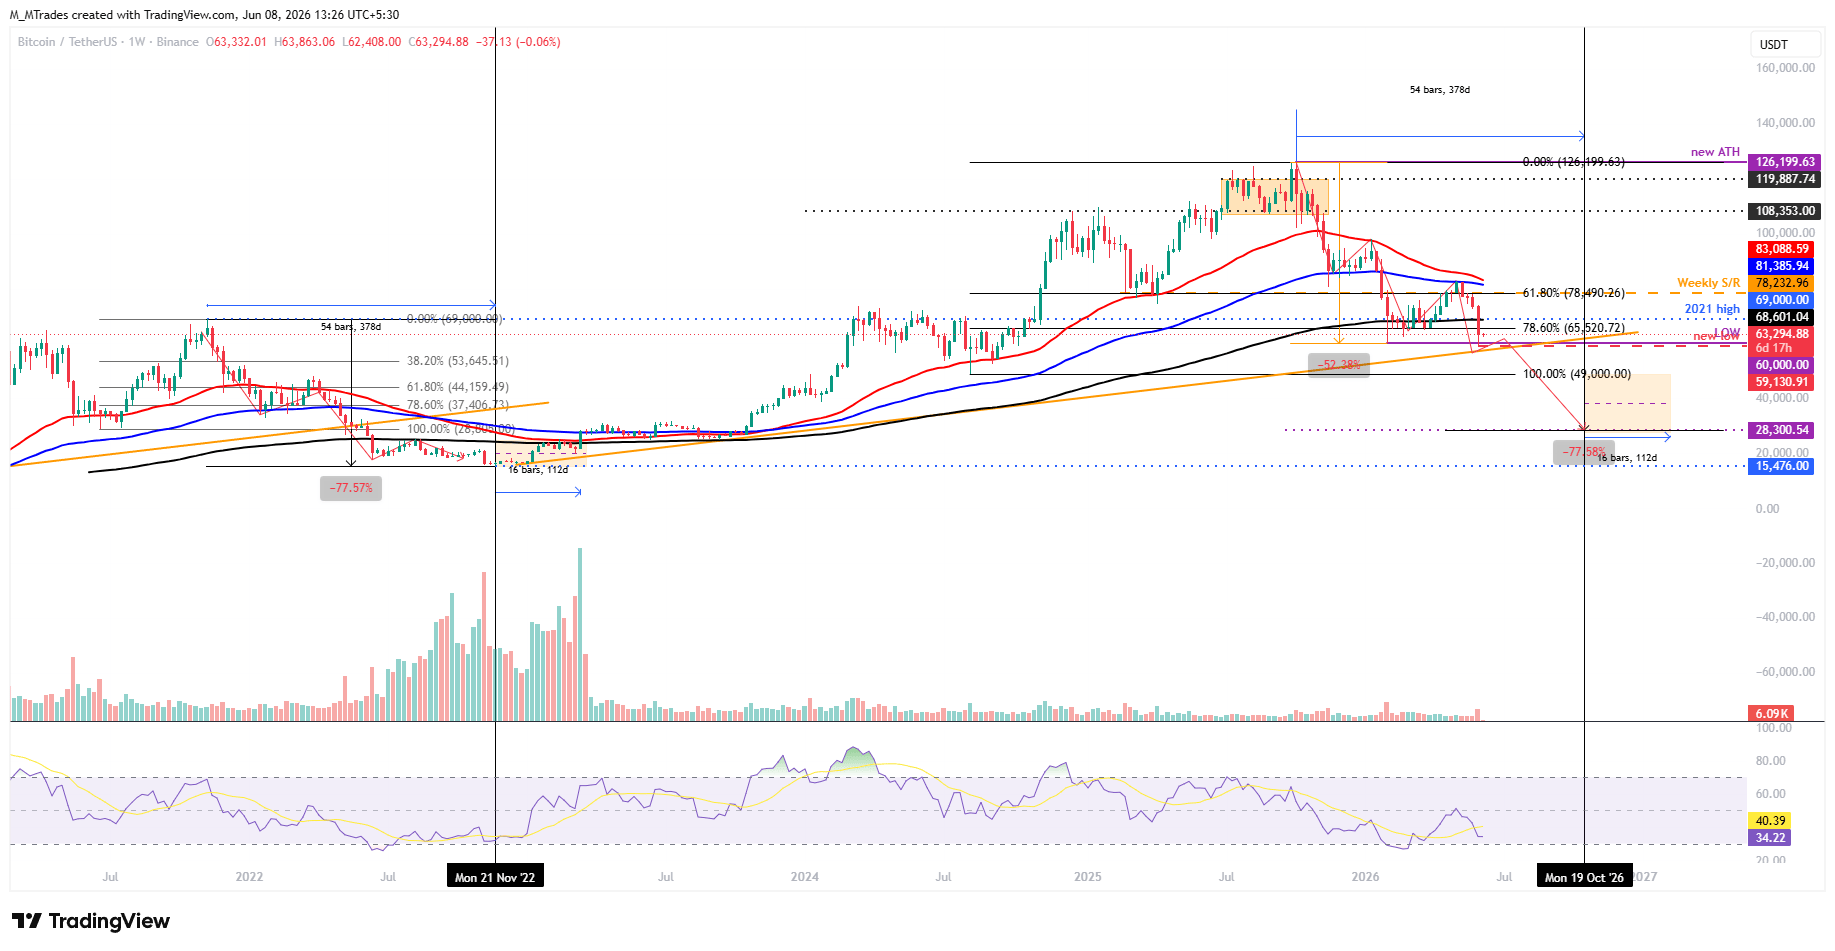
Bitcoin Price Forecast: Mirroring 2021-2022 bear market
Bitcoin’s weekly chart shows price action resembling that of the late-2021-2022 bear market. In 2021, BTC hit a new all-time high (ATH) of $69,000 in November and then corrected 77.57% from the high to the 2022 bottom of around $15,476 over 378 days. Then consolidated for the next 112 days, before the start of another bull cycle in 2023.
In the 2025-2026 period, BTC reached a new ATH at $126,199 in October 2025 and has since corrected by 52.38%, reaching a low of $60,000 in the first week of February. Then, BTC recovered within the broader downtrend, retested, and faced rejection at the 100-Week EMA around $82,000 in early May. This rally between February and early May is considered by many analysts a bull trap before the primary downtrend resumes. Since the retest of this 100-Week EMA, BTC has corrected by over 23% and reached a new low of $59,130 last week.
If the current regime follows the 2021-2022 pattern, BTC could see further correction, reaching a low of $28,300 (77.51% from the 2025 ATH) by mid-October. Then it would consolidate for the next 112 days before the start of another bull cycle (as seen in 2023, discussed above).
On the daily chart, the Crypto King trades at $63,043, extending a bearish phase with price decisively capped beneath all key Exponential Moving Averages (EMAs). The 50-day, 100-day, and 200-day EMAs at $72,901, $74,744, and $79,784, respectively, remain well overhead, reinforcing a medium-term corrective bias after the loss of the prior upward trendline, whose breakpoint near $72,792 now acts as structural resistance.
Momentum remains weak, with the Relative Strength Index (RSI) on the daily chart hovering around 26 in oversold territory and the Moving Average Convergence Divergence (MACD) deeply negative, suggesting that while downside pressure persists, the market could soon face the risk of short-covering rather than fresh, aggressive selling.
On the topside, initial resistance appears at the former horizontal barrier near $64,004, which guards the path toward the reclaimed trendline break zone and the 50-day EMA clustered around $72,800–$72,901. Above there, the 100-day EMA at roughly $74,744 and the 200-day EMA near $79,784 form successive caps ahead of the major horizontal level at $84,410.
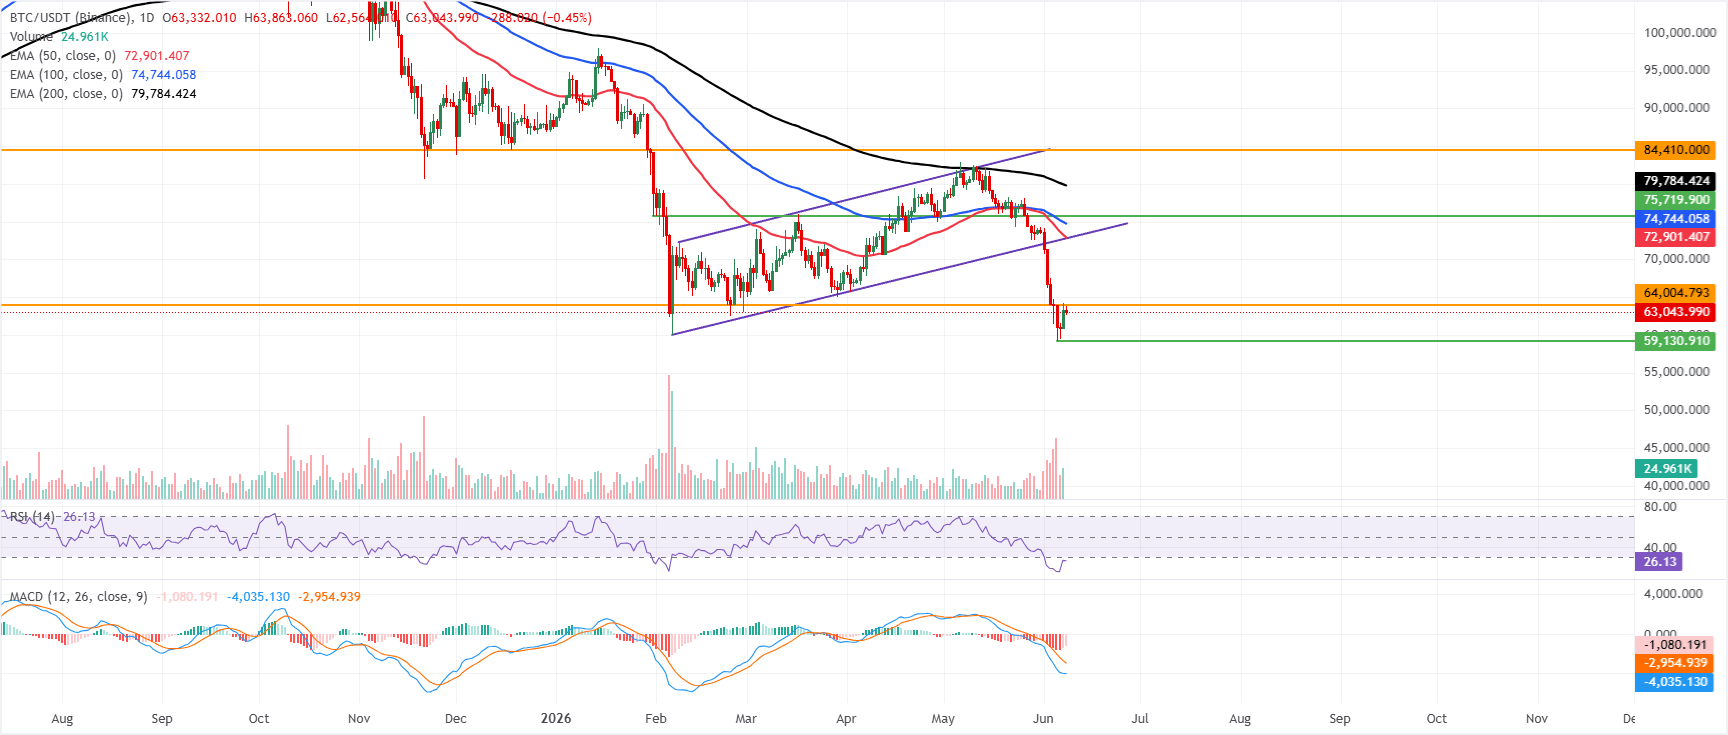
With no clearly defined support levels from the current indicator set below spot, BTC remains vulnerable to further downside probes, and sellers are likely to stay in control while price trades under the aforementioned EMA band.
(The technical analysis of this story was written with the help of an AI tool.)
Bitcoin, altcoins, stablecoins FAQs
Bitcoin is the largest cryptocurrency by market capitalization, a virtual currency designed to serve as money. This form of payment cannot be controlled by any one person, group, or entity, which eliminates the need for third-party participation during financial transactions.
Altcoins are any cryptocurrency apart from Bitcoin, but some also regard Ethereum as a non-altcoin because it is from these two cryptocurrencies that forking happens. If this is true, then Litecoin is the first altcoin, forked from the Bitcoin protocol and, therefore, an “improved” version of it.
Stablecoins are cryptocurrencies designed to have a stable price, with their value backed by a reserve of the asset it represents. To achieve this, the value of any one stablecoin is pegged to a commodity or financial instrument, such as the US Dollar (USD), with its supply regulated by an algorithm or demand. The main goal of stablecoins is to provide an on/off-ramp for investors willing to trade and invest in cryptocurrencies. Stablecoins also allow investors to store value since cryptocurrencies, in general, are subject to volatility.
Bitcoin dominance is the ratio of Bitcoin's market capitalization to the total market capitalization of all cryptocurrencies combined. It provides a clear picture of Bitcoin’s interest among investors. A high BTC dominance typically happens before and during a bull run, in which investors resort to investing in relatively stable and high market capitalization cryptocurrency like Bitcoin. A drop in BTC dominance usually means that investors are moving their capital and/or profits to altcoins in a quest for higher returns, which usually triggers an explosion of altcoin rallies.

More than a million users rely on FXStreet for real-time market data, charting tools, expert insights, and forex news. Its comprehensive economic calendar and educational webinars help traders stay informed and make calculated decisions. FXStreet is supported by a team of about 60 professionals, split between the Barcelona headquarters and various global regions.
Read More


