

Ethereum Price Forecast: US risk-off sentiment continues as onchain cost basis overhead weighs on ETH
Ethereum price today: $2,110
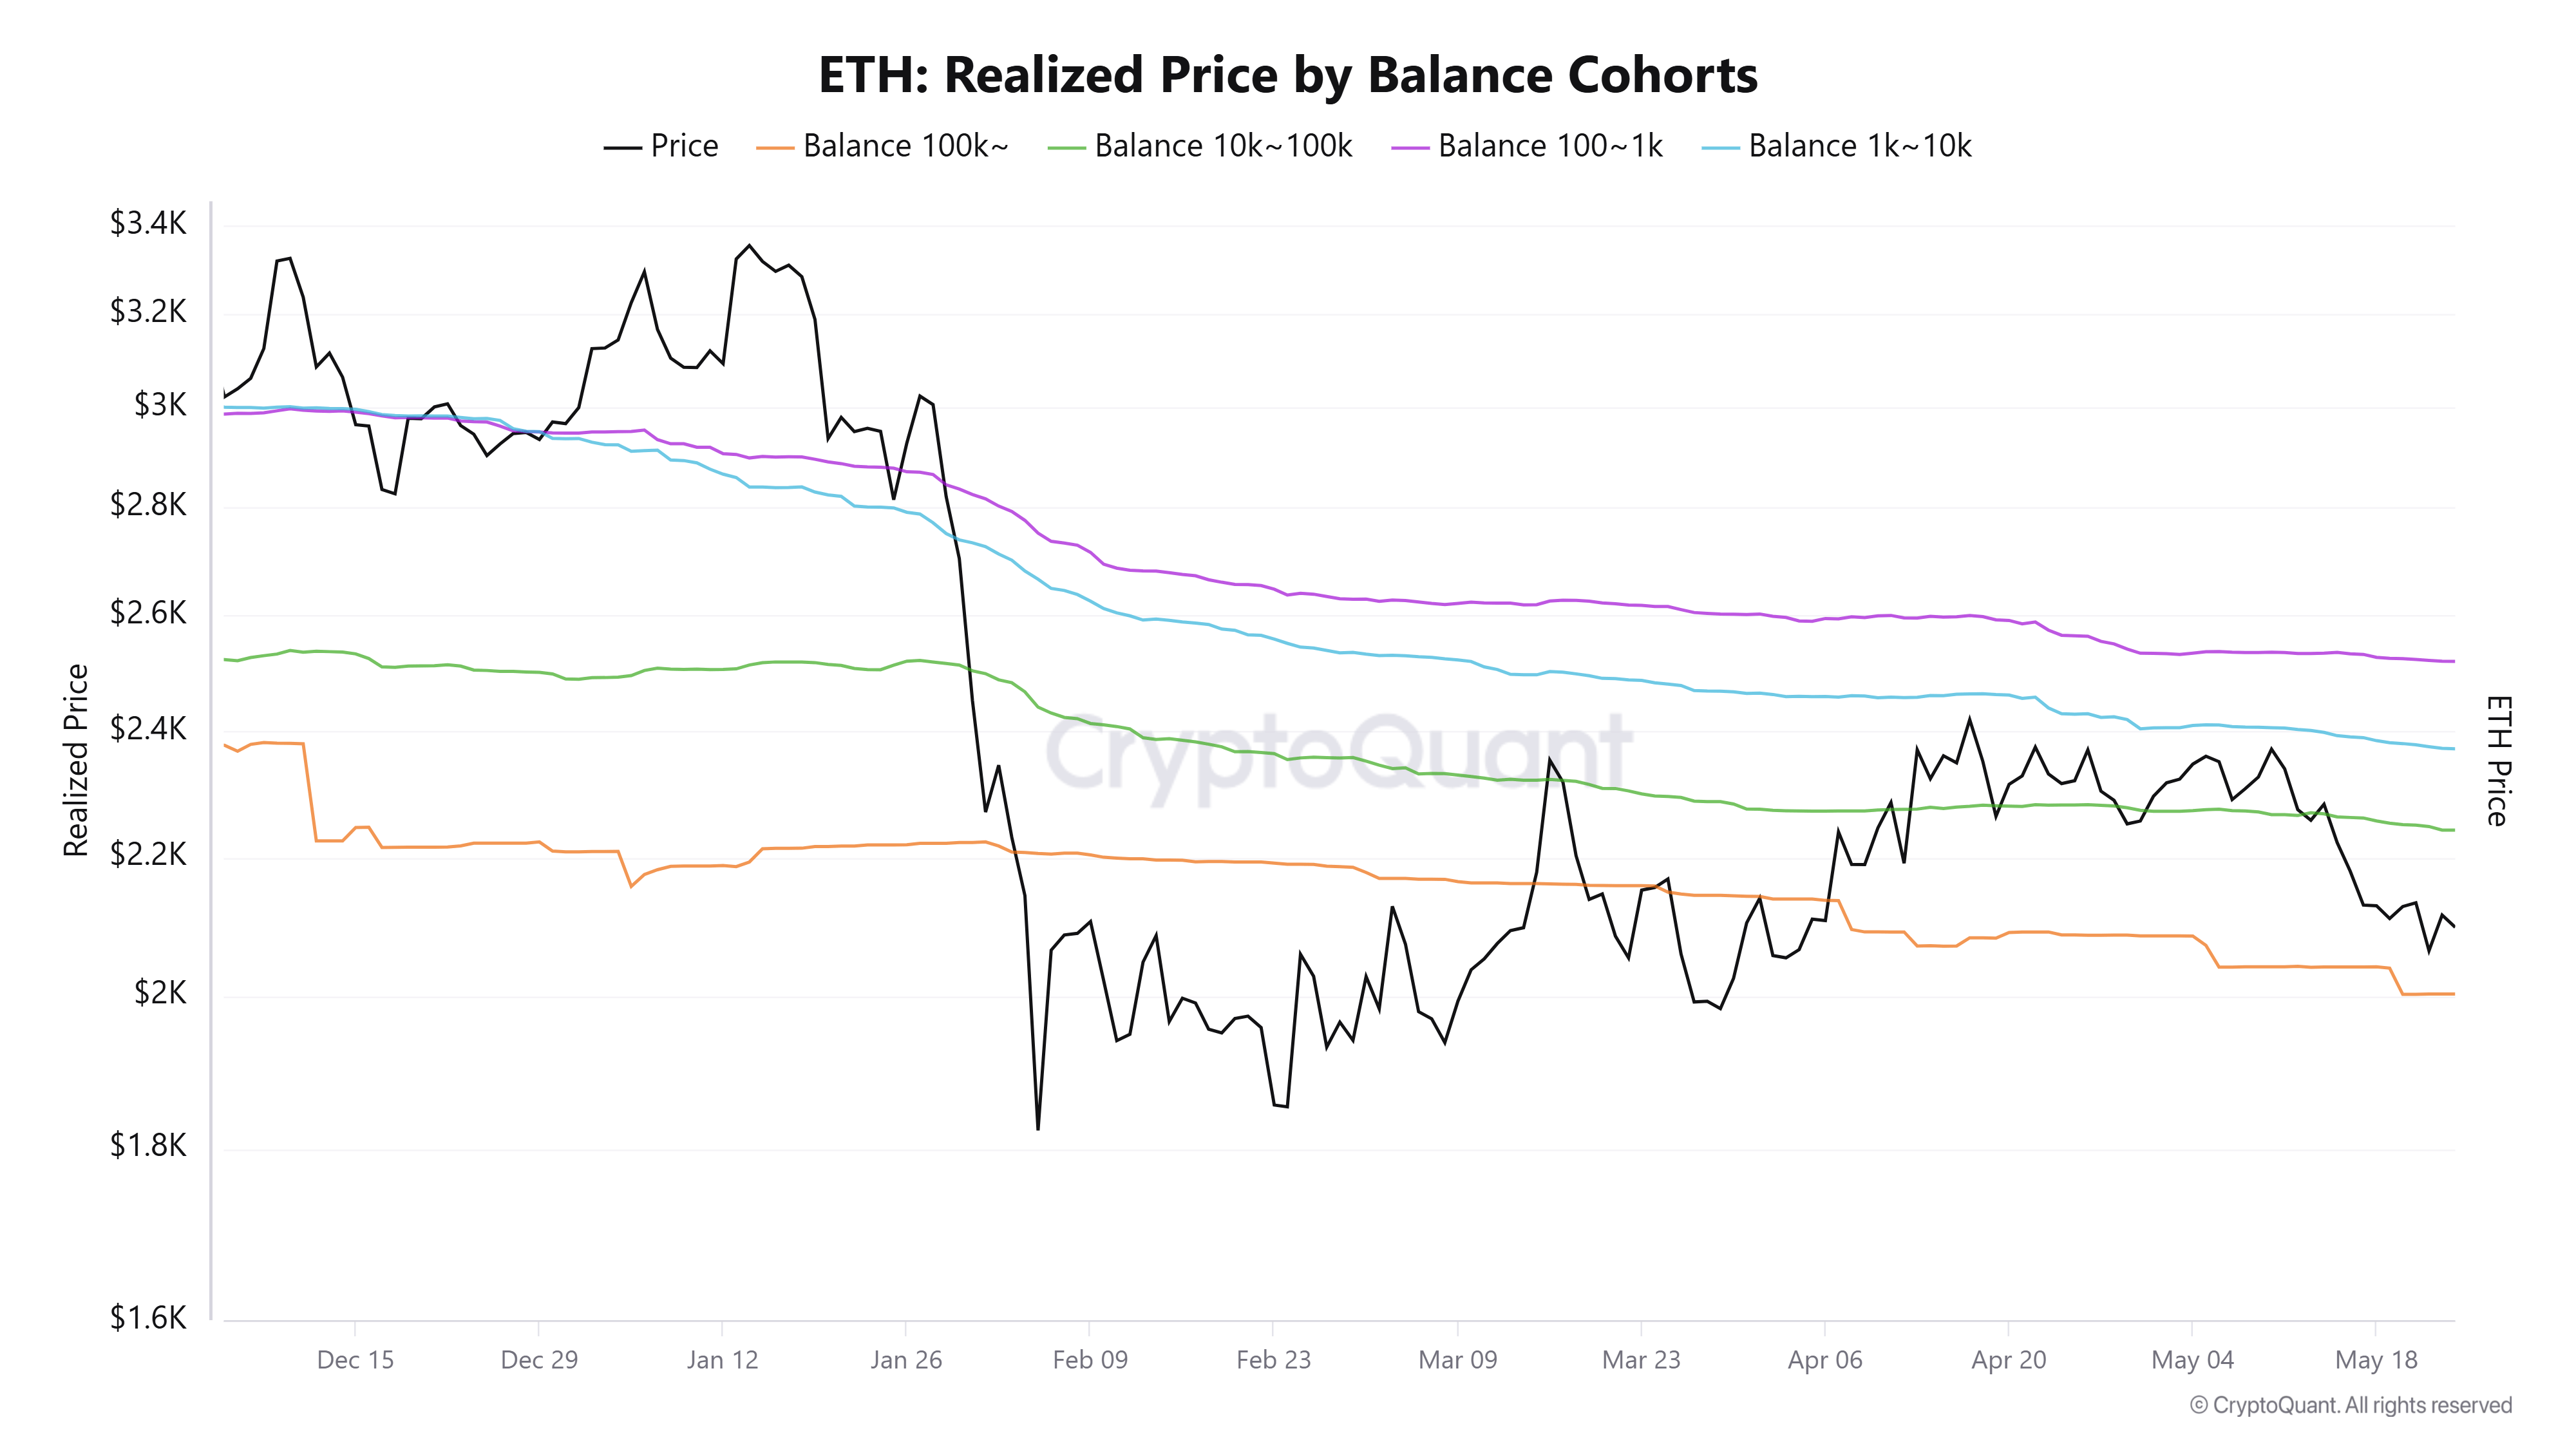
- ETH has failed to decisively break above the average onchain cost basis for key retail and whale wallets, which range from $2,200 to $2,500.
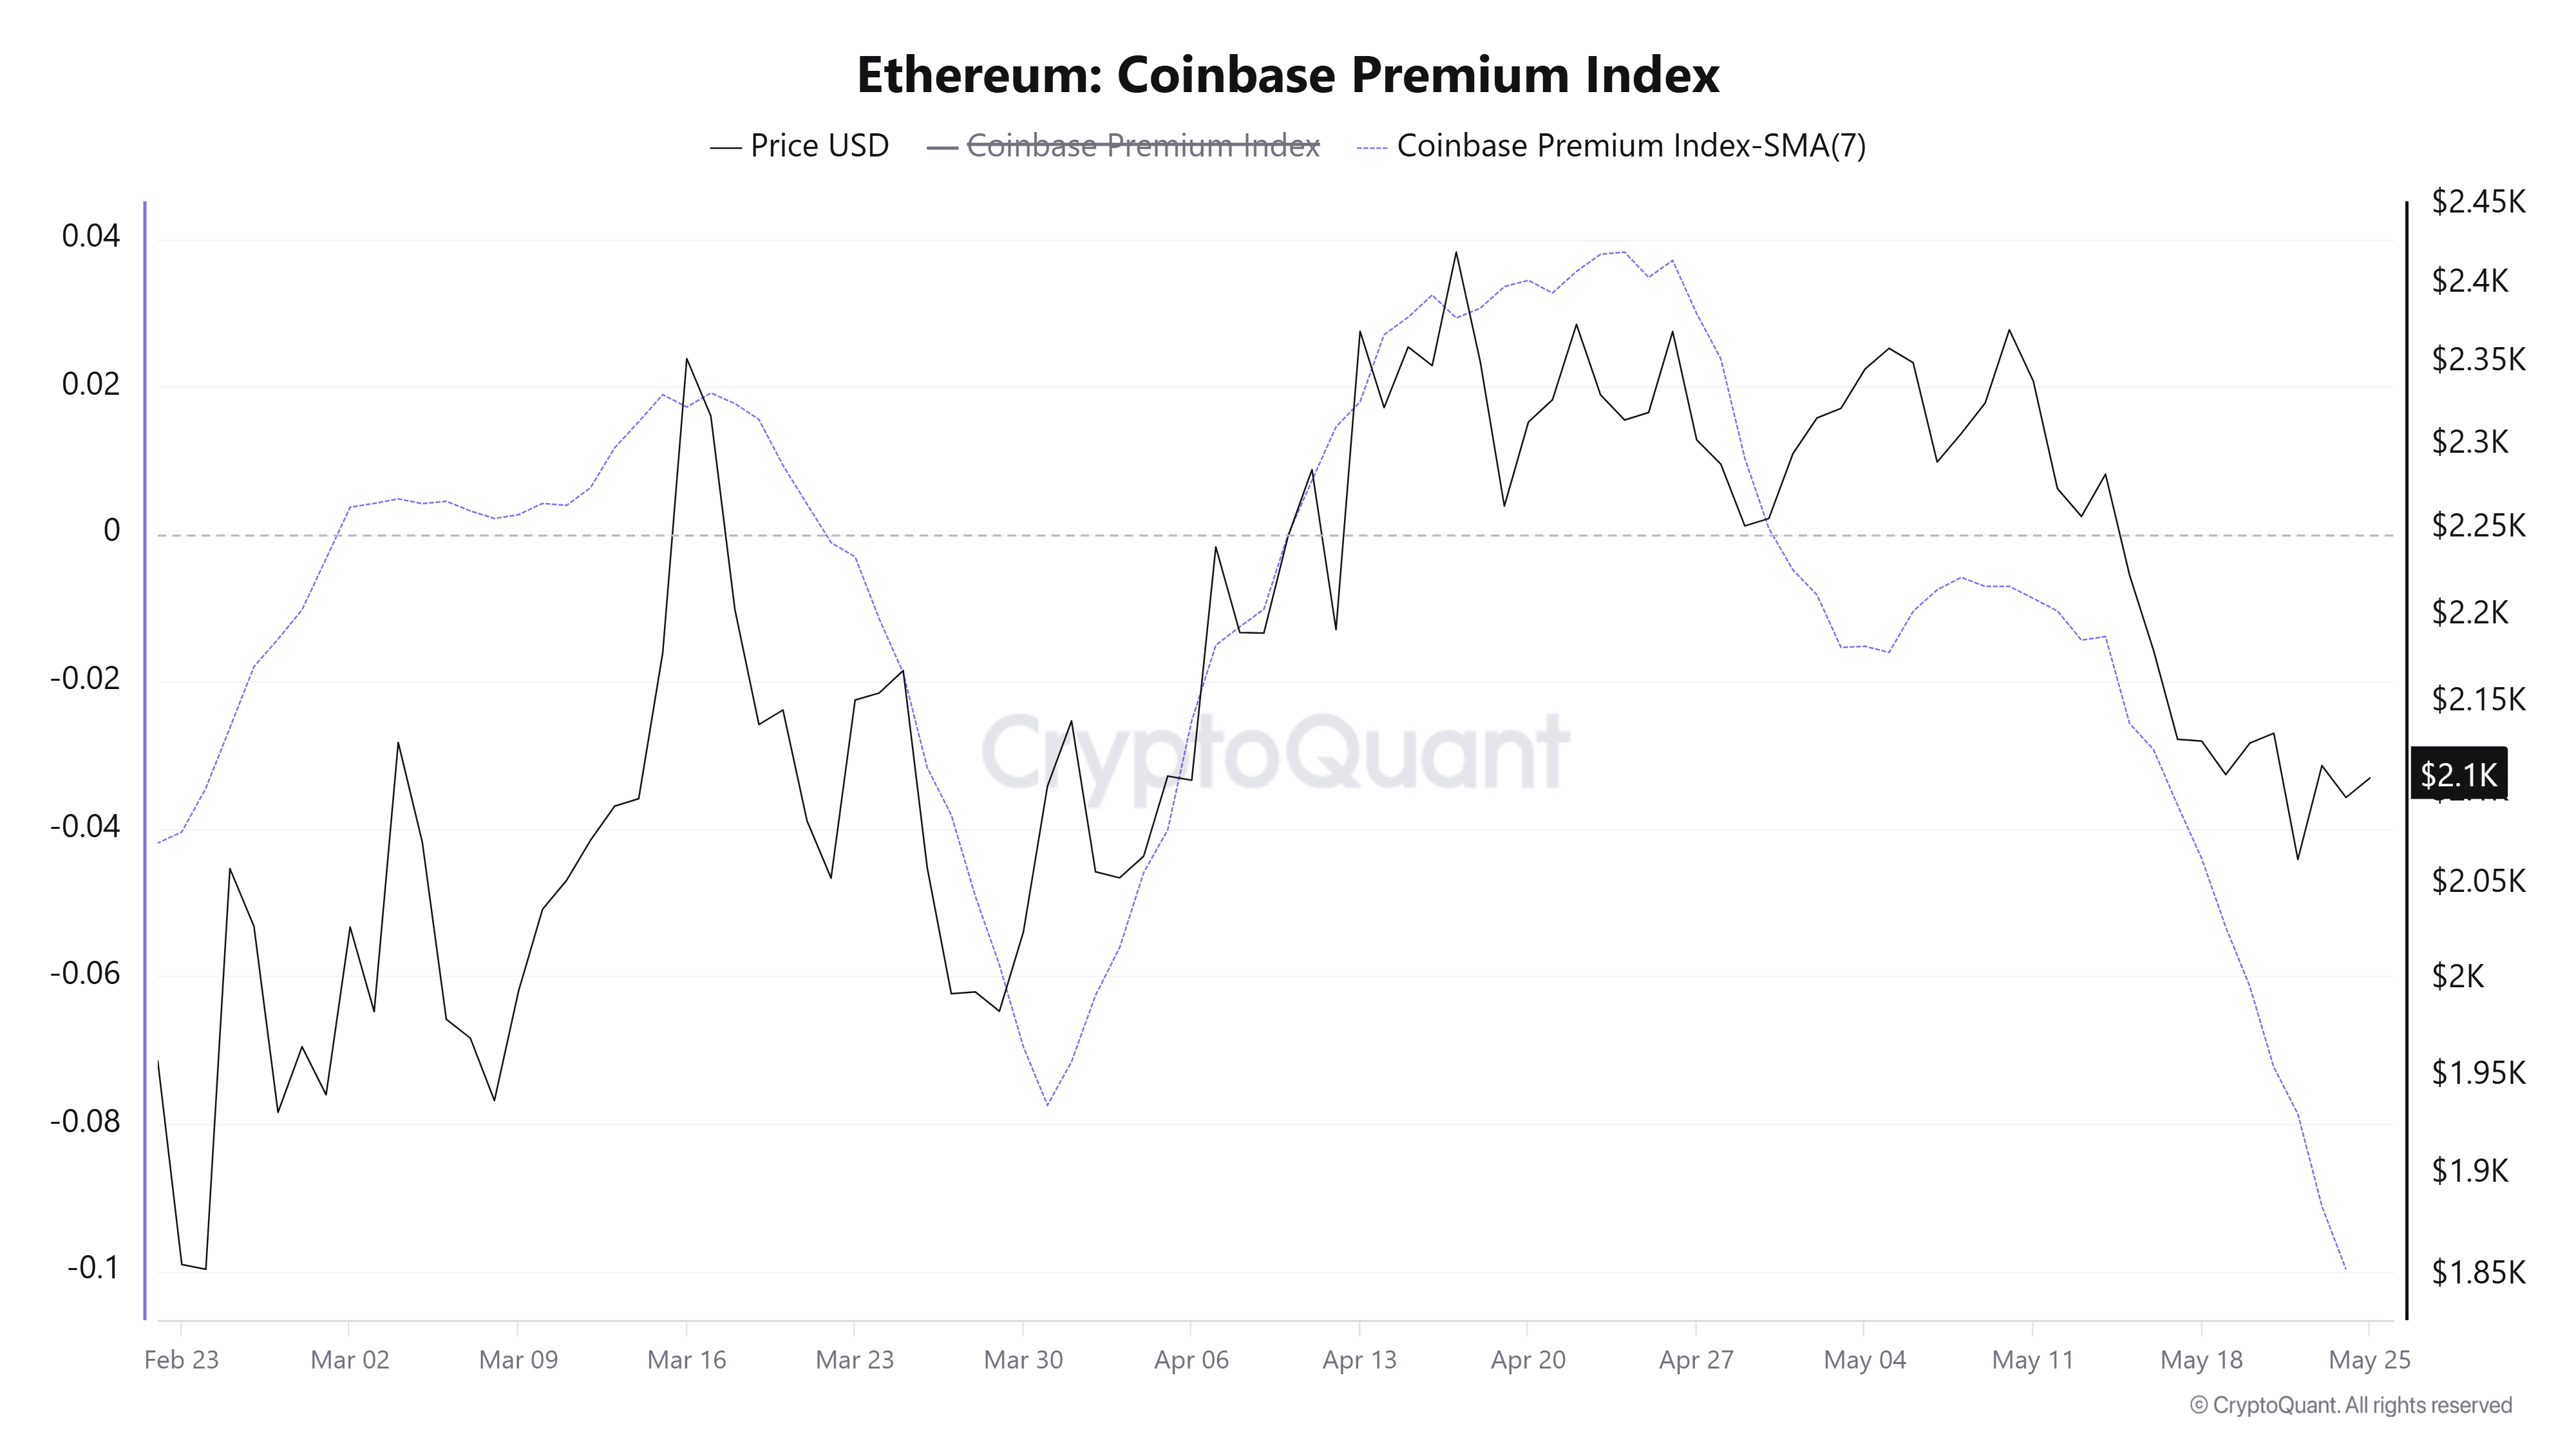
- The Coinbase Premium Index plunged deeper last week amid a ten-day net outflow streak in US spot ETH ETFs.
- ETH is eyeing a firm recovery above the $2,108 support level.
Ethereum (ETH) is up 1% on Monday, holding around the same prices as last week, as key fundamental metrics signal persistent risk-off sentiment.

Retail investors or wallets with a balance of 100-1K ETH depleted their holdings by 110K ETH last week, continuing their strong distribution pattern that dates back to November.
However, wallets with balances of 1K-10K and 10K-100K ETH (whales) saw minimal changes in their holdings, unlike last week, when they distributed, signaling that these investors may be nearing exhaustion from selling.
The price decline from previous weeks shows bulls being outweighed by supply pressure from investors potentially distributing after breaking even. This is evident in ETH failing to decisively break above the average onchain cost basis for these cohorts, which lies between $2,200 and $2,500.
Most of these distributions are potentially flowing from the US region, as observed in the Coinbase Premium Index, which is a measure of US sentiment. The metric plunged deeper last week, continuing a decline that began in late April.
A similar sentiment is seen in US spot ETH exchange-traded funds (ETFs), which recorded a second consecutive week of net outflows worth roughly $216 million, per SoSoValue data. The products are also on a ten-day outflow streak.
However, Ethereum derivatives have held up well despite price weakness, with ETH futures open interest rising slightly above 15 million ETH and funding rates remaining positive. The divergence indicates derivatives traders are buying the dip per Coinglass data.
Ethereum Price Forecast: ETH eyes a firm recovery above $2,108 support
On the daily chart, ETH retains a bearish near-term bias as price holds beneath the 20-, 50- and 100-day Exponential Moving Averages (EMAs), clustered between roughly $2,183 and $2,308.
Meanwhile, the Relative Strength Index (RSI) near 39 suggests weak demand, even as the Stochastic Oscillator (Stoch) recovers from oversold territory, hinting that any rebound could struggle against the stacked overhead EMAs.
On the topside, initial resistance appears at the 20-day EMA around $2,183, followed by the horizontal barrier at $2,211 and the 50-day EMA near $2,221. Beyond these, the 100-day EMA at $2,308 and the next horizontal cap at $2,388 form a broader supply zone, followed by higher levels at $2,746 and $3,411.
On the downside, immediate support lies at $2,018 and $1,909 if ETH fails to hold above $2,108, while deeper declines would expose $1,741.
(The technical analysis of this story was written with the help of an AI tool.)














