
Pi Network Price Forecast: PI sways as OKX expands PI token in the US market
By Vishal Dixit
Updated: 21 May 2026


POPULAR ARTICLES

Pi Network (PI) edges higher on Thursday, extending a mild recovery amid US market expansion through the OKX exchange. Steady deposits on Centralized Exchanges (CEXs) imply persistent downside pressure while the technical outlook remains mixed amid double-bottom reversal chances.
- Pi Network edges above $0.1500 on Thursday, extending a mild recovery from the previous day.
- Pi Core Team announces OKX exchange will allow US investors to trade PI token, expanding the Pi ecosystem’s global reach.
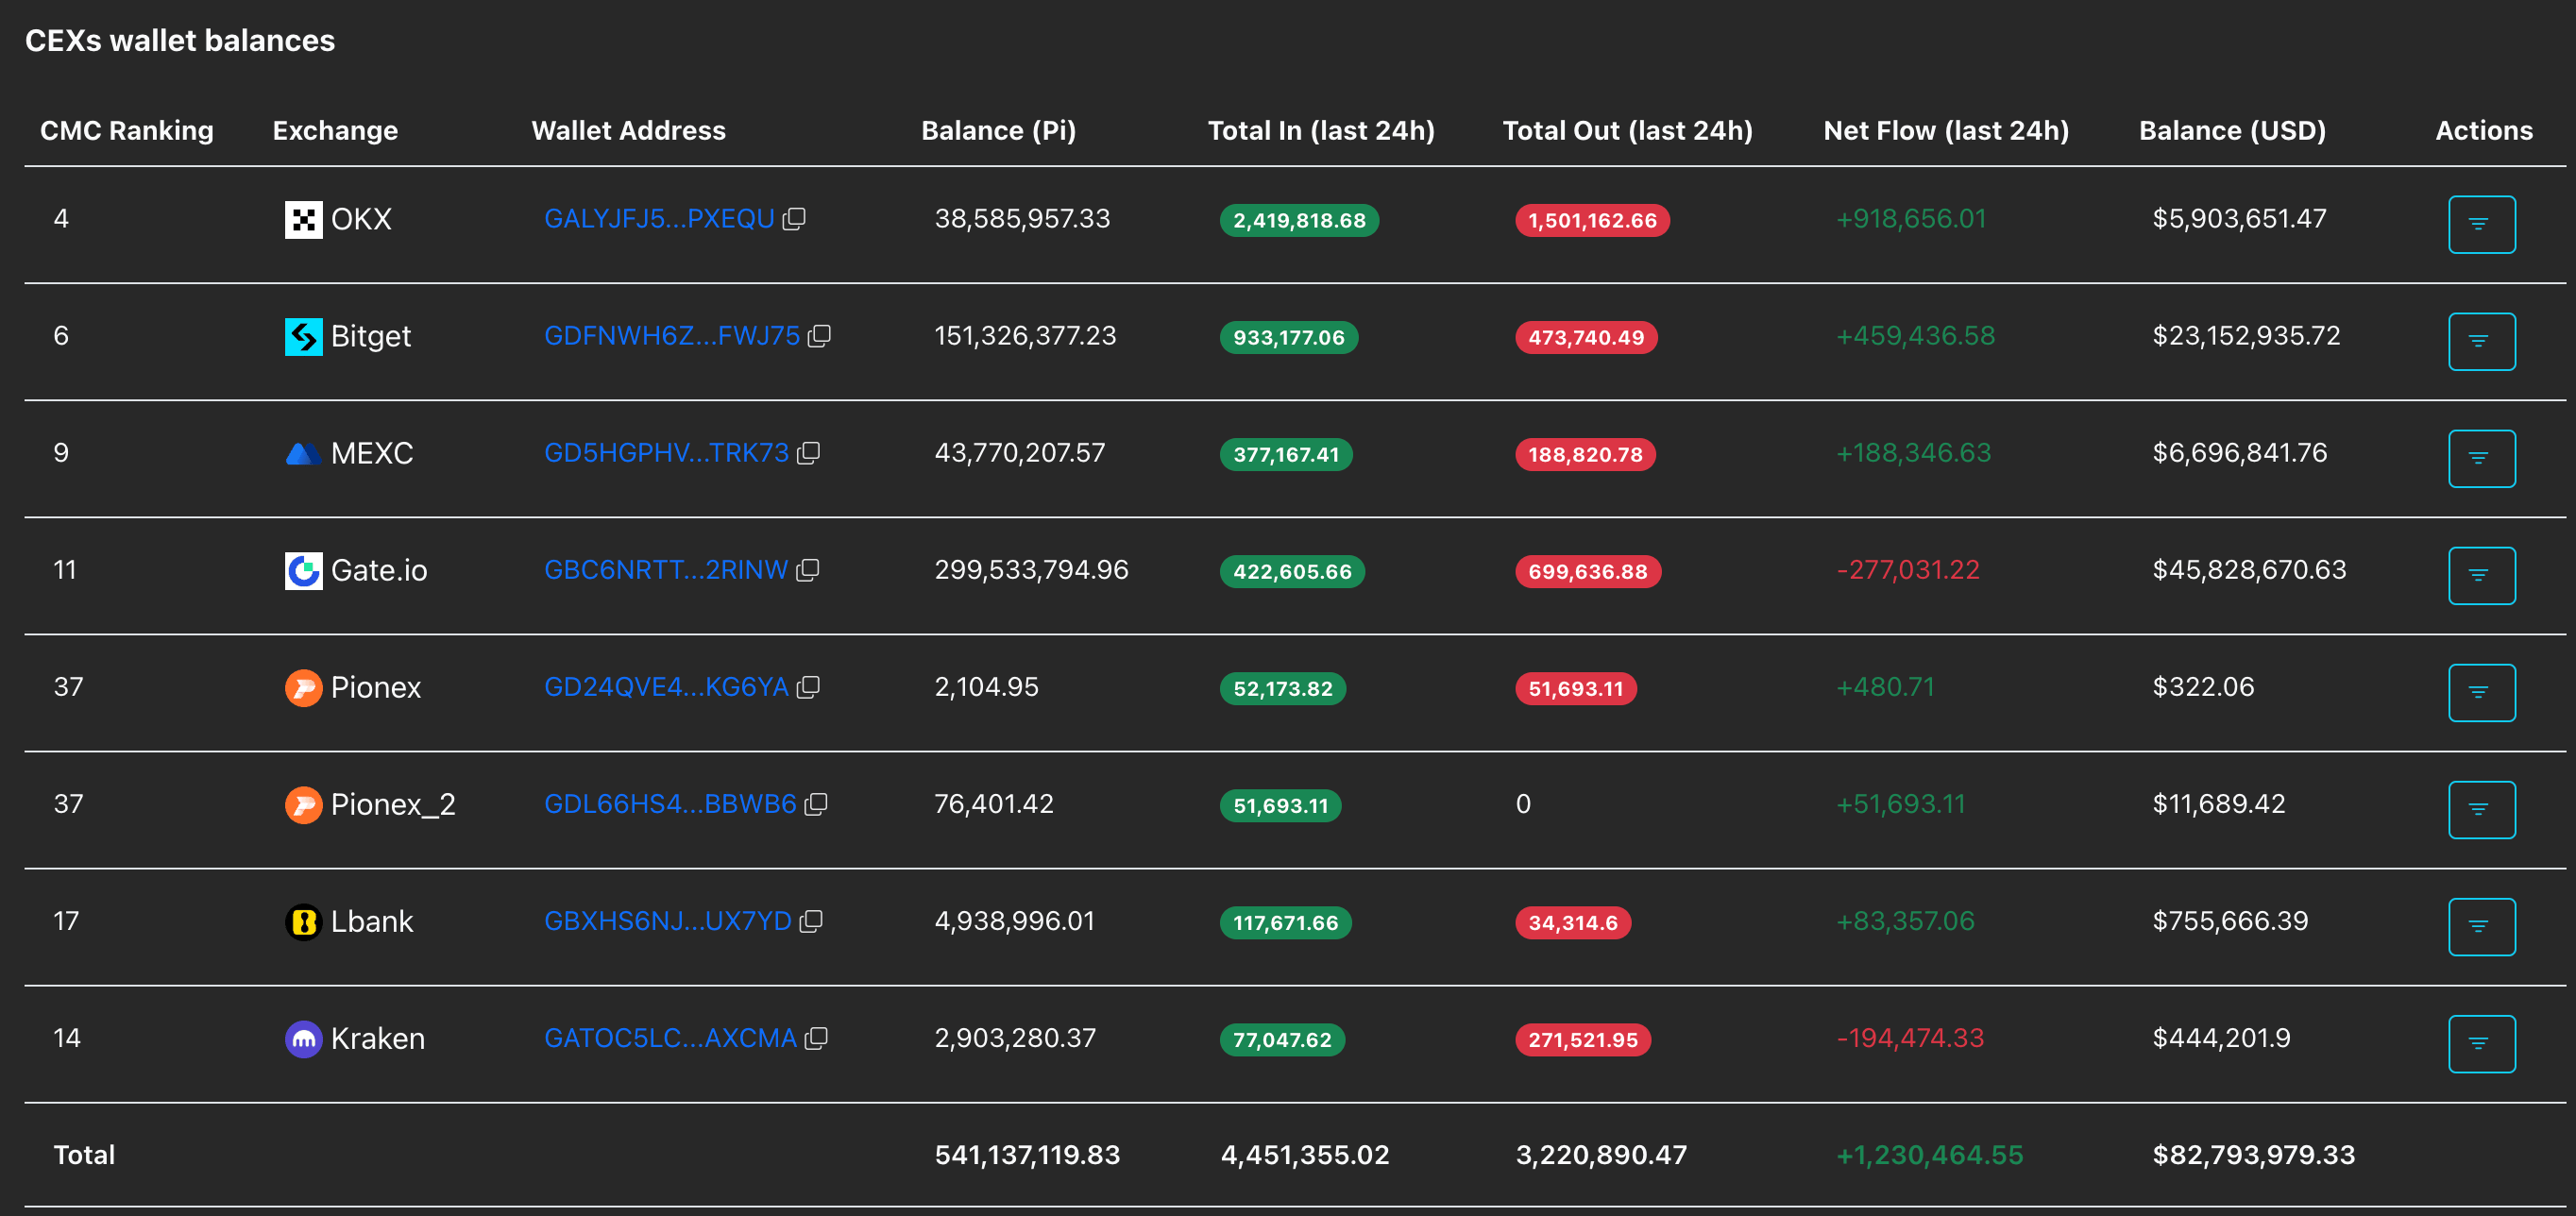
- PiScan data shows that over 1 million PI tokens were deposited on CEXs in 24 hours, suggesting selling pressure.
Pi Network (PI) edges higher on Thursday, extending a mild recovery amid US market expansion through the OKX exchange. Steady deposits on Centralized Exchanges (CEXs) imply persistent downside pressure while the technical outlook remains mixed amid double-bottom reversal chances.
OKX provides new access in the US market
The Pi Core Team announced in an X post on Wednesday that the OKX exchange will enable PI token access for its US users, adding another access point to the Pi ecosystem. This access adds to PI's listing on the Kraken exchange on March 13, further strengthening its roots in the US market.

Under Trump’s administration and his pro-crypto stance, Pi Network could build a base in the West, mimicking its growth in the South Asian countries.
On the other hand, on-chain data shows that 1.23 million PI tokens were deposited on CEXs over the last 24 hours, suggesting reduced investor confidence.
Pi Network sways amid double-bottom reversal chances
Pi Network trades above $0.1500 at press time on Thursday, maintaining a near-term mixed bias. PI takes a sideways shift with Tuesday's low at $0.1463 acting as the double-bottom support floor and its high at $0.1550 serving as the breakout point.
A decisive close above this level could target the 50-period Exponential Moving Average (EMA) on the 4-hour chart at $0.1585 and the 200-period EMA near $0.1706.
A modest improvement in the Relative Strength Index (RSI) around 45, from the oversold zone, and a positive, rising Moving Average Convergence Divergence (MACD) histogram hint that downside momentum may be stabilizing rather than accelerating.
On the downside, immediate focus stays on $0.1463 support, which guards the downside toward the $0.1400 round figure and the all-time low at $0.1310.
(The technical analysis of this story was written with the help of an AI tool.)

More than a million users rely on FXStreet for real-time market data, charting tools, expert insights, and forex news. Its comprehensive economic calendar and educational webinars help traders stay informed and make calculated decisions. FXStreet is supported by a team of about 60 professionals, split between the Barcelona headquarters and various global regions.
Read More


