


What Is the Exponential Moving Average?
The exponential moving average (EMA) is a moving average that prioritizes more recent prices, making it more responsive to current market activity. Unlike the Simple Moving Average (SMA), which applies equal weight to all price points, the EMA dynamically adjusts, reducing the lag inherent in SMA calculations.
Why Use the EMA?
The primary advantage of the EMA is its ability to:
Identify emerging trends more quickly than the SMA (see trend lines for context).
Smooth out price fluctuations to highlight the general direction of the market.
Adapt to rapid changes in the market, making it useful for volatile assets.
The EMA’s emphasis on recent data makes it an excellent choice for short-term traders or those looking for timely signals in fast-moving markets, especially when combined with solid.
Using the Exponential Moving Average Formula
The exponential moving average formula for EMA is as follows:
EMAt = α × Current Price + (1 − α) × EMAt−1
Where:
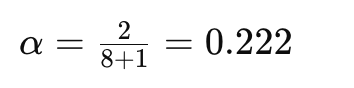
α (alpha) is the smoothing constant, calculated as 2/(n+1) , where n is the number of periods.
EMAt−1 represents the EMA value from the previous period.
This calculation ensures that recent price data is weighted more heavily than older data, creating a responsive curve that adapts to market changes (compare with the SMA approach in).
Steps to Calculate EMA:
Obtain a starting point: Use the SMA of the first “n” periods as the initial EMA value.
Determine the smoothing constant (α): Calculate 2/(n+1) based on your chosen period.
Iterate the calculation: Use the formula recursively, incorporating previous EMA values.
Example:
For an 8-day EMA:
Use this to weigh the current price against previous EMA values; a trading calculator can help when backtesting.
While manual calculation is possible, most trading platforms automatically display the EMA curve instantaneously.
How to Use the EMA Indicator in MT4 and MT5
MetaTrader 4 (MT4) and MetaTrader 5 (MT5) include the EMA indicator as a default tool (see platform add-ons for MT4 indicators and MT5 indicators ). Here’s how to use it:
Locate the Indicator:
Open the Navigator panel, navigate to the Trend Indicators folder, and select Moving Average.Configure the Settings:
Set the MA Method to Exponential to apply the EMA calculation.
Define the Period (e.g., 10, 25, 50, 100, or 200-day EMA).
Leave the Shift at its default value (0) unless you want to offset the curve along the time axis.
Apply the Indicator:
The EMA line will appear on your chart, overlaying price data. For signals, many traders add MACD or RSI .
EMA Settings Tips:
Short-term EMA (e.g., 10 or 25): Quick response, ideal for scalpers and day traders.
Long-term EMA (e.g., 100 or 200): Smoother curves, better for identifying long-term trends.
Building an Exponential Moving Average Strategy
The EMA can serve as a standalone tool or as part of a broader technical analysis approach. Below are two popular methods:
Single EMA Strategy
Use a single EMA line to identify the trend direction:
Buy Signal: When the price is consistently above the EMA line.
Sell Signal: When the price stays below the EMA line
This strategy is simple but effective in trending markets.
Double EMA Crossover Strategy
This strategy uses two EMA lines: one with a shorter period and another with a longer period.
Buy Signal: When the shorter EMA crosses above the longer EMA.
Sell Signal: When the shorter EMA crosses below the longer EMA.
Example:
Short-term EMA: 25-day
Long-term EMA: 100-day
The crossover points provide clear entry and exit signals, helping traders capitalize on significant market moves.
Final Thoughts on the EMA Indicator
The EMA is a versatile indicator, suitable for traders across all skill levels. Its ability to adapt quickly to market changes makes it a valuable tool for identifying trends and potential trade opportunities. However, traders should remember:
The EMA is a lagging indicator, as it relies on historical data.
It works best when combined with other indicators or used in conjunction with price action analysis.
Testing different EMA settings in a demo account can help you identify the best configurations for your trading style.
Frequently Asked Questions on the EMA Indicator
What is EMA in forex trading?
The Exponential Moving Average (EMA) is a technical analysis tool emphasizing recent price movements to identify trends and potential reversals.
Why is the EMA better than the SMA for some traders?
The EMA reacts faster to price changes, making it ideal for traders who need timely signals in volatile markets.


