


Punti Chiave:
Le trendline sono linee diagonali tracciate attraverso massimi o minimi chiave che fungono da supporti e resistenze dinamiche in mercati come forex, criptovalute, metalli, azioni e indici, aiutando i trader di qualsiasi stile, dal day trading allo swing trading, a visualizzare rapidamente se il prezzo è in trend rialzista, ribassista o laterale, così da allineare le strategie CFD con il momentum prevalente.
Le trendline aiutano i trader in ogni mercato a vedere chiaramente se il prezzo si muove verso l’alto, verso il basso o lateralmente, evidenziano supporti e resistenze per ingressi e uscite più puliti, filtrano le fluttuazioni rumorose concentrandosi sui massimi e minimi chiave, e valutano volatilità e cambi di momentum formando pattern grafici come triangoli, canali e bandiere.
Per tracciare trendline efficaci, apri un grafico pulito, usa lo strumento trendline per collegare almeno due swing high in un trend ribassista o due swing low in un trend rialzista, estendi la linea nel futuro e affinane la posizione finché non tocca tre o più picchi o avvallamenti chiave, trasformandola in una guida solida per futuri supporti, resistenze e ingressi operativi.
Le trendline che collegano almeno tre swing high o low sono considerate confermate, e più volte il prezzo le testa, più diventano forti e affidabili come supporto o resistenza.
I mercati si muovono principalmente in tre modi—trend rialzista (minimi crescenti), trend ribassista (massimi decrescenti) e fasi laterali—e i trader utilizzano le trendline non solo per individuare questi trend ma anche per applicare strategie come il range trading e i setup di breakout dalle trendline.
Il range trading con trend line parallele significa comprare vicino alla linea inferiore e vendere vicino a quella superiore, mentre il breakout trading con chiusure forti sopra o sotto le trendline (spesso accompagnate da volumi maggiori) può segnalare movimenti rialzisti o ribassisti potenti.
Le trend line sono valide solo se collegano naturalmente almeno due—idealmente tre—swing high o low, acquisiscono forza con test ripetuti, si indeboliscono se troppo ripide e devono sempre essere confermate da altri indicatori e dal contesto di mercato, senza essere forzate su oscillazioni di prezzo irregolari.
Trendline Significanto: Cos’è una Trendline nel trading?
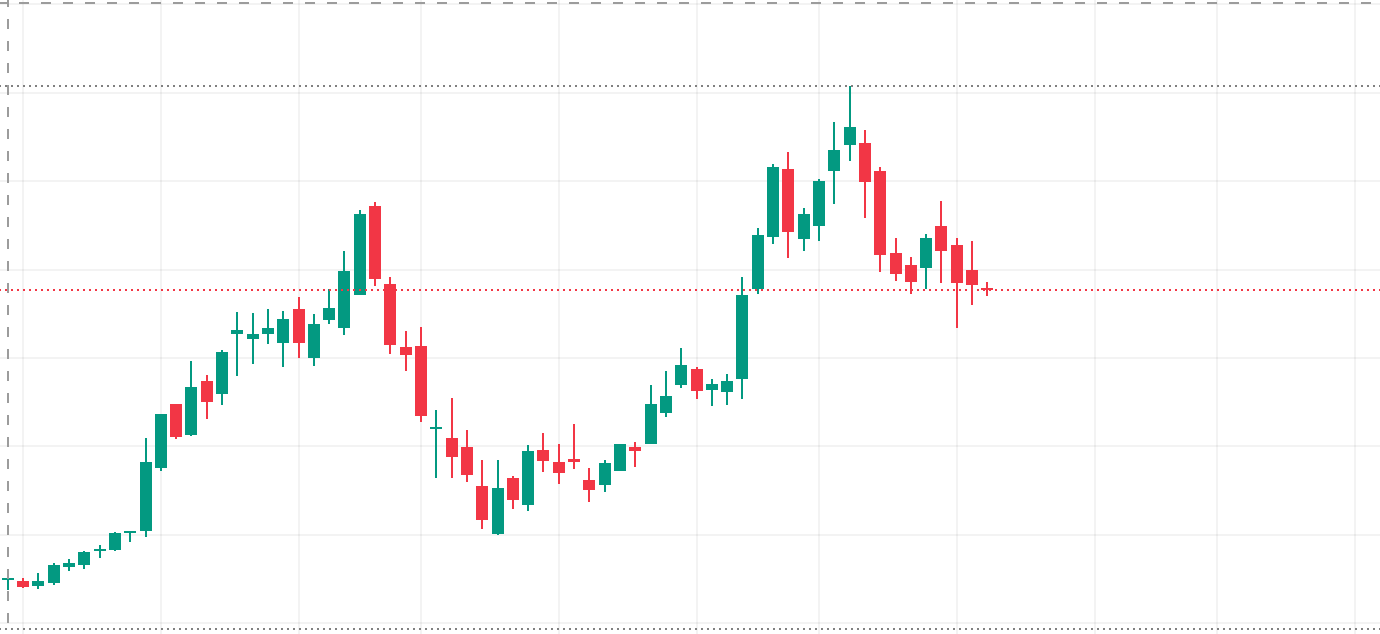
Le trendline sono linee diagonali che i trader tracciano sui grafici dei prezzi per mostrare la direzione generale del movimento del prezzo, sia esso in salita, discesa o laterale.
Una caratteristica importante delle trendline è la loro capacità di fungere da livelli di supporto e resistenza, creando zone dove i prezzi spesso rimbalzano o possono rompere, rendendole strumenti preziosi per prevedere il comportamento futuro del prezzo.
- Le trendline ribassiste si tracciano dai massimi e hanno una pendenza verso il basso, segnalando un bias ribassista nei mercati forex, energetici o degli indici.
- Le trendline rialziste collegano i minimi e hanno una pendenza verso l’alto, indicando momentum rialzista in criptovalute, azioni o metalli.
Tipi di Trend
Esistono tre tipi di trend:
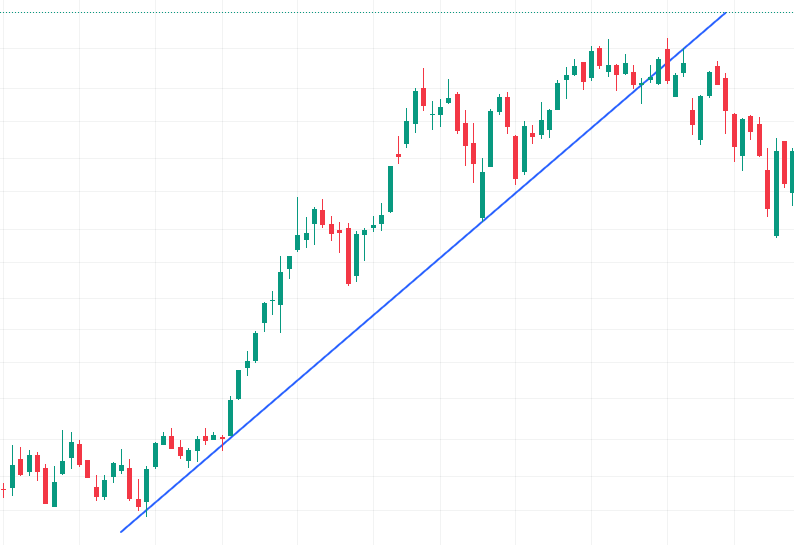
Trend rialzista (minimi crescenti)
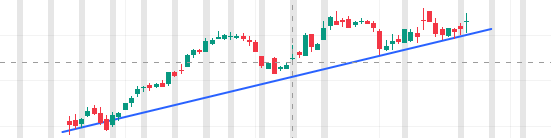
Quando i prezzi sono in trend rialzista, le trendline rialziste si formano collegando una serie di punti bassi, mostrando chiaramente il trend di prezzo in salita.
Trend ribassista (massimi decrescenti)
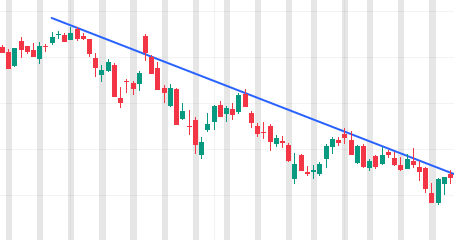
Al contrario, le trendline ribassiste si formano collegando una serie di punti alti, rivelando un trend di prezzo in discesa.
Trend laterale (ranging)
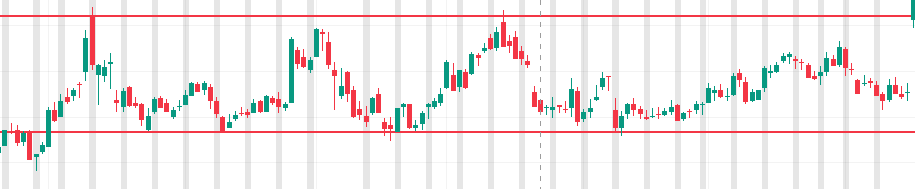
Nei mercati senza direzione chiara, si possono tracciare trendline laterali collegando vari massimi e minimi, indicando un mercato senza trend o in movimento laterale.
Oltre a individuare trend rialzisti e ribassisti, ci sono altre strategie di trading con trendline che i professionisti utilizzano, come il Range Trading e la Strategia di Breakout dalle Trend line.
Che tu faccia trading su forex, criptovalute, metalli, indici, che tu pratichi day trading, swing trading o scalping, tracciare una semplice linea attraverso massimi o minimi chiave rivela immediatamente la vera direzione del mercato’tagliando il rumore e permettendoti di capire quando il momentum accelera o rallenta.
Comprendendo se il mercato rispetta queste trendline, i trader possono allineare le strategie CFD su criptovalute, oro o indici azionari con la direzione più probabile del movimento dei prezzi.
Come Utilizzare le Trendline nel Trading
Le trendline offrono diversi benefici pratici in tutte le principali categorie di asset:
Visualizzare il trend attuale del movimento del prezzo : Forniscono chiarezza visiva sul fatto che i prezzi si muovano generalmente verso l’alto, verso il basso o lateralmente. Utile per tutti i tipi di mercati.
Identificare livelli di supporto e resistenza: I prezzi spesso reagiscono intorno alle trendline offrendo zone chiare per ingressi e uscite.
Ridurre il rumore: La trendline ignora le fluttuazioni minori dei movimenti di prezzo, concentrandosi solo sui punti più alti e più bassi per prevedere le mosse successive, riducendo così molto rumore, specialmente se il trader è influenzato da notizie e altre informazioni aggiuntive.
Valutare la volatilità: Tracciare più trendline (ad esempio una sopra e una sotto) può rivelare cambiamenti nel comportamento del momentum attuale formando triangoli, canali e bandiere. Questi sono anche noti come ‘Pattern Grafici’.
Piattaforme come MetaTrader 4 e MT5 ti permettono di tracciare trendline manualmente o di collegare automaticamente massimi e minimi su qualsiasi mercato, inclusi oro, forex, criptovalute o azioni, consentendoti di imparare efficacemente come tracciare trendline passo dopo passo.
Come si tracciano le Trendline?
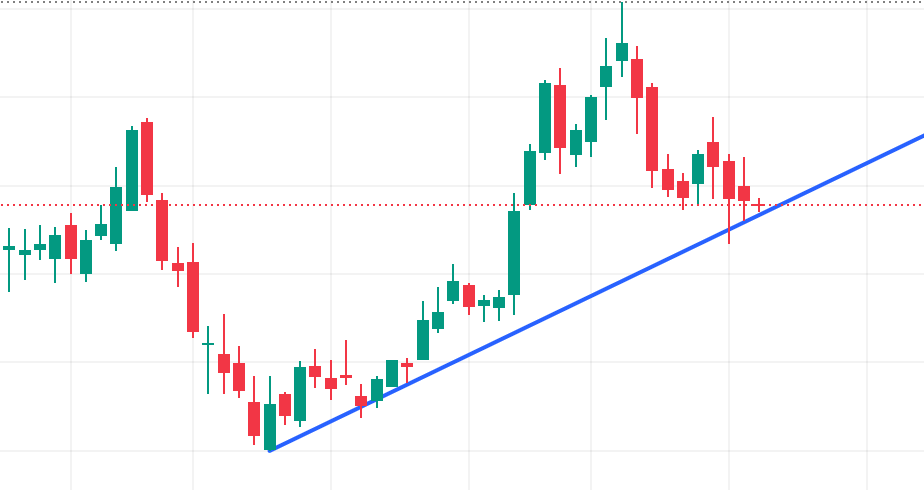
Per tracciare trendline, identifica un minimo di due "punti di swing" (massimi per un trend ribassista o minimi per un trend rialzista) su un grafico dei prezzi, poi collegali con una linea retta. Una trendline più forte si forma collegando più punti senza che il prezzo la attraversi, e la linea dovrebbe essere estesa nel futuro per prevedere potenziali livelli di supporto o resistenza.
L’uso della trendline nel trading spesso produce risultati migliori indipendentemente dal mercato, come oro, forex, criptovalute, materie prime e azioni.
Segui questi esempi mostrati di seguito per tracciare trendline accurate e padroneggiare il trading con trendline:
Apri un grafico pulito senza indicatori nella tua piattaforma di trading.
Individua il punto di prezzo più alto o più basso sul grafico. Se vuoi aprire una posizione long (acquisto), dovresti cercare i punti più bassi, quindi traccia una trendline da usare come livello di supporto e decidi il tuo ingresso su quella base.
Per tracciare una trendline, dovrai trovare lo strumento trendline nel grafico che stai usando. Di solito appare come una linea inclinata e potrebbe avere la descrizione “Trendline”.
Regola finché le trendline non toccano almeno due picchi o avvallamenti significativi—minimo tre punti per trendline forti.
Nota Importante:
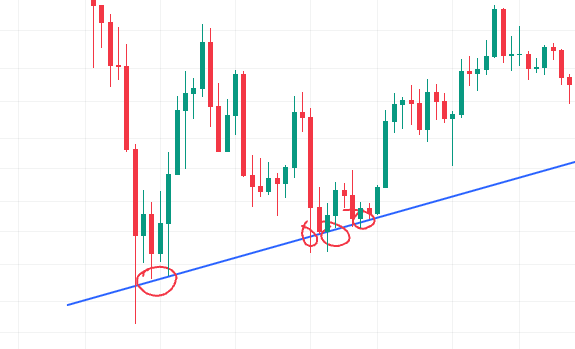
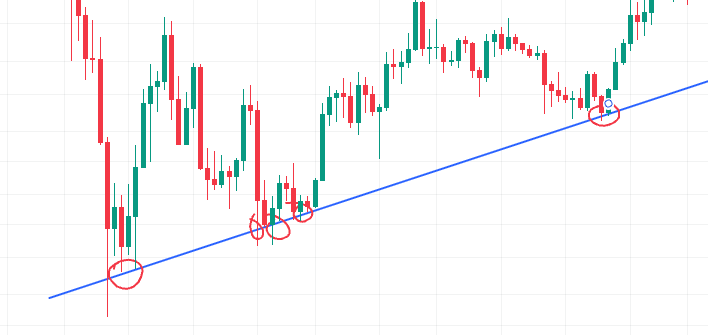
Le trendline tracciate con più punti alti o bassi consecutivi sono considerate ‘testate più volte’. Queste trendline sono considerate confermate‘ e tendono a essere rivisitate dal prezzo, fornendo così affidabilità come livello di supporto o resistenza.
Pertanto, una trendline valida in qualsiasi grafico di prezzo e mercato, come oro, forex, CFD su criptovalute o altre classi di asset, dovrebbe idealmente avere almeno tre punti di swing. Più punti di contatto ci sono, più forte è il segnale della trendline.
Come Usare/Operare con le Trendline
Esistono due tipologie popolari di strategie di trading che possono essere utilizzate con le trendline.
Strategie di Breakout dalle Trendline
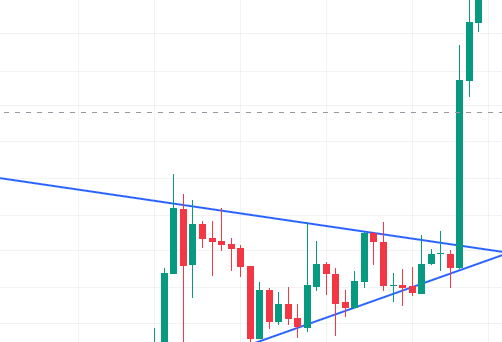
I breakout attraverso le trendline possono innescare movimenti forti:
Una chiusura sopra la trendline superiore—spesso con volumi di trading più elevati—segnala un breakout rialzista.
Una chiusura sotto la trendline inferiore indica spesso un breakout ribassista.
Range Trading con le Trendline
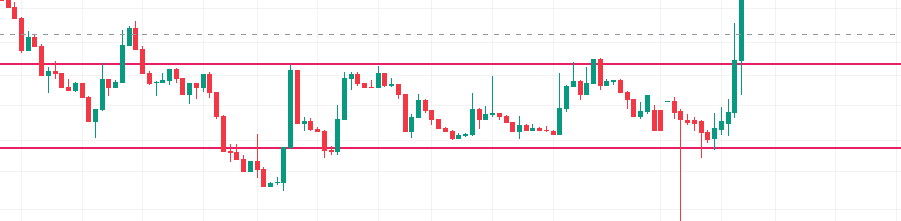
Il range trading con trendline consiste nell’usare trendline parallele per formare un canale, puoi:
Comprare (andare long) vicino alla trendline inferiore quando gli indicatori rialzisti confermano.
Vendere (andare short) vicino alla trendline superiore quando appaiono segnali ribassisti.
Questa strategia funziona altrettanto bene su oro, argento, energetici e criptovalute se si fa trading di CFD su questi mercati, esemplificando strategie di trading basate sulle linee.
Apri posizioni CFD long o short su energetici o criptovalute di conseguenza, usando le trendline per temporizzare gli ingressi.
Considerazioni Importanti & Avvertenze per il Trading di Trend
Limitazioni
I mercati si muovono con oscillazioni irregolari, quindi una trendline da sola non conferma la direzione e può semplicemente riflettere un contro-trend o una fase di consolidamento.
Convalida sempre le trendline con la congiunzione di indicatori e il contesto più ampio su indici, forex o materie prime prima di operare.
Considerazioni
Una trendline valida richiede almeno due swing high o low per essere tracciata, ma di solito servono tre tocchi per confermarla.
Più ripida è la trendline, meno affidabile tende a essere e più probabile è che venga rotta.
Come per i livelli orizzontali di supporto e resistenza, una trendline diventa più significativa quanto più volte il prezzo la testa.
Soprattutto, non forzare mai una trendline a adattarsi al mercato; se non si allinea naturalmente all’azione del prezzo, non dovrebbe essere considerata valida.
Applicazione delle Trendline in Diversi Mercati
Puoi applicare le trendline praticamente in qualsiasi mercato:
Indici (es. S&P 500, NASDAQ)
Forex major e minor
Energetici (es. petrolio greggio, gas naturale)
Azioni (CFD su azioni globali)
Metalli (oro, argento, platino)
Criptovalute (Bitcoin, Ethereum, altcoin)
I metodi delle trendline sono universali: gli stessi principi guidano le trendline su grafici di criptovalute, metalli o azioni.


