What is Swing Trading & How does it Work?
Swing trading is a trading style for people who seek a less intensive work life. It captures medium-term market movements without the intensity of day trading. By focusing on price swings over several days to weeks, you are essentially dealing with market trends rather than clicks, it allows traders to capitalize on market trends with minimal screen time, making it easier for those with other commitments or simply beginners.
Key Takeaways
Swing trading captures short- to medium-term price trends over a period of days to weeks.
It is a "lifestyle-friendly" strategy that requires less screen time than day trading, making it suitable for those with full-time commitments.
Success relies heavily on risk management, specifically using position sizing (1-2%) and stop losses to protect capital.
What Is Swing Trading?
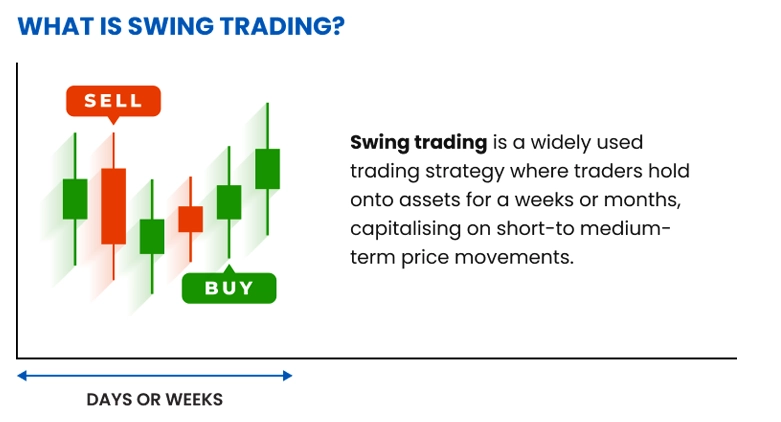
Figure 1: Explaining swing trading as a trading strategy where traders hold onto assets for days, weeks, or months, capitalizing on short to medium-term price movements
Swing trading is a form of trading style that aims to capture gains in security for several days to several weeks. Unlike day trading strategies, where the trading style dictates that positions are opened and closed within the same trading day, swing trading allows for overnight and weekend position holding. Still, unlike position trading or investing, it doesn't involve holding assets for months or years.
The best time frame for swing trades ranges from 2 days to several weeks. This is an ideal approach for traders who can't monitor markets constantly but still want to capitalize on market movements and benefit from market swings while filtering out the noise of intraday fluctuations.
Swing traders ride the momentum of a trend (often up to 20-30%) for a significant portion of its duration, rather than just a small portion of it. These swings will take time to manifest, typically coming in waves with consolidations and retracements.
Swing Trading vs. Other Trading Styles
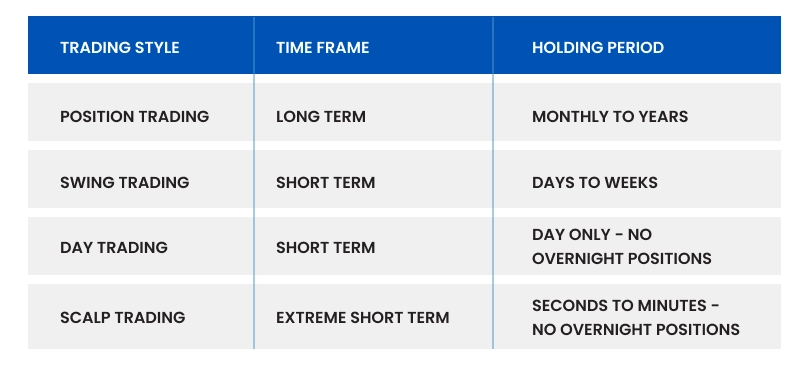
To understand swing trading better, it helps to compare it with other popular trading styles:
Figure 2: A side-by-side chart comparing day different trading styles, monitoring, capital, and market approach
Swing vs. Day Trading: The Lifestyle Difference
The biggest difference here is the "screen time." A day trader treats trading like a 9-to-5 job; they are often glued to their screens, opening and closing positions within the same day to avoid overnight risk. They zoom in on 1-minute or 15-minute charts to catch small, rapid fluctuations.
In contrast, swing trading allows you to step back. You might only check the charts periodically because you are holding trades for days or weeks, looking for larger moves on the 4-hour or daily charts.
Swing vs. Position Trading: The Timeframe
Position trading is closest to what most people call "investing." These traders hold assets for months or even years, often ignoring technical charts in favor of "fundamental analysis" (like company earnings or economic health).
Swing traders are less concerned with the company's long-term value and more focused on the price action right now. We aim to capture a specific "leg" of a trend and then exit, freeing up our capital for the next opportunity.
Swing vs. Scalping: The Intensity
Scalping is the most intense form of day trading. Scalpers might make dozens of trades in a single day, holding positions for just seconds to snatch very small profits. It requires intense focus and often specialized tools.
Swing trading is much slower and more selective. You aren't trying to profit from the "noise" of every second; you are waiting for a clear, substantial move that might take days to play out.
Pros and Cons of Swing Trading
The Advantages: Why Choose Swing Trading?
The biggest draw for most swing traders is the lifestyle fit. Unlike day trading, which often demands that you stay glued to the screen for hours, swing trading allows you to maintain a full-time job or other commitments. You are not trying to catch every tiny tick; you are looking to capture the "meat" of a move—a significant leg of a trend that plays out over days.
This slower pace naturally leads to better mental and financial efficiency. Because you are trading less frequently, you aren't eaten up by commission fees or the stress of making split-second decisions. It also reduces the temptation to "overtrade" out of boredom, a common trap where day traders force bad trades just to feel productive.
The Trade-Offs: What You Must Accept
The primary risk you accept is "Gap Risk." Because you hold positions while you sleep, news can break overnight that causes the price to open significantly lower the next morning, potentially bypassing your stop-loss. You cannot react to markets that are closed, so you must be comfortable with this uncertainty.
Swing trading also requires a different kind of patience. Your capital gets tied up in fewer trades for longer periods, meaning you might sit on a position for a week while watching day traders capture quick wins. Finally, this style works best in clear trends; if the market turns "choppy" (moving sideways without direction), swing strategies often struggle to find clear signals.
Important #1
Swing trading allows for overnight holding. This offers freedom from the screen but exposes traders to "gap risk"—where prices jump significantly while the market is closed, potentially bypassing stop-loss levels.
Mechanics of Swing Trading: How does it work?
While day traders frantically open and close positions within minutes, and investors lock away capital for years, swing trading sits comfortably in the middle. The goal is to capture a "swing"—a single leg of a trend—which typically plays out over a few days to a few weeks. You aren't trying to catch the entire move; you are simply trying to take a meaningful slice of the action when the probability appears to be in your favor.
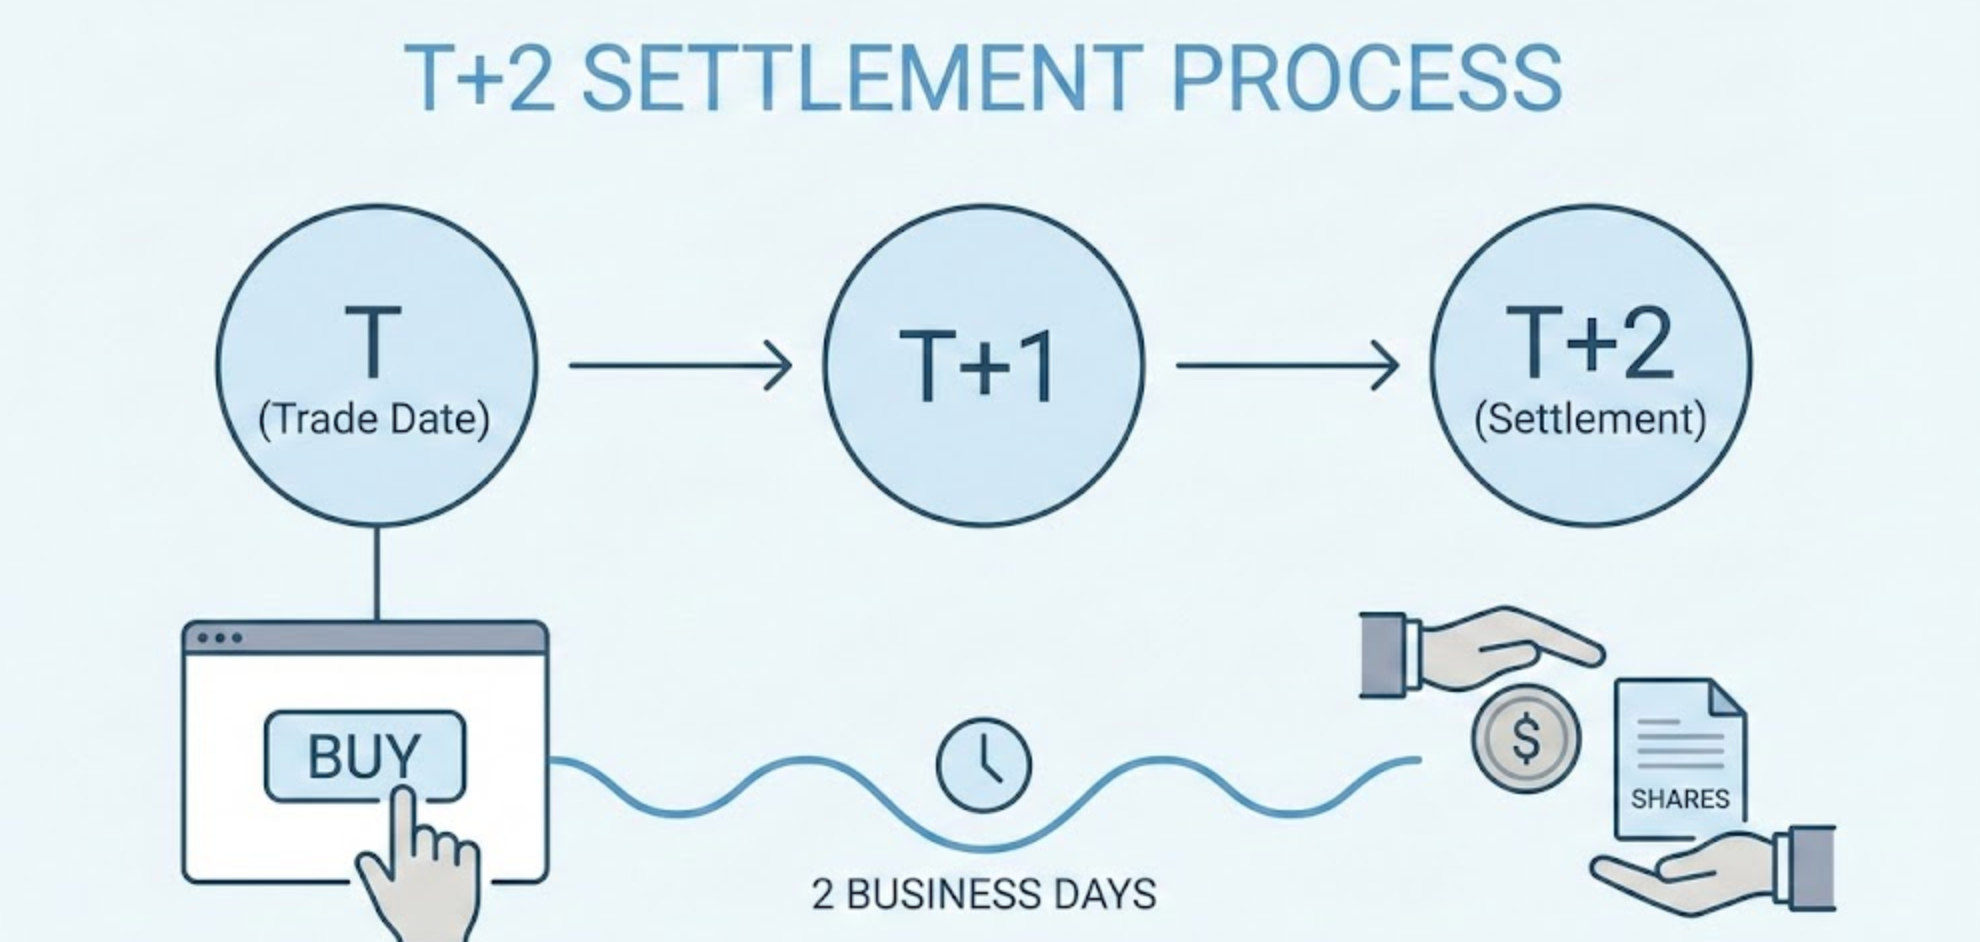
Figure 3: Actual ownership of an asset, like shares, takes up to 2 business days (T+2) to fully settle.
The defining feature of this style is holding overnight. Unlike a day trader who goes to sleep with a "flat" account (no open trades), a swing trader stays active while the market is closed. This offers a major lifestyle advantage because you don't need to stare at charts all day, but it introduces a specific risk known as "gap risk." This happens when news breaks while the market is sleeping, causing the price to open significantly higher or lower the next morning, potentially bypassing your stop-loss.
Behind the scenes, there is also a settlement process known as T+2 (Trade Date plus two days) that you should be roughly aware of. When you click "buy," the transaction appears instant, but the official exchange of cash for shares usually takes two business days to settle.
For Stock Traders: This delay determines when you are officially recorded as the owner, which matters if you are aiming to qualify for dividend payments.
For Margin/CFD Traders: Since you are borrowing leverage to hold the position overnight, you generally incur a small "swap" or "overnight financing" fee each night the trade remains open.
Successful swing trading is about balancing these factors: accepting the overnight risk and small holding costs in exchange for the potential to capture larger, less stressful price moves.
Detailed Example of Swing Trading
Case Study: Henry’s Swing Trade on RDDT Trade.
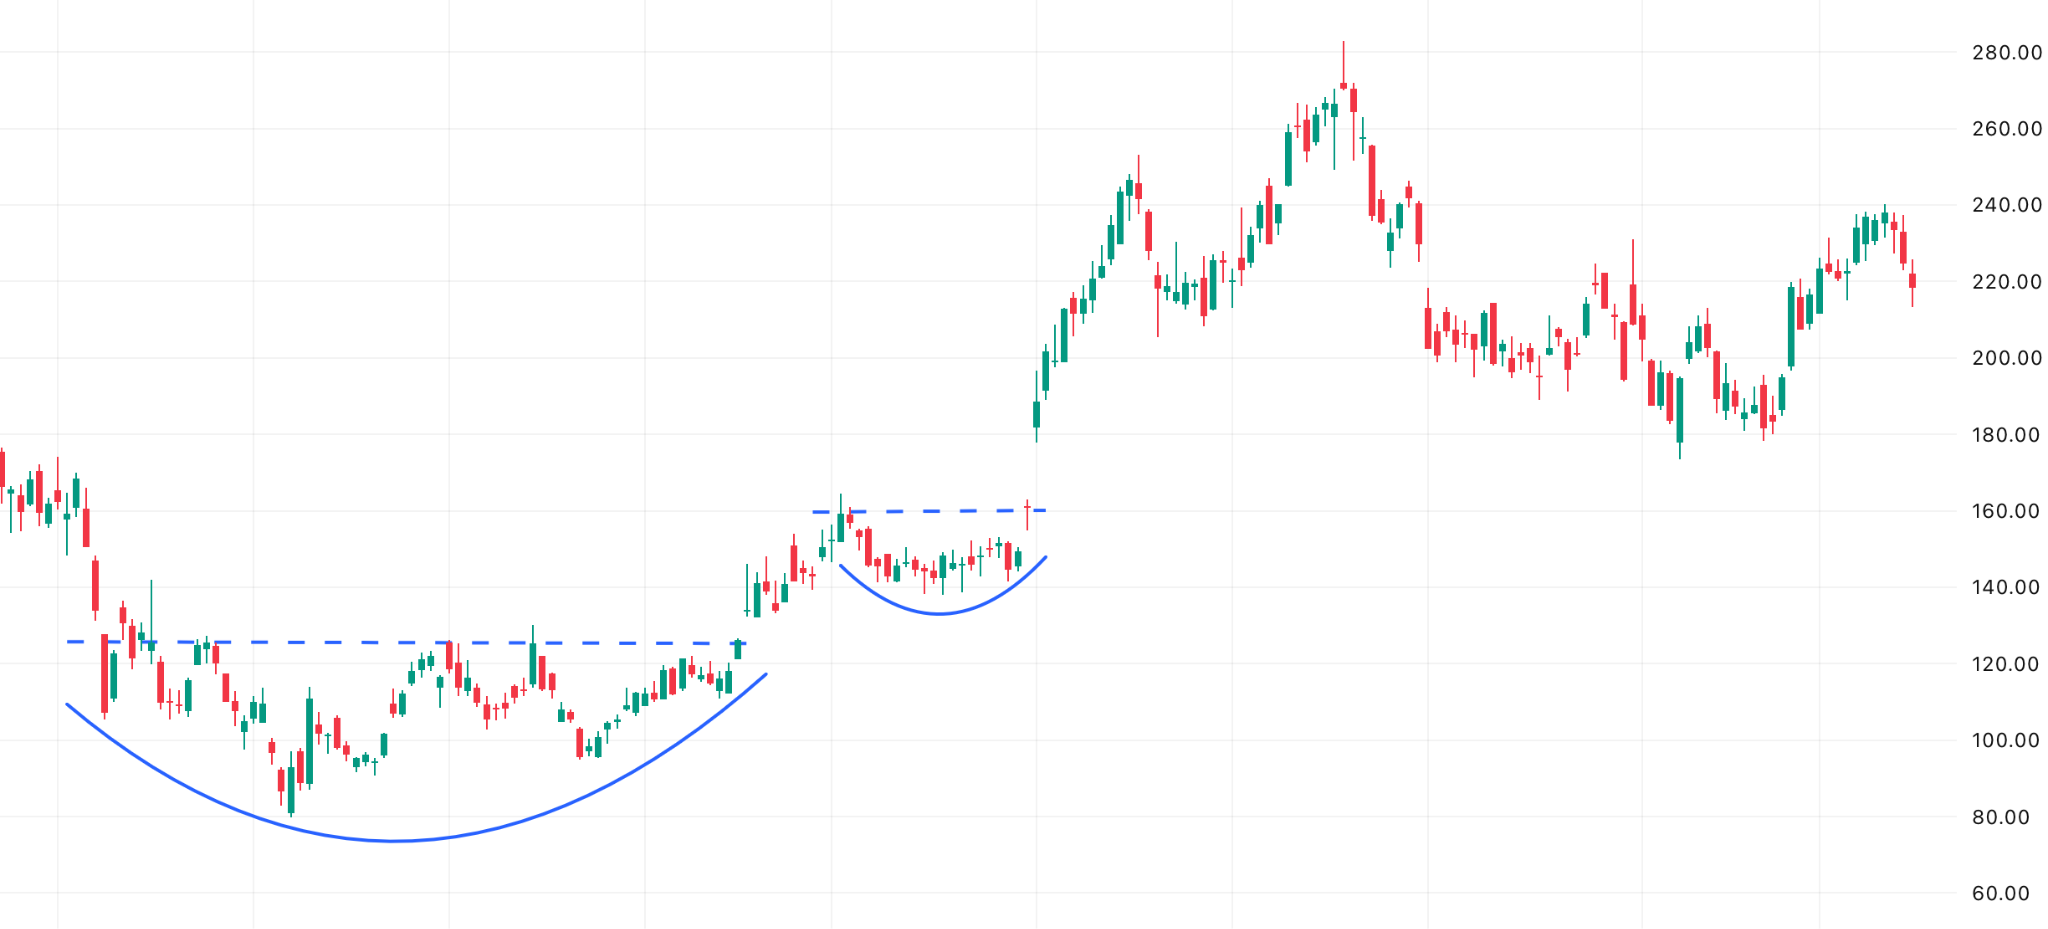
Henry, a swing trader who prefers not to be glued to his screen all day, had been keeping a close watch on Reddit, RDDT. By mid-June, he noticed something interesting developing on the daily chart. Since March, the stock had been carving out a rounded bottom shape, known to traders as a "cup base." This long consolidation period suggested that the selling pressure was drying up and buyers were slowly starting to accumulate shares.
Figure 4: A clean RDDT price chart that shows 2 cup and handle patterns formed, leading to a strong uptrend within a few months.
Before making a move, Henry didn't just rely on the shape alone. He wanted to see confirmation that the stock was ready to climb. He looked for a few specific criteria to align:
The Pattern: A clear "handle" had formed on the right side of the cup, indicating a healthy pause before a potential breakout.
The Trend: The stock was starting to trade above its key moving averages, signaling a shift in momentum.
The Volume: Trading activity was quieting down during the handle formation, a sign that aggressive sellers were leaving the market.
On Friday, June 13, the moment arrived. Reddit’s price was edging towards the top of the handle, trading around $117. Not wanting to enter the position too late, Henry used market sentiment and momentum as confluence functioning as his "green light" and entered a buy position. He knew that breakouts on Fridays can sometimes be tricky, but the volume was strong enough to suggest this was a real move, not a fake-out.
Over the next three months, Henry simply held on. He didn't panic during minor red days. In fact, he noticed the stock form another smaller "cup and handle" pattern along the way—a pattern within a pattern—which often acts as a stepping stone for higher prices. This confirmed his thesis that the trend was healthy, so he sat tight and let the trade work.
By late September, the picture began to change. On September 22, with the stock trading roughly at $256, Henry noticed the price action was starting to struggle. The stock appeared to be forming a "topping formation," where it tries to push higher but repeatedly fails, losing its upward momentum.
Henry’s original profit target had already been exceeded, and he knew the golden rule of swing trading: never let a big winner turn into a loser. Rather than hoping for one last push, he decided to sell his entire position. He locked in a substantial gain, successfully exiting just as the trend seemed to be running out of steam.
Important #2
Swing traders rarely rely on luck; they look for "confluence." A strong setup typically combines a clear chart pattern (like a Cup and Handle) with supportive volume and momentum indicators before a trade is executed.
The Psychology Behind Swing Trading
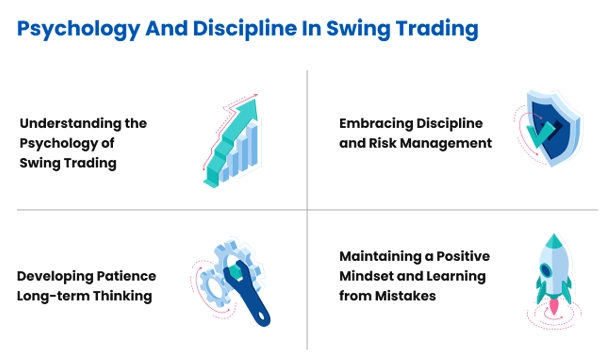
Successful swing trading requires a balanced psychological approach, similar to the discipline needed in margin trading. On one hand, swing traders need the patience to allow trades to develop according to their analysis. On the other hand, they must be disciplined enough to take profits or cut losses according to predetermined levels.
The psychological advantage of swing trading is that it reduces the pressure of making split-second decisions. With more time to analyze setups and manage positions, traders can maintain clearer thinking and avoid the emotional pitfalls that often plague day traders, such as revenge trading or overtrading.
Figure 5: Highlights the key psychological and discipline-related factors necessary for successful swing trading
Risk Management for Swing Traders
Effective risk management is crucial for long-term success in swing trading. Even the best strategies will experience losses, and protecting your capital during these inevitable drawdowns separates successful traders from those who blow up their accounts.
Position Sizing Strategy
Position sizing determines how much capital you allocate to each trade, and it's one of the most important aspects of risk management.
Approaches to Position Sizing
Deciding how much to buy is often more important than deciding what to buy. A smart sizing strategy ensures that a string of bad luck doesn't wipe out your account, keeping you in the game long enough for the odds to work in your favor.
The Fixed-Percentage Model: This is the standard for most disciplined traders. The idea is to risk a set fraction of your total account—usually around 1% to 2%—on any single trade idea. This acts as a safety valve; even if you suffer five losses in a row, your capital remains largely intact, allowing you to recover without needing massive wins.
Volatility-Based Sizing: Not all stocks move the same way. A calm utility stock is very different from a wild tech startup. With this approach, you adjust your size based on the "personality" of the stock: you might buy fewer shares of a highly volatile asset (to dampen the swings) and more shares of a stable one. This helps keep your actual dollar risk consistent, regardless of how wild the chart looks.
Tiered Sizing: This method allows you to adjust your bet based on your confidence. You might allocate a standard 1% risk for a typical setup, but perhaps scale down to 0.5% for a trade that looks promising but speculative. Conversely, for a "textbook" setup where all your criteria align perfectly, you might step up to your maximum size.
Calculation Example: If you have a $10,000 account and want to risk 1% per trade:
Maximum risk per trade = $100
If your stop loss is $0.50 away from entry on a stock, you can buy 200 shares ($100 ÷ $0.50)
As your account grows or shrinks, adjust your position sizes accordingly
Setting Stop Losses
Set stop losses to protect your capital by automatically exiting trades when they move against you beyond a predetermined point.
How to place stop losses:
Technical Stop-Loss Orders: Place stops below significant support levels (for long positions) or above resistance (for shorts)
Volatility-Based Stop-Loss Orders: Use Average True Range (ATR) to set stops based on market volatility (e.g., 2 × ATR below entry)
Time-Based Stop-Loss Orders: Exit trades that haven't performed as expected within a certain timeframe
Stop-Loss Best Practices:
Effective stop-loss management is crucial for controlling risk and improving trade consistency. Following these best practices can help traders protect capital and enhance trade execution:
Always set stops at the time of entry: Placing a stop loss immediately ensures discipline and prevents emotional decision-making during volatile market conditions.
Avoid obvious stop levels: Setting stops at well-known support or resistance levels can make them vulnerable to stop hunts, where the price briefly moves to trigger orders before reversing. Consider placing stops slightly beyond these levels to reduce the risk of premature exits.
Use mental stops in high volatility: In exceptionally volatile markets, using mental stops instead of fixed stop-loss orders can help avoid getting "stopped out" due to temporary price spikes. However, this requires strong discipline and real-time monitoring.
Never move stops further away: A stop-loss should act as a safeguard, not a moving target. Traders should only adjust stops to lock in profits, never to increase risk exposure.
By following these best practices, traders can maintain structured risk management while adapting to market conditions.
Profit Target Technique for Swing Trading
Methods for Taking Profit
Having a plan for when to sell is just as important as knowing when to buy. It keeps greed in check and prevents a winning trade from turning back into a loser.
Previous Chart Levels: Rather than guessing, look at where the price struggled in the past. Old resistance levels (for buys) or support levels (for sells) are natural stopping points where the market is likely to pause, making them ideal places to take your profit off the table.
The Risk/Reward Ratio: A common rule of thumb is to aim for a target that justifies the risk, typically at a 2:1 or 3:1 ratio. If you are risking $50 to make $150, you don't need to be right every time to remain profitable in the long run.
Trailing Stops: Sometimes a trend is stronger than you expect. Instead of selling too early, you can use a "trailing stop"—moving your safety net up as the price rises—to lock in gains while giving the trade room to grow.
Scaling Out: You don't have to close the entire position at once. Many experienced traders sell half their shares at the first target to bank some cash, then leave the rest open to see if the trend continues.
How to plan your Swing Trade
A well-defined strategy should outline key components such as market selection, timeframes, entry and exit criteria, position sizing, and trading hours to decide which markets or instruments to focus on, the chart timeframes for analysis, and the specific conditions required to enter and exit trades.
Swing Trade Planning Approach Example:
For example, a trader might concentrate on S&P 500 stocks with market capitalizations above $10 billion, using daily charts for trend identification and 4-hour charts for precise entry timing. A possible strategy could involve entering trades on pullbacks to the 20-day EMA in strong uptrends while using a 2:1 reward-to-risk ratio or a trailing stop set at twice the ATR.
Position sizing should align with risk management principles, such as limiting risk to 1% of the account per trade. Additionally, setting a structured routine—such as reviewing weekend watchlists and analyzing potential setups each evening—ensures traders stay prepared and disciplined in executing their plans.
Backtesting Your Approach
Backtesting allows traders to test their strategy on historical data before committing to real capital. By simulating trades under past market conditions, traders can assess effectiveness, identify weaknesses, and refine their approach.
The process involves defining clear strategy rules, gathering historical market data, and applying the strategy to past price movements. Key metrics to track include win rate, profit factor, maximum drawdown, and risk-adjusted returns (Sharpe ratio). Analyzing these results helps refine the strategy while avoiding overfitting, which can lead to unrealistic expectations in live trading.
By systematically backtesting, traders can gain confidence, enhance risk management, and improve decision-making before executing trades in real market conditions.
Maintaining a Swing Trading Journal
Keeping a trading journal is essential for tracking performance, similar to the practices outlined in our guide on how to trade cryptocurrency.
What to Record in Your Swing Trading Journal
Each trade should be documented with key details, including entry and exit prices, position size, and market conditions during execution. Traders should also capture screenshots of trade setups, note their entry rationale, and record any emotions experienced during the trade. Evaluating what worked well and what went wrong helps recognize behavioural patterns and refine decision-making.
Review Process:
A structured review process enhances learning and growth—this includes a weekly review of all trades, a monthly performance assessment, and quarterly strategy adjustments based on insights from the journal. By consistently maintaining and analyzing a trading journal, traders can develop greater discipline, improve their execution, and enhance long-term profitability.
Getting Started with Swing Trading at TMGM
Free Swing Trading Courses & Resources
Becoming a successful trader requires skill, knowledge, and practice. TMGM provides comprehensive trading courses and webinars to help you develop your expertise. A free demo account with US$100,000 in virtual funds allows you to practice trading in a risk-free environment and refine your strategies.
TMGM also offers trading strategy insights, TMGM Market News & Analysis and proprietary tools like Acuity, Economic Calendar and more, tailored for traders of all experience levels.
Trade Smarter Today


Frequently Asked Questions (FAQs) for What is Swing Trading?
What is Swing Trading?
Which strategy is best for swing trading?
What is the 2% rule in swing trading?
What is the 3-5-7 rule in trading?
How long does a swing trader typically hold a trade/position?

Account
Account
Instantly

