
Cardano Price Forecast: Derivatives and on-chain losses compound bearish trend
Di Manish Chhetri
Aggiornato: 19 Jun 2026


ARTICOLI POPOLARI

Cardano (ADA) remains under pressure, trading below $0.165 at the time of writing on Friday, losing over 11% so far this week. Weakening derivatives metrics and deteriorating on-chain data support further correction on ADA.
- Cardano extends losses, trading below $0.165 on Friday, slipping over 11% so far this week.
- Derivatives metrics cap ADA's upside move as short bets rise and open interest declines.
- Santiment NPL data shows a dip, indicating that investors are, on average, realizing losses and adding to near-term bearish pressure.
Cardano (ADA) remains under pressure, trading below $0.165 at the time of writing on Friday, losing over 11% so far this week. Weakening derivatives metrics and deteriorating on-chain data support further correction on ADA.
Derivatives metrics show bearish bias
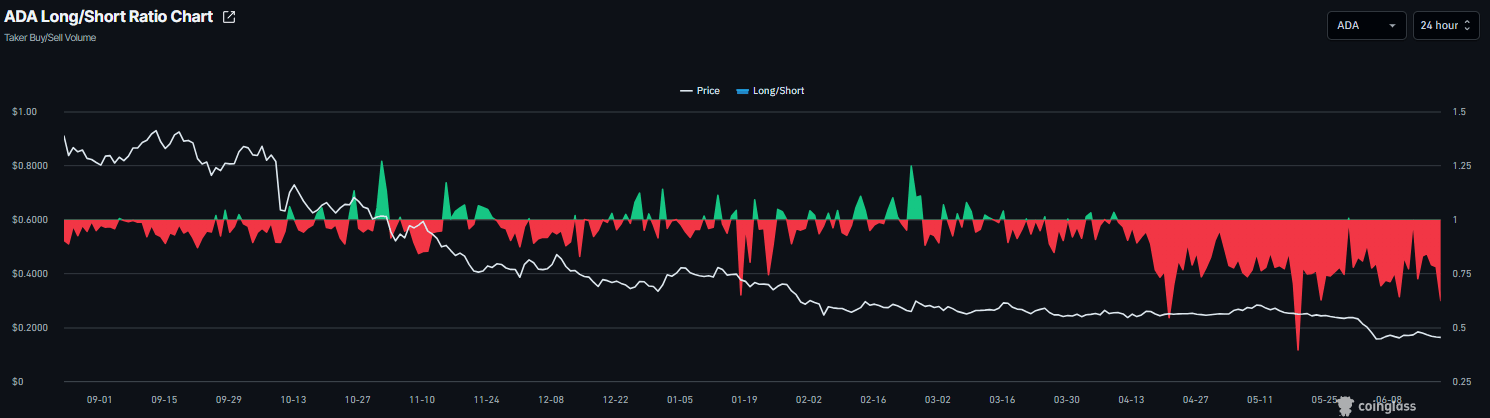
Cardano derivatives metrics support a negative outlook. CoinGlass’ long-to-short ratio for ADA reads 0.62 on Friday, nearing its lowest level in over a month. This ratio, being below one, reflects bearish sentiment in the market, as more traders are betting on the asset’s price to fall.
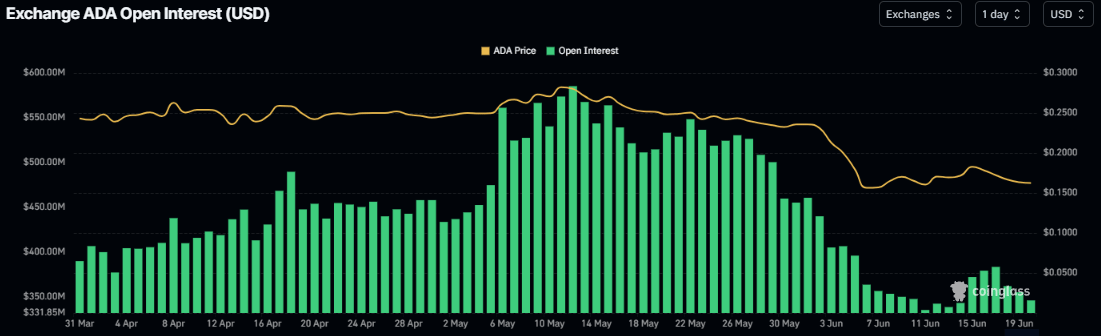
In addition, Cardano’s futures Open Interest (OI) dropped to $345 million on Friday after a mild rise in mid-June but has been continuously falling since mid-May. This drop in OI reflects waning investor participation and projects a bearish outlook.
Holders realizing losses add selling pressure
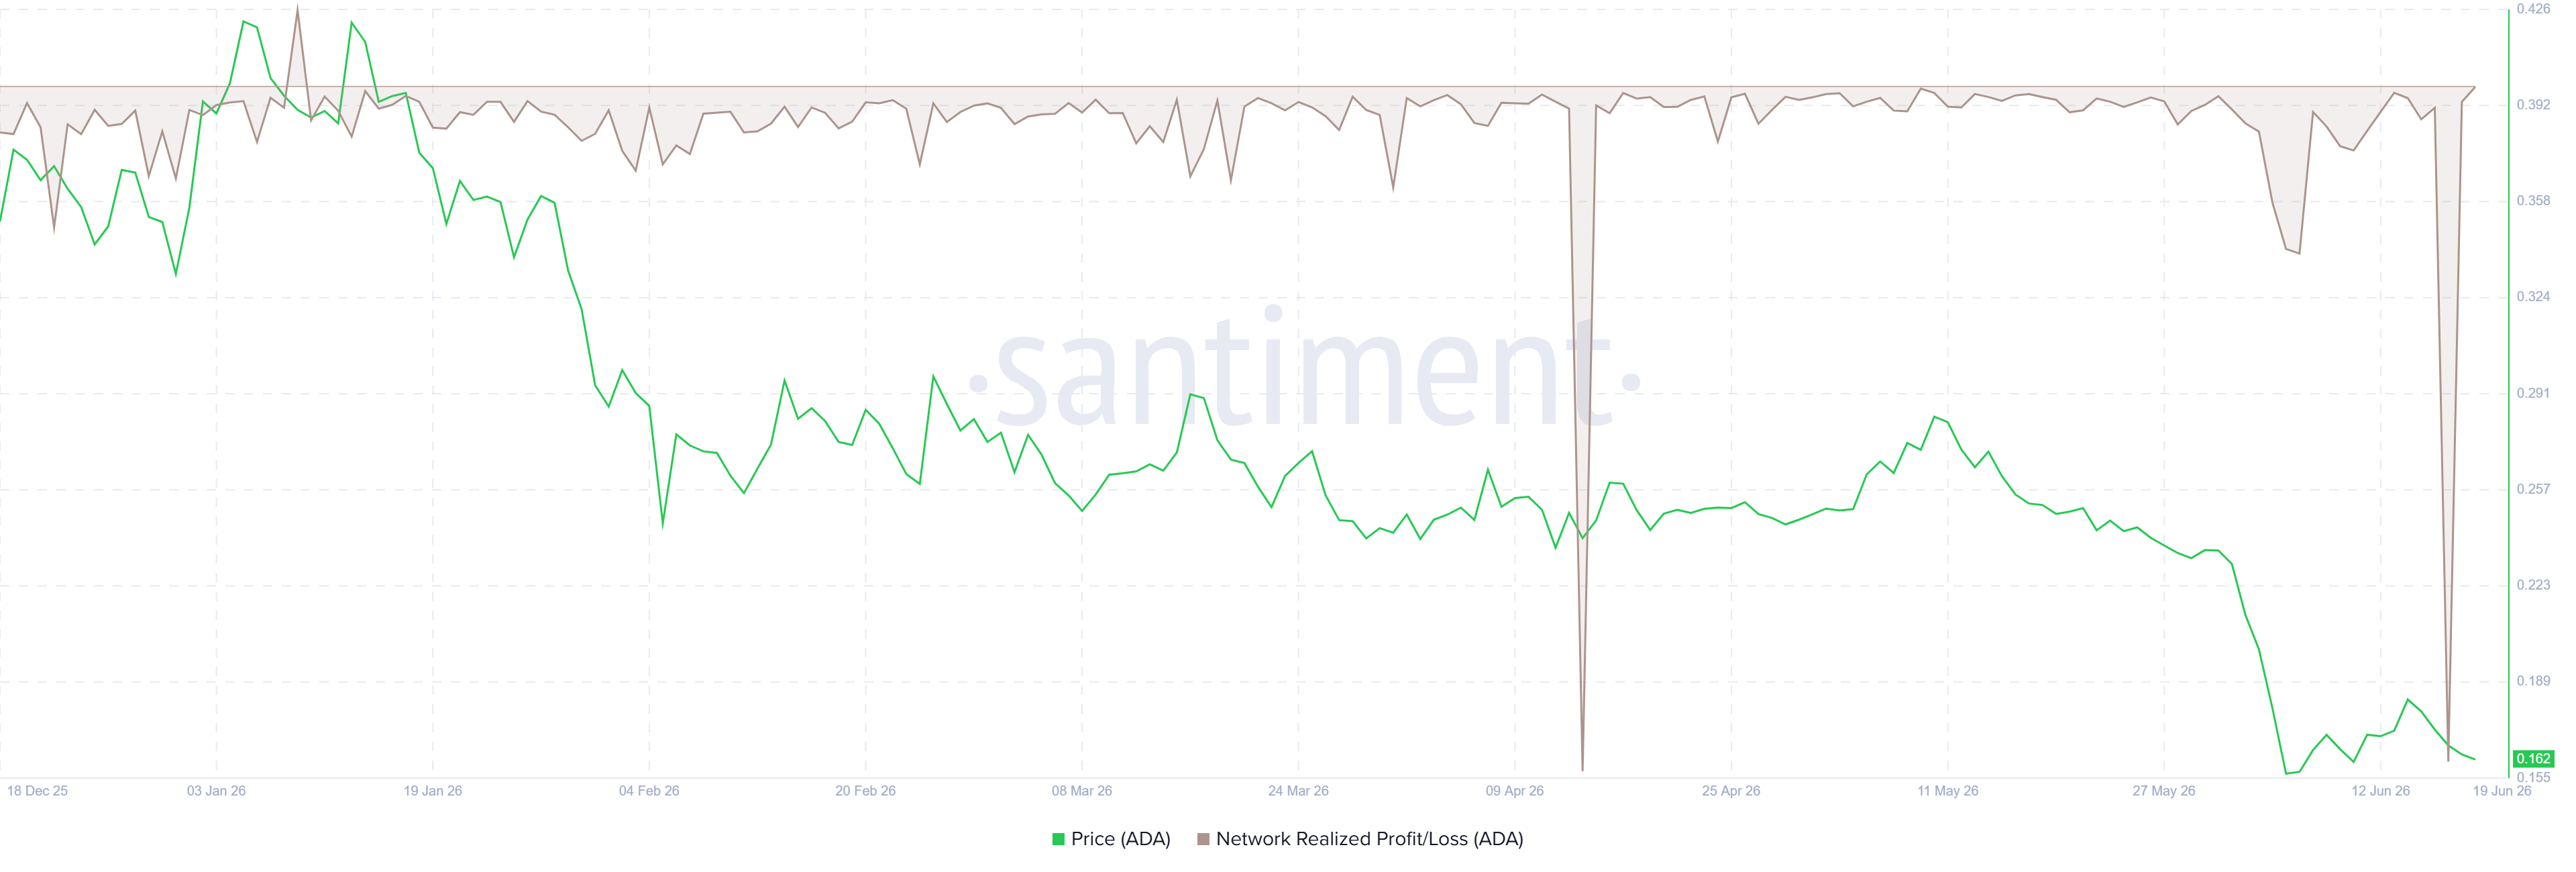
On-chain data provider Santiment's Network Realized Profit/Loss (NPL) indicator for Cardano dipped sharply on Wednesday, indicating that holders were, on average, realizing losses and signaling panic selling and market capitulation, reflecting short-term bearish sentiment.
Meanwhile, prolonged capitulation can also indicate that selling pressure is nearing exhaustion, potentially paving the way for a rebound if buying demand returns. This was seen recently during the mid-April dip, after which ADA prices recovered slightly.
Cardano Price Forecast: Resumes downward trend
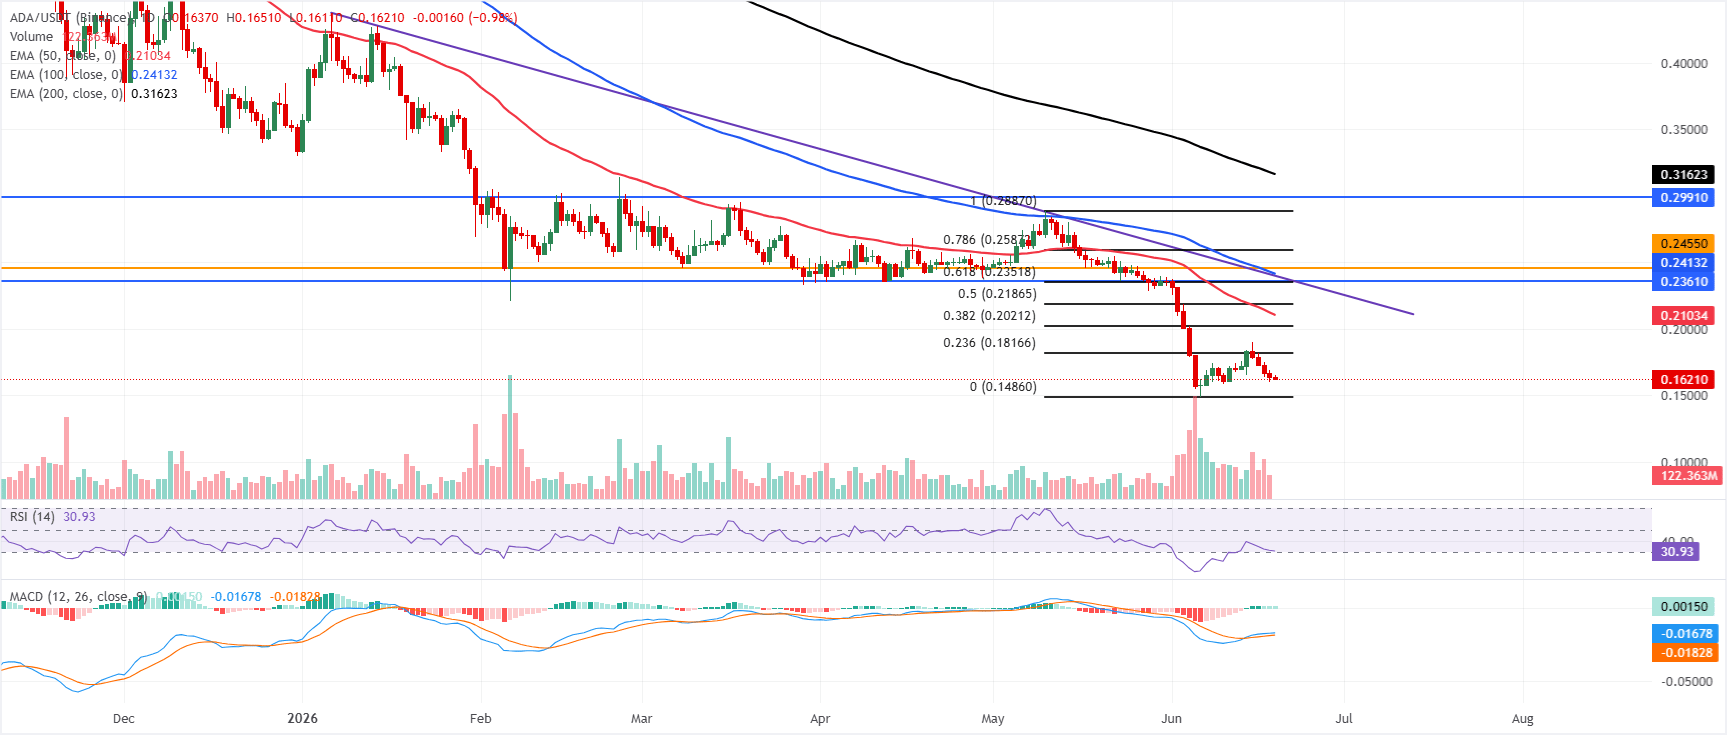
Cardano price trades at $0.162 on Friday, extending a firmly bearish near-term tone as price holds well below the 50-day, 100-day and 200-day Exponential Moving Averages (EMAs) clustered from roughly $0.210 to $0.320.
The Relative Strength Index (RSI) on the daily chart hovers just above the oversold band near 31, hinting that downside momentum is stretched but not yet reversing, while the Moving Average Convergence Divergence (MACD) has turned marginally positive, suggesting only a tentative loss of bearish pressure rather than a clear shift in trend.
On the topside, initial resistance emerges at the 23.6% Fibonacci retracement at $0.181, ahead of the 38.2% Fibonacci retracement at $0.202 and the 50-day EMA at $0.210. Further up, a dense barrier is formed by the 50% retracement at $0.218, the 61.8% Fibonacci retracement at $0.235, the horizontal caps at $0.236 and $0.245, the downtrend break level near $0.239 and the 100-day EMA at $0.241.
On the downside, immediate support is only at the June 6 low near $0.148; a break of that level would expose fresh bearish territory.
(The technical analysis of this story was written with the help of an AI tool.)

Oltre un milione di utenti si affida a FXStreet per dati di mercato in tempo reale, strumenti di charting, approfondimenti di esperti e notizie Forex. Il loro calendario economico completo e i webinar formativi aiutano i trader a rimanere informati e a prendere decisioni ponderate. FXStreet conta circa 60 professionisti tra la sede di Barcellona e diverse regioni globali.
Leggi di più


