

Crypto Market Overview: Bitcoin loses steam around $63,000 – DeFi tokens rally
- Bitcoin edges lower on Tuesday after six straight days of recovery.
- Market sentiment holds steady, with Strategy selling 3,588 BTC on Monday to fund its Digital Credit dividends.
- DeXe and LayerZero emerge as top performers over the last 24 hours.
Bitcoin (BTC) sustains above $63,000 at press time on Tuesday, upholding a streak of six consecutive days of gains despite Strategy selling 3,588 BTC on Monday. The broader crypto market sentiment holds while DeFi tokens such as DeXe (DEXE) and LayerZero (ZRO) emerge as top gainers over the last 24 hours.

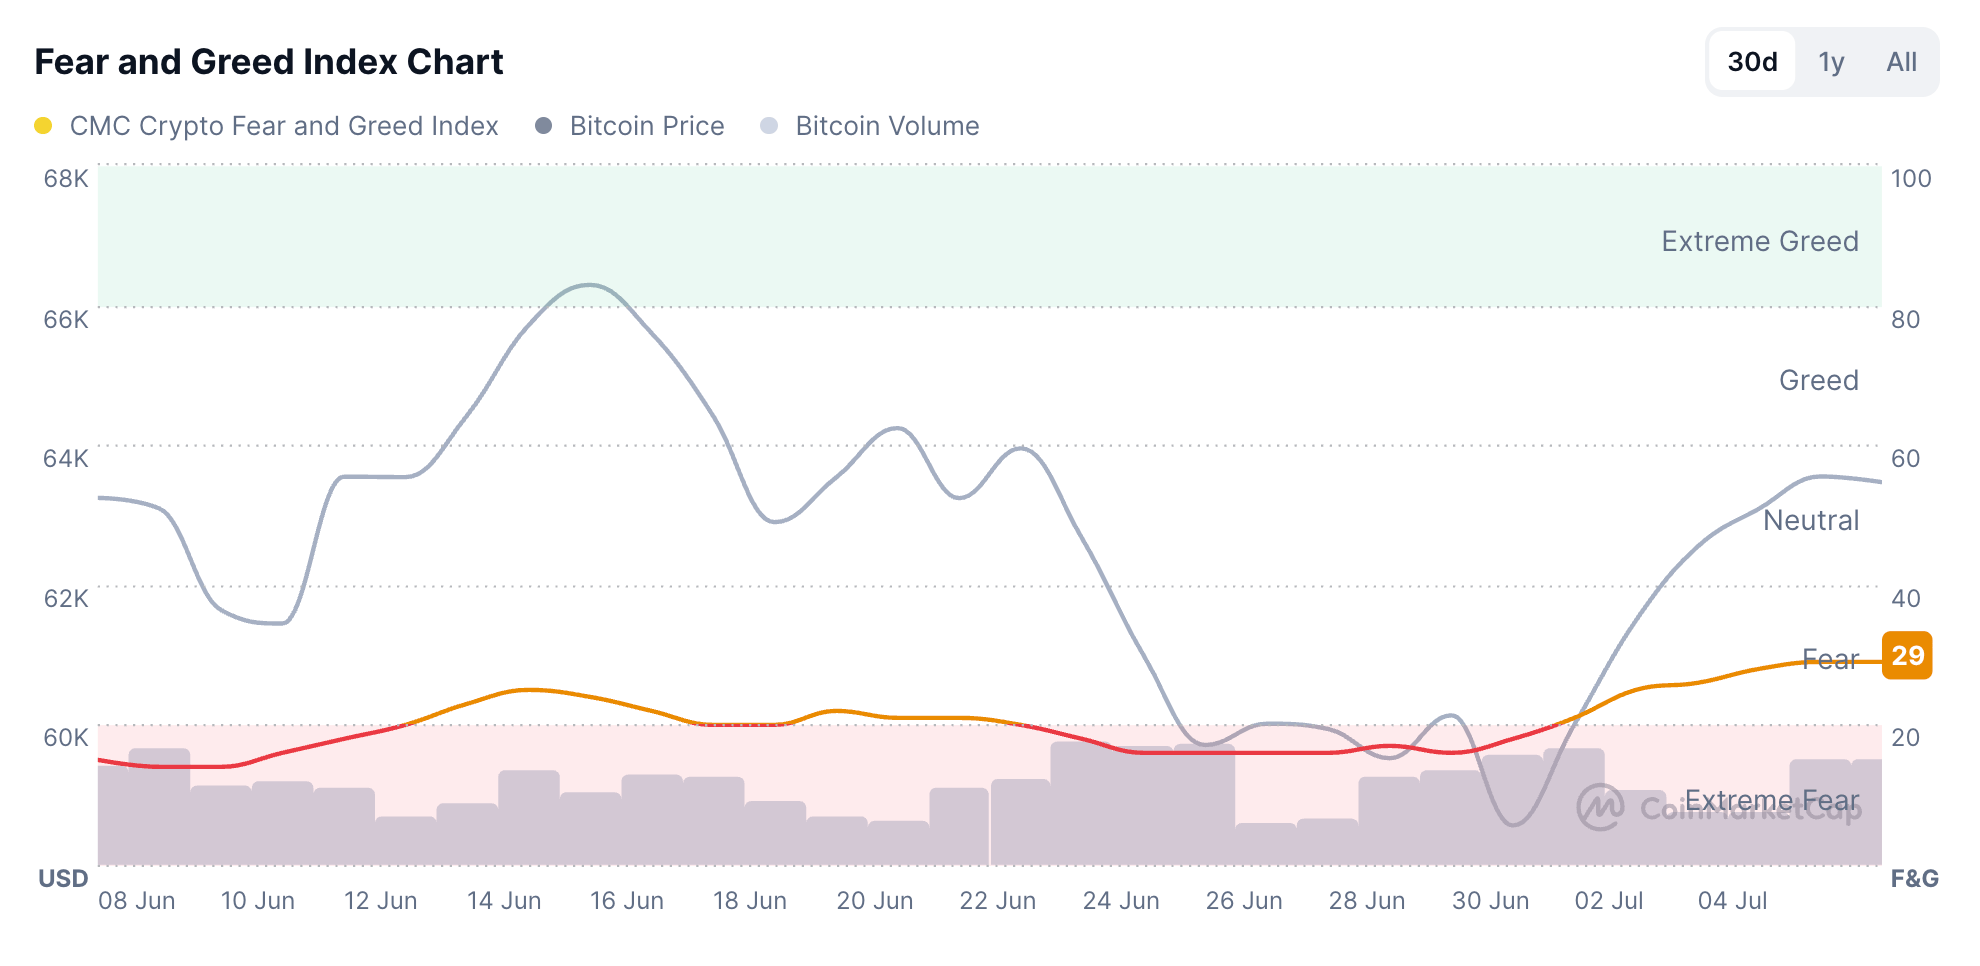
CoinMarketCap’s Fear and Greed Index remains at 29 on Tuesday, up from last week’s “Extreme Fear” zone, indicating an easing in selling pressure.
Bitcoin risks reversing its short-term recovery
Bitcoin edges lower on Tuesday, risking its near-term recovery tone. The King Crypto approaches the 50-day Exponential Moving Average (EMA) at $65,707, which is below the 200-day EMA near $75,642, implying a broader downward trend.
From a technical perspective, short-bodied candles forming near the $65,000 mark, close to the 50-day EMA at $65,707, imply that bulls are facing headwinds. A decisive close above this zone could extend its rally toward the $70,000 round figure.
That said, Moving Average Convergence Divergence (MACD) maintains an upward trend with expanding positive histograms, suggesting firm bullish momentum. Meanwhile, the Relative Strength Index (RSI) at 52 reinforces a modest recovery in momentum that has yet to overcome overhead supply.
On the downside, immediate support is seen at the horizontal zone around $60,000, where buyers could attempt to slow the decline if selling resumes.
DeXe and LayerZero regain strength
DeXe trades above $27 at press time on Tuesday, extending its bullish run as price holds well above both the 50-day EMA at $19.42 and the 200-day EMA at $12.36. This stacked configuration of short- and long-term EMAs below the market suggests a firmly supported uptrend. The RSI near 69 hints at strong, borderline overbought momentum, while the MACD extends higher into the positive territory, reinforcing the constructive bias.
Looking up, the R1 Pivot Point at $28.14 serves as the immediate resistance, guarding the upside to the R2 Pivot Point at $33.01.
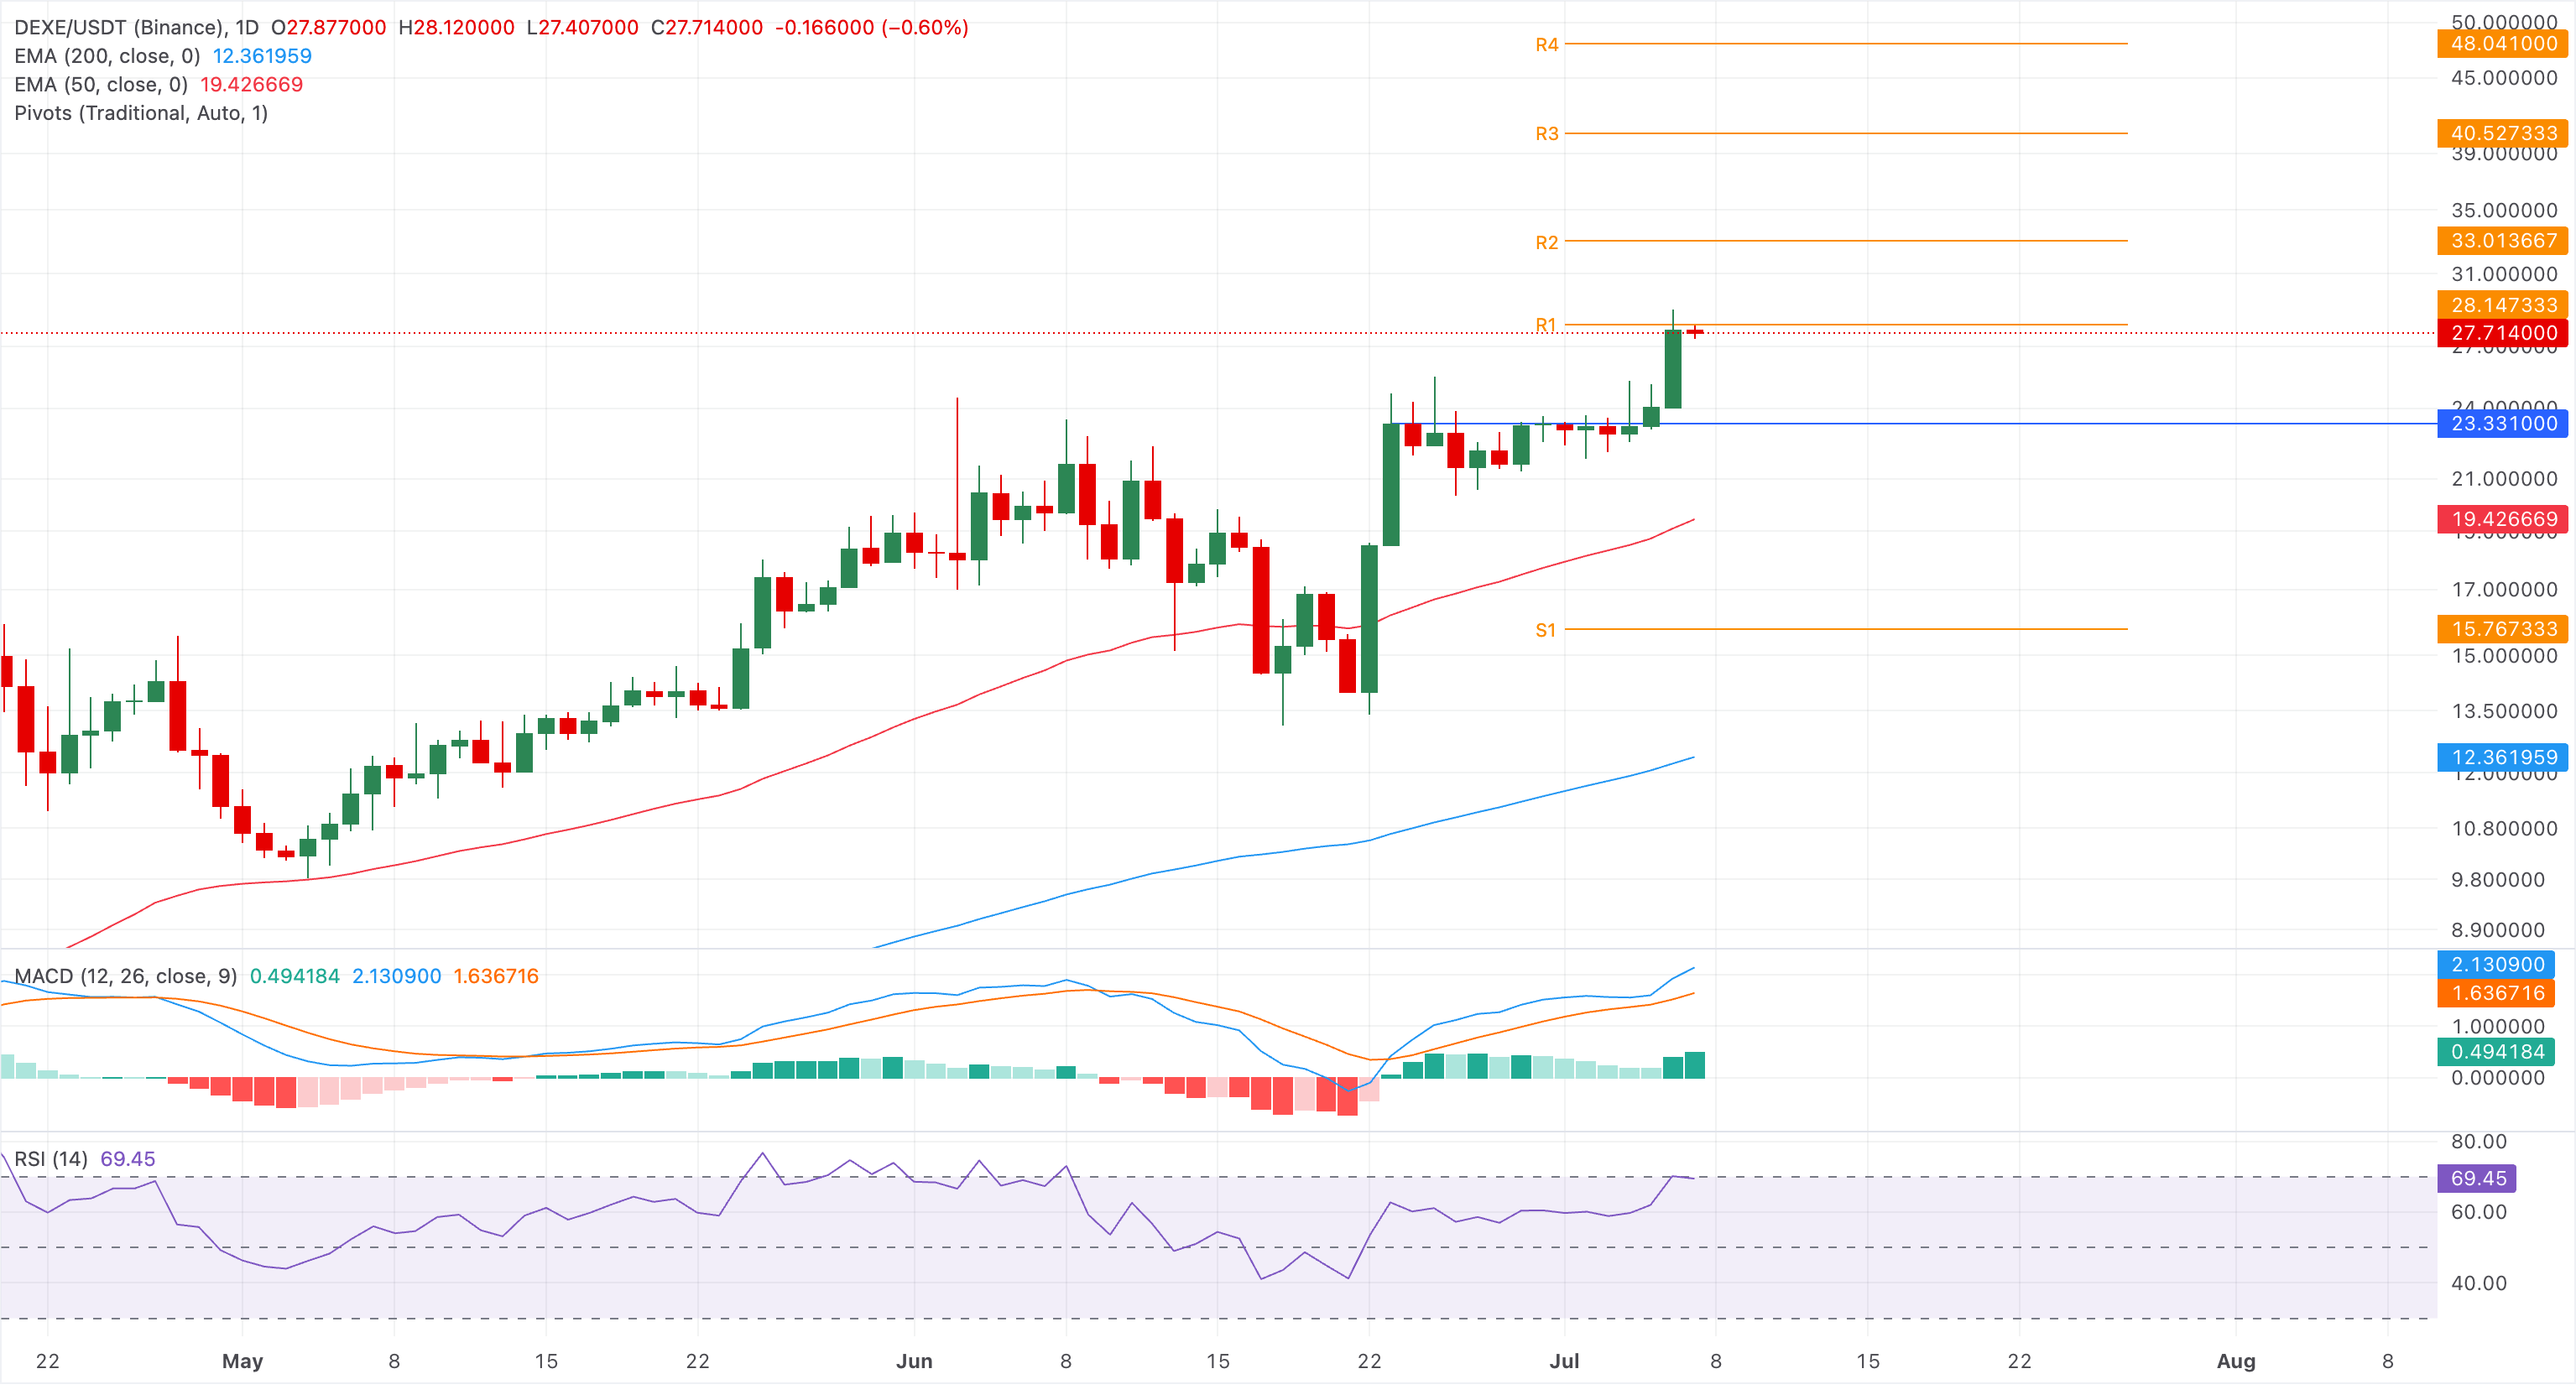
Looking down, the resistance-turned-support level is marked by the June 23 close of $23.33, followed by a more meaningful structural floor at the 50-day EMA around $19.42, with the 200-day EMA at $12.36 underpinning the broader bullish cycle.
LayerZero holds above $1.00 at press time on Tuesday, maintaining a near-term recovery tone as it tests the 50-period EMA at $1.0396 and well below the 200-period EMA at $1.4589. Despite this capped structure, momentum has improved, with the MACD above its signal with positive expanding histograms, while the RSI hovers near 60, hinting at a recovery phase rather than outright oversold conditions.
If ZRO clears the 50-day EMA at $1.0396, it could extend the recovery toward the 50% retracement of the downswing from $2.3930 to $0.7340, at $1.3253.
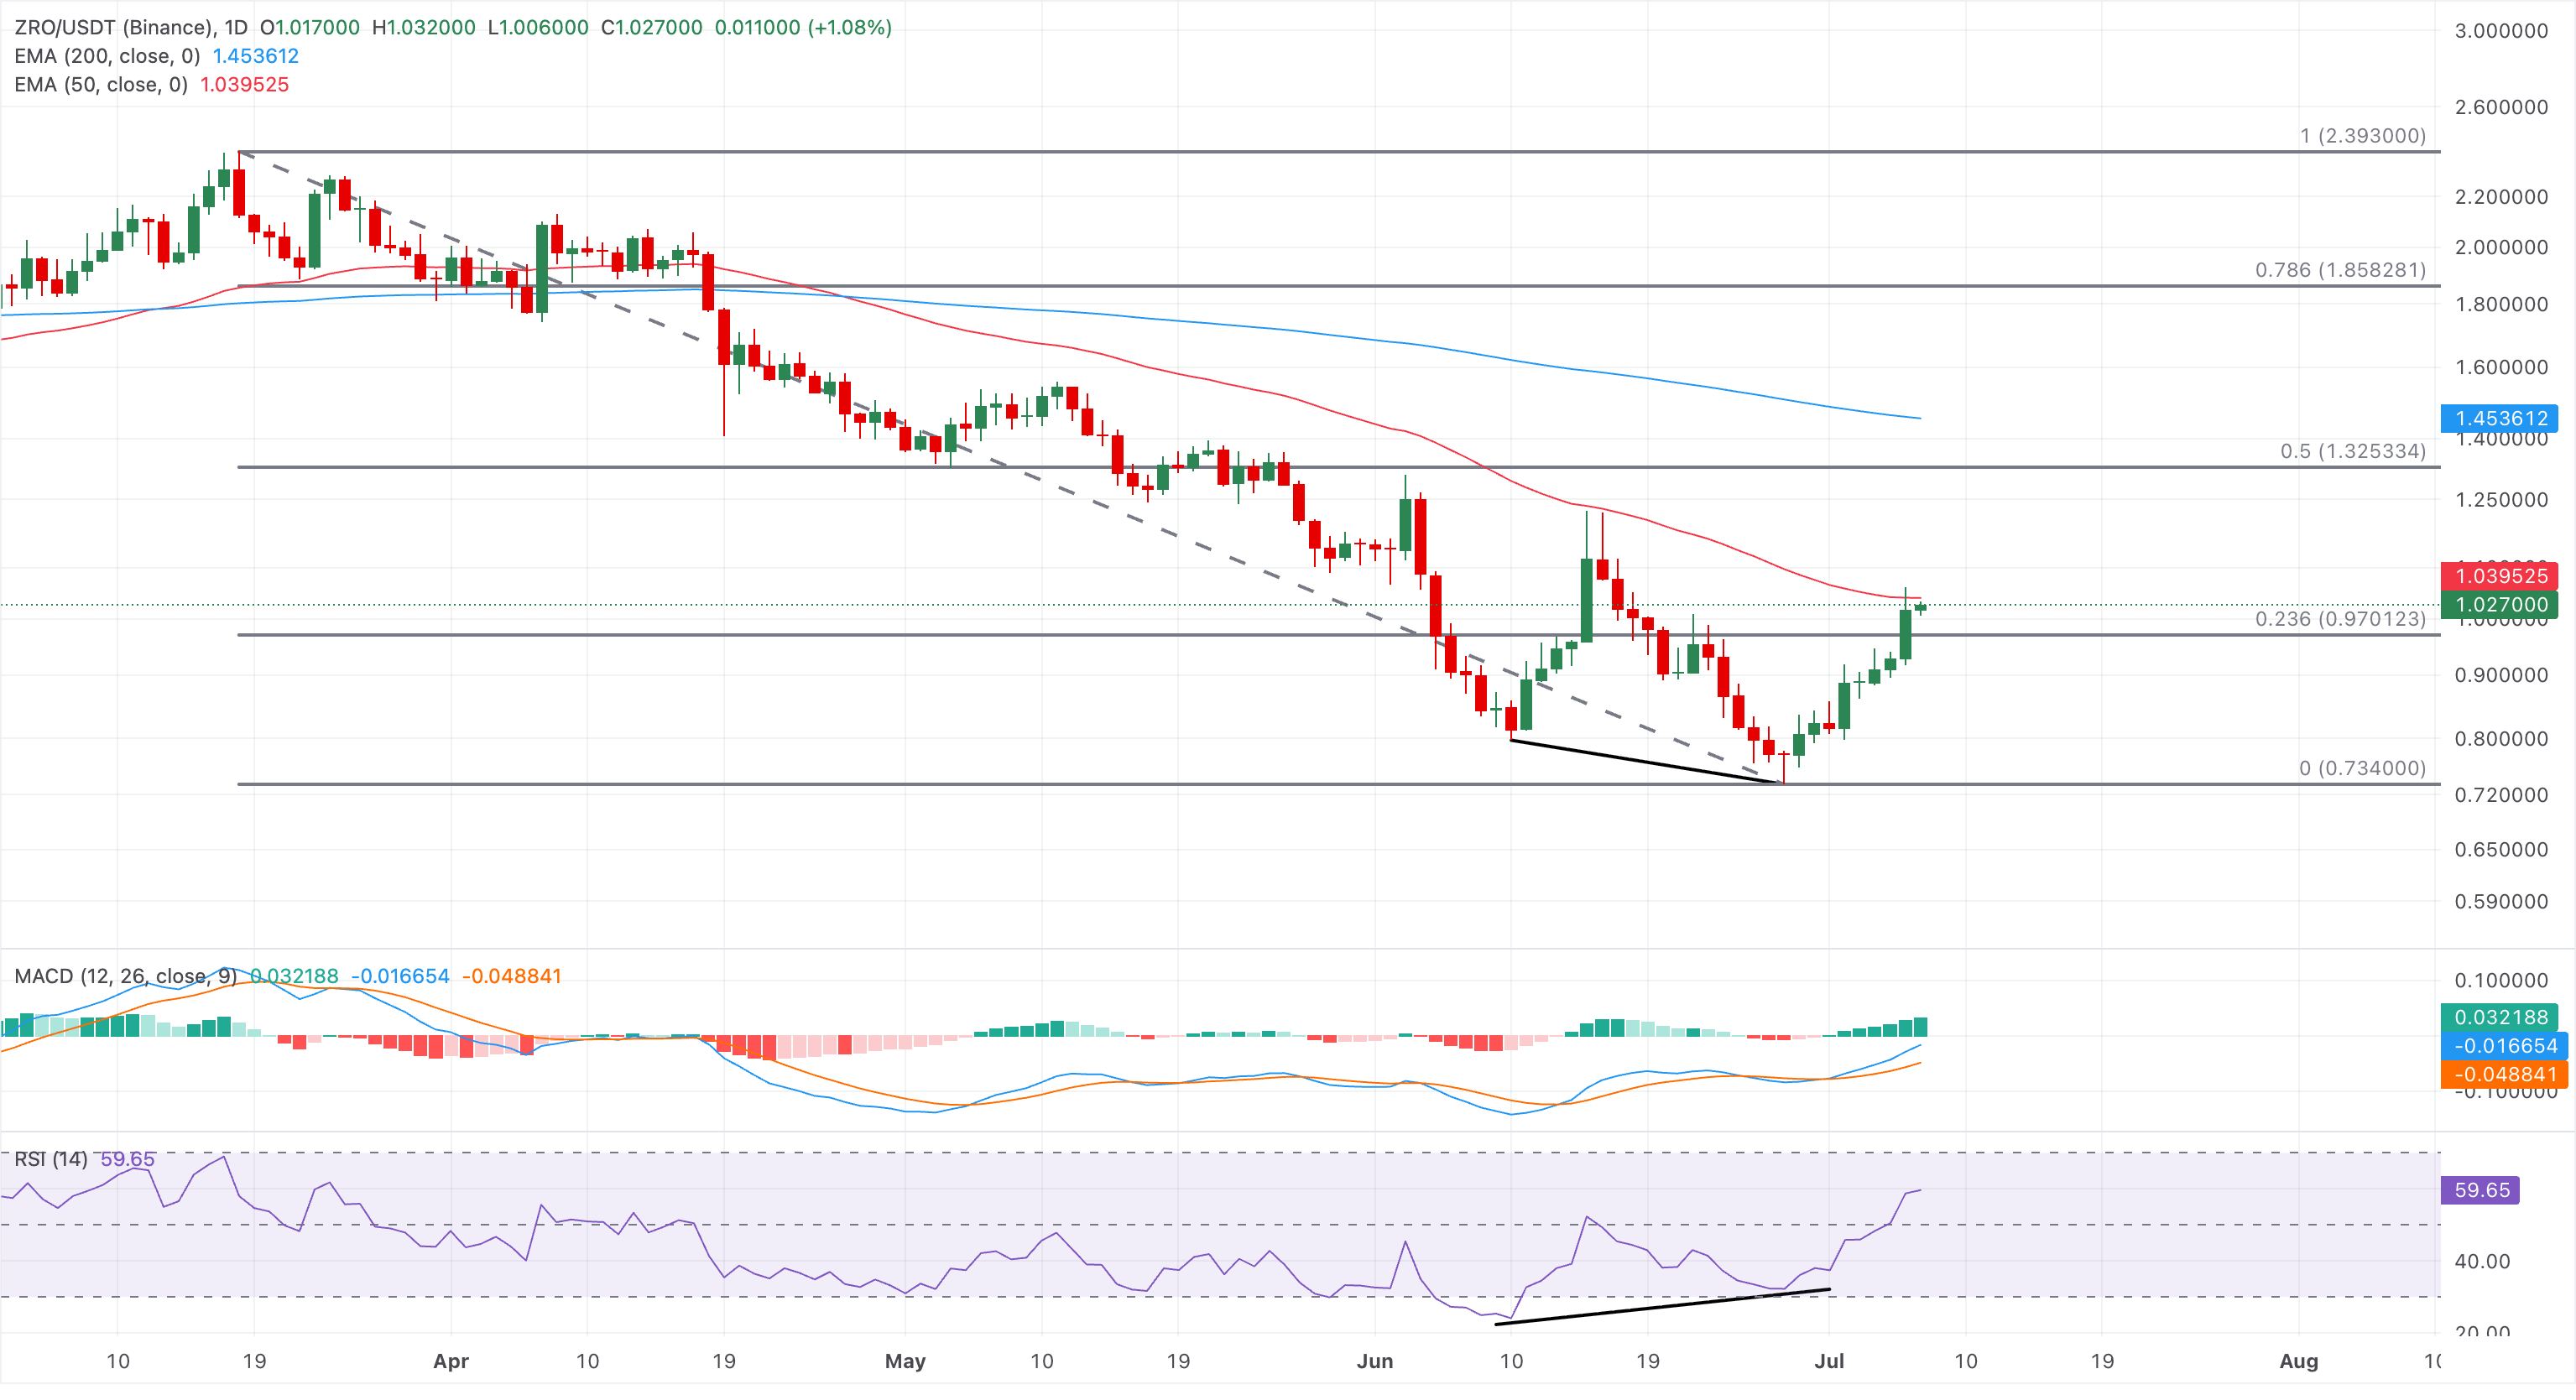
On the flip side, the 23.6% Fibonacci retracement at $0.9701 serves as the immediate, meaningful structural support, followed by the Fibonacci anchor around $0.7340, where the prior cycle low could attract dip-buying if selling pressure resumes.
(The technical analysis of this story was written with the help of an AI tool. Know more.)














