

Crypto Today: Bitcoin, Ethereum, XRP face increasing selling pressure as imminent US-Iran deal seems unlikely
- Bitcoin corrects toward $76,000, weighed down by escalating tensions in the Middle East after US "self-defense" strikes around the Strait of Hormuz.
- Ethereum slips below $2,100, reflecting growing risk-off sentiment despite Iranian negotiators’ meeting in Qatar to finalize the US-Iran MoU.
- XRP extends losses below $1.35 and holds above the SuperTrend indicator’s dynamic support at $1.32.
Cryptocurrency prices continue to trade under pressure on Tuesday, with Bitcoin (BTC) retracing toward the key $76,000 support zone amid persistent risk aversion. Ethereum (ETH) is below the $2,100 threshold, while Ripple (XRP) consolidates under $1.35 after facing resistance at $1.37.

Military strikes threaten US-Iran peace negotiations
The doldrums across global markets follow the United States (US) military strikes launched on Southern Iran around the Strait of Hormuz on Monday. US Central Command (Centcom) spokesperson Captain Tim Hawkins said in a statement that the strikes were taken in “self-defense” and were designed “to protect our troops from threats posed by Iranian forces."
It remains unclear what impact the latest US strikes will have on any potential peace agreement between the two countries. Iran's Islamic Revolutionary Guard Corps (IRGC) said on Tuesday that the Middle East nation had the “legitimate definite” right to retaliate against any US ceasefire violations, according to a BBC report.
Following the strikes, US Secretary of State Marco Rubio emphasized that a peace deal is still possible, alluding to the planned talks in Doha on Tuesday between Iran’s top negotiators, Foreign Minister Abbas Araghchi and Qatar’s Prime Minister. The meeting is expected to finalize the memorandum of understanding (MoU) between the US and Iran.
“We'll see if we can make progress. I think it's a lot of talking back and forth going on about specific language in the initial document, so it'll take a few days,” Rubio told reporters during his visit to India.
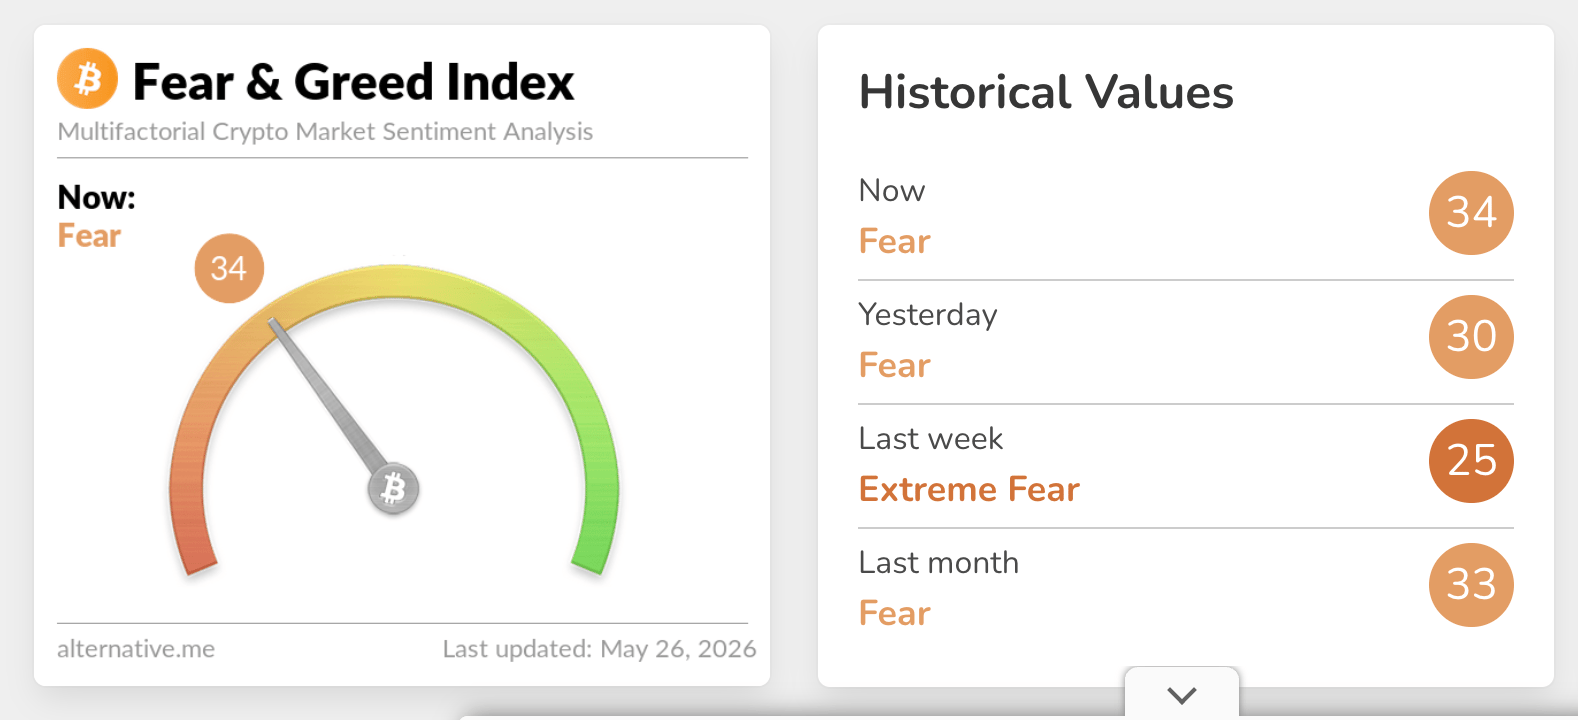
Meanwhile, sentiment toward crypto assets remains at 34 in the Fear Territory on Tuesday, up from 30 the day before, according to the Fear & Greed Index. Despite the slight improvement, risk appetite is relatively low as investors gauge the impact of the war on the global economy, especially amid US inflation continuing to rise.
Price analysis: Bitcoin pressured as losses linger
Bitcoin trades at $76,668, keeping a bearish near-term bias as price holds beneath the 50-day, 100-day and 200-day Exponential Moving Averages (EMAs) clustered between roughly $76,784 and $81,285. This stacked configuration of short and long-term EMAs above the spot price suggests rallies are being capped, while the Relative Strength Index (RSI) drifts below the 50 midline on the daily chart, hinting at waning bullish momentum rather than outright oversold conditions.
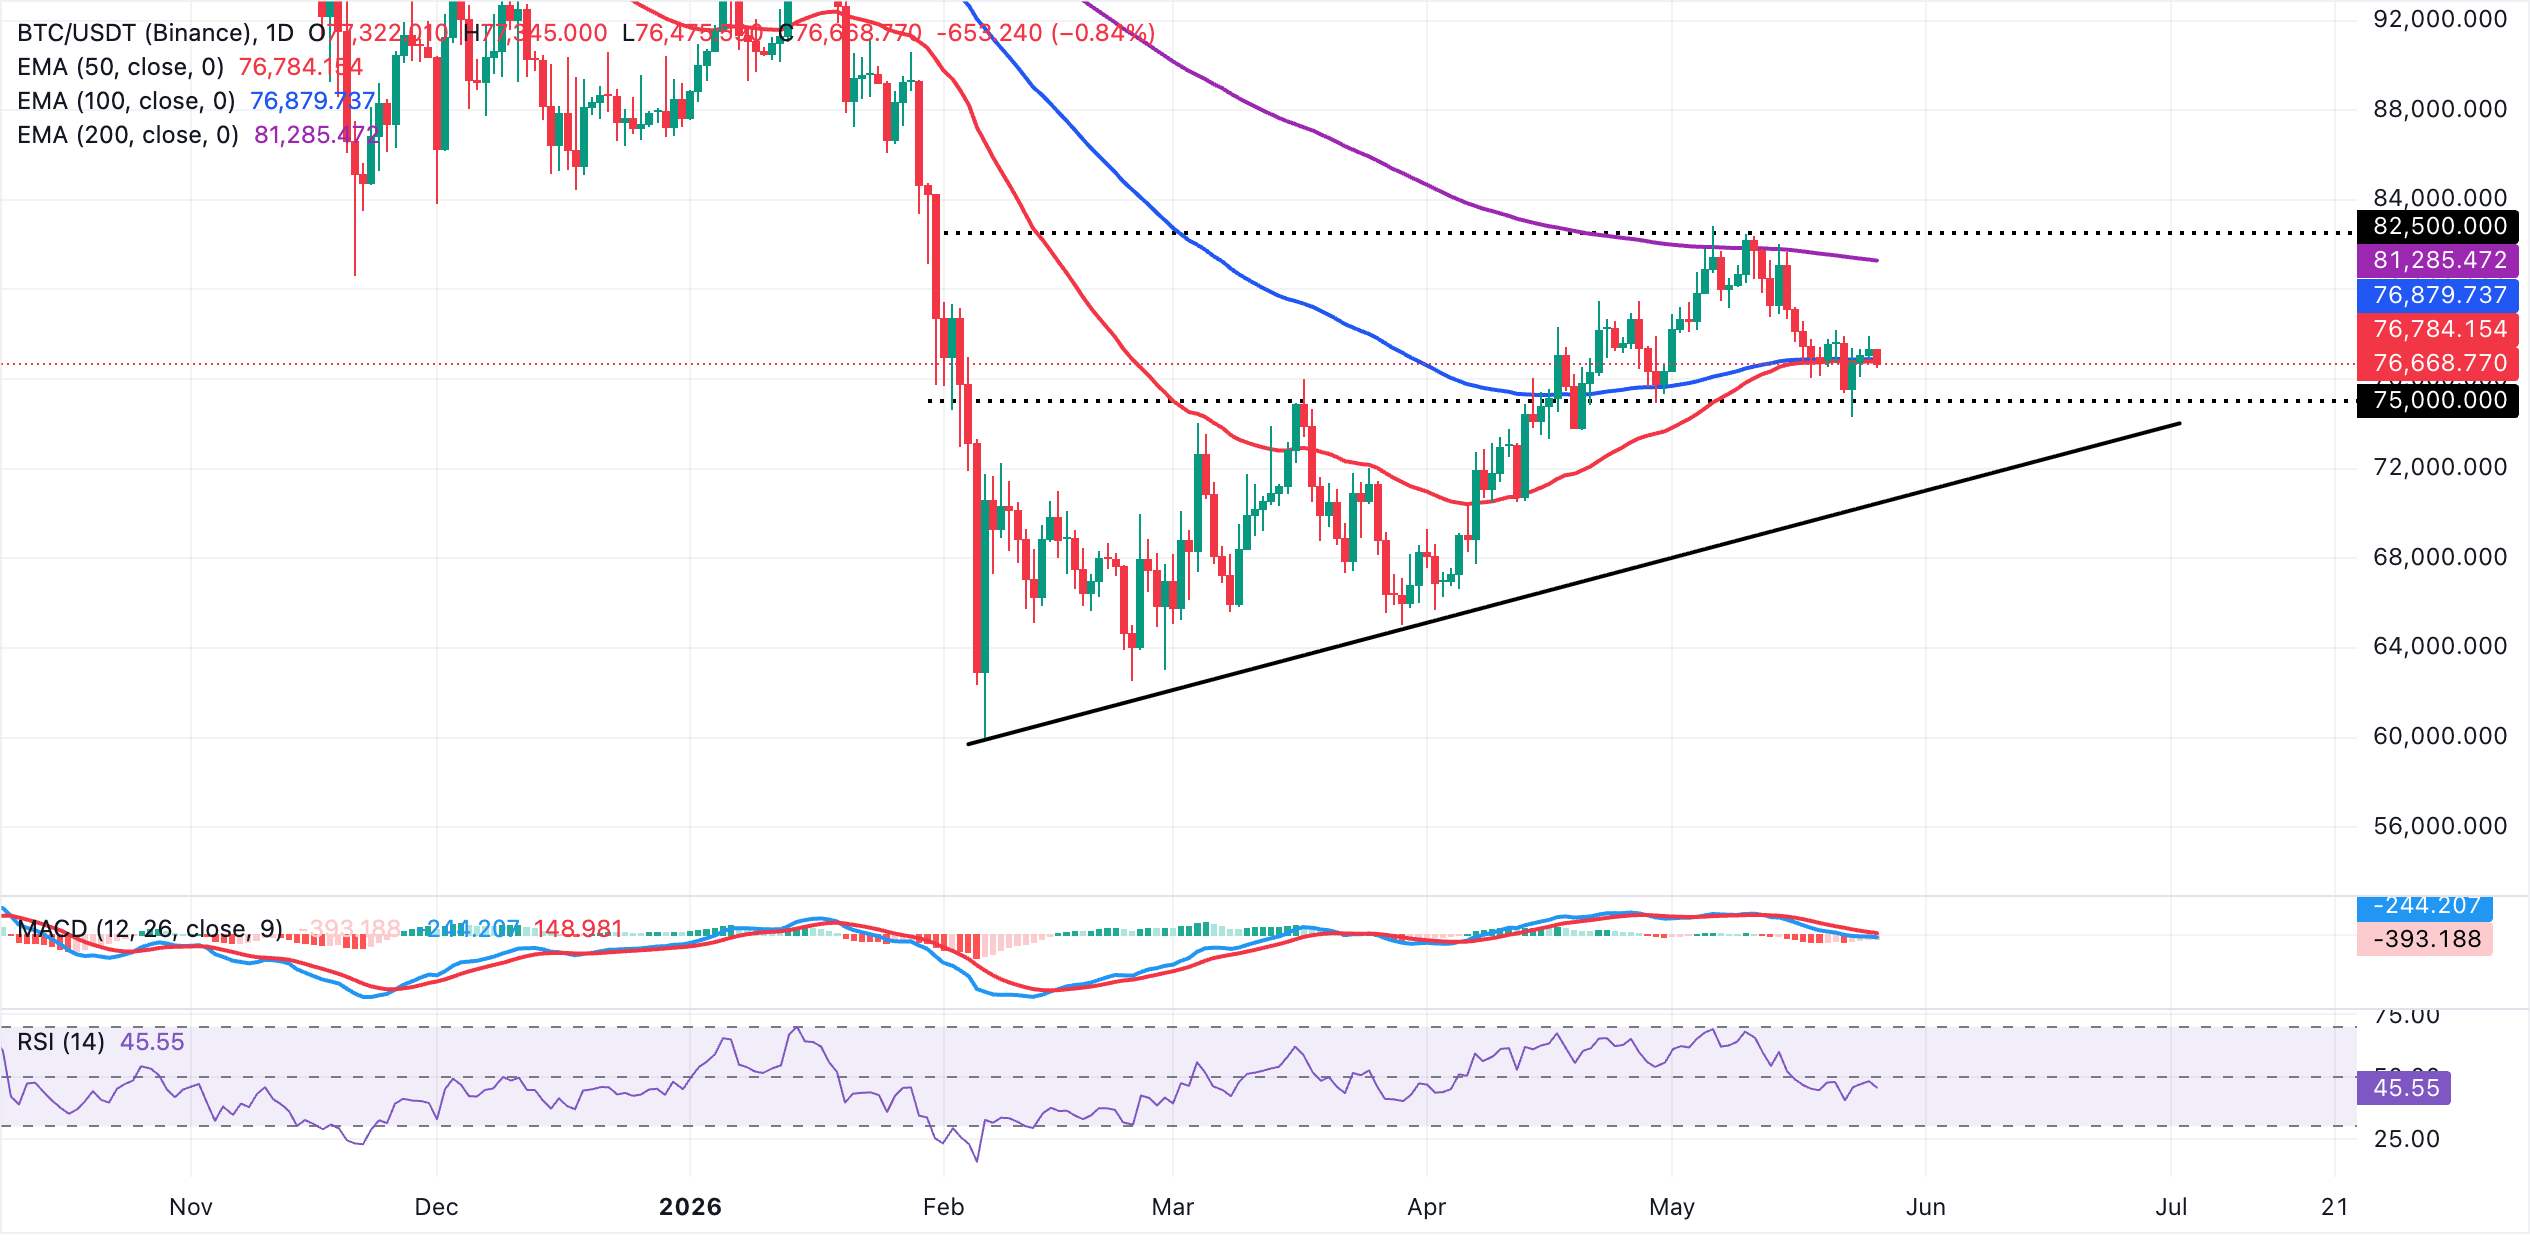
On the topside, initial resistance emerges at the 50-day EMA near $76,784, followed by the 100-day EMA around $76,880, with a more substantial barrier at the 200-day EMA close to $81,285. On the downside, the key structural floor is the rising trend-line support, with its break price marked near $70,500. A daily close below this area would likely accelerate bearish pressure and open the door to a deeper corrective phase.
Altcoins technical outlook: Ethereum and XRP sellers tighten grip
Ethereum trades at $2,095, maintaining a bearish near-term bias as price holds beneath the key moving averages. The 50-day EMA at $2,217, the 100-day EMA at $2,294 and the 200-day EMA at $2,516 all sit overhead as layered dynamic resistance, suggesting rallies are likely to be capped while the pair remains below this cluster.
Momentum indicators echo the weak structure, with the RSI hovering in the high-30s on the daily chart and the Moving Average Convergence Divergence (MACD) histogram in negative territory, hinting that downside pressure remains dominant despite occasional rebounds.
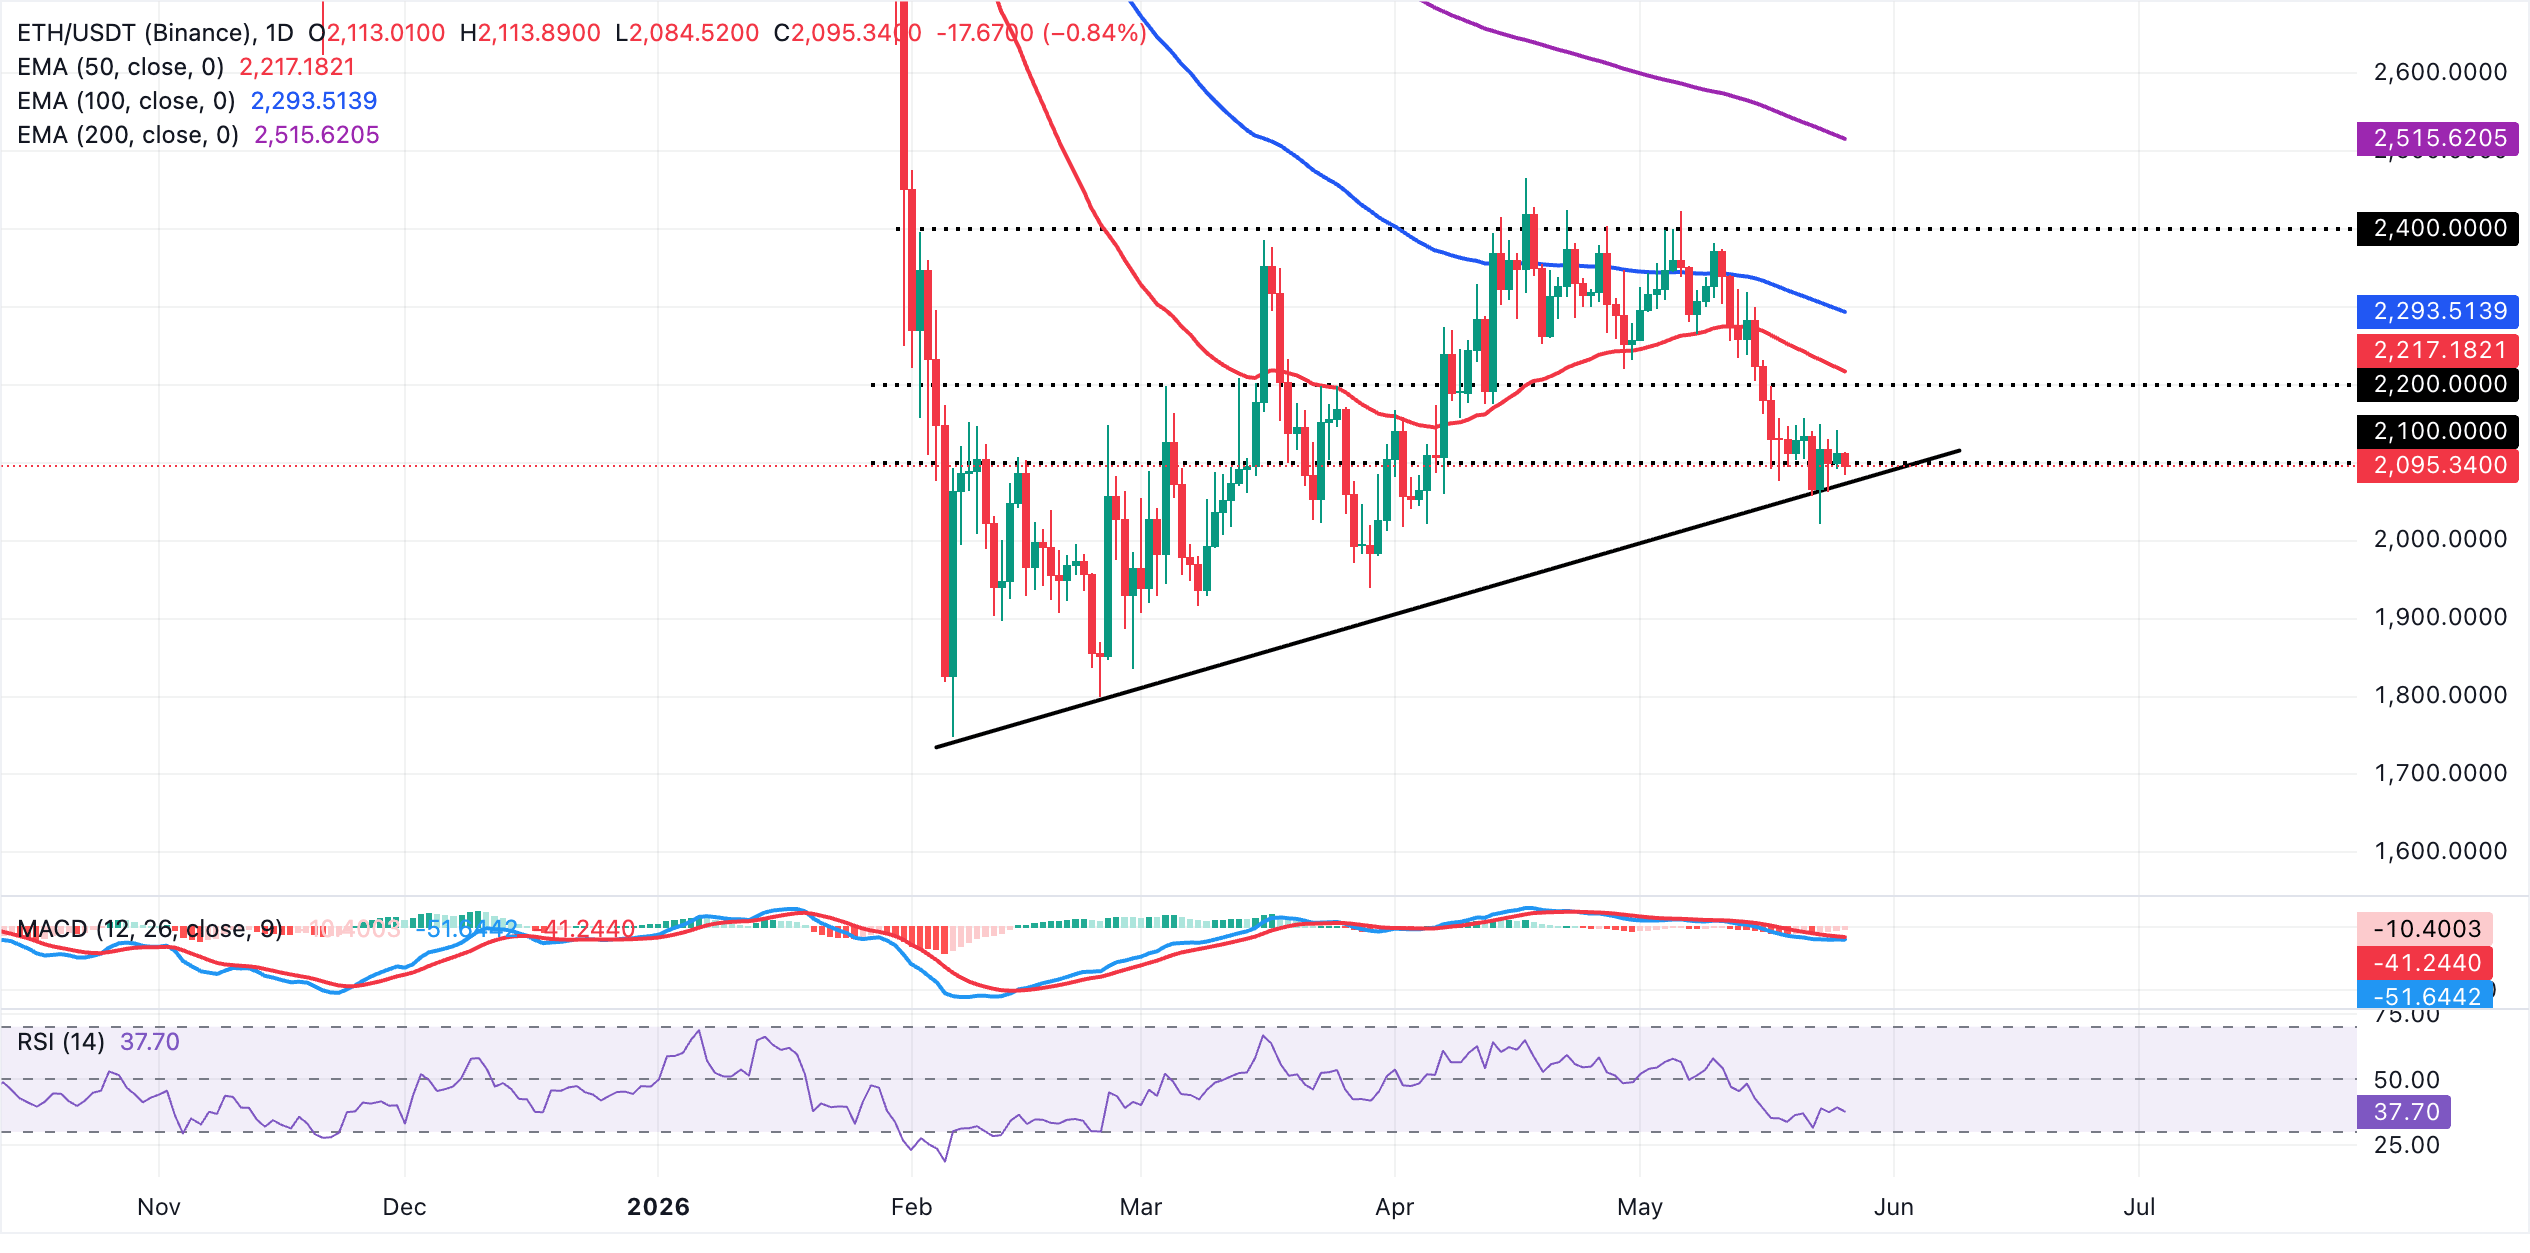
On the downside, initial support is aligned with the rising trendline area around $2,074, where buyers may attempt to stabilize price on dips. A clear break beneath this level would expose further downside and reinforce the existing bearish structure. On the topside, a recovery above the 50-day EMA at $2,217 would be the first indication that sellers are losing control, with subsequent resistance emerging at the 100-day EMA near $2,294 and then the 200-day EMA at $2,516. Buyers would need to reclaim these levels to signal a more durable bullish reversal.
XRP, on the other hand, trades at $1.34, holding in a bearish near-term bias as price sits below the 50-day EMA near $1.40, the 100-day EMA at $1.47 and the 200-day EMA at $1.68. The downside trend is reinforced by weak momentum signals, with the RSI hovering near 40 on the daily chart and the MACD histogram in negative territory, hinting that rallies are likely to meet selling pressure while the moving averages cap the topside.
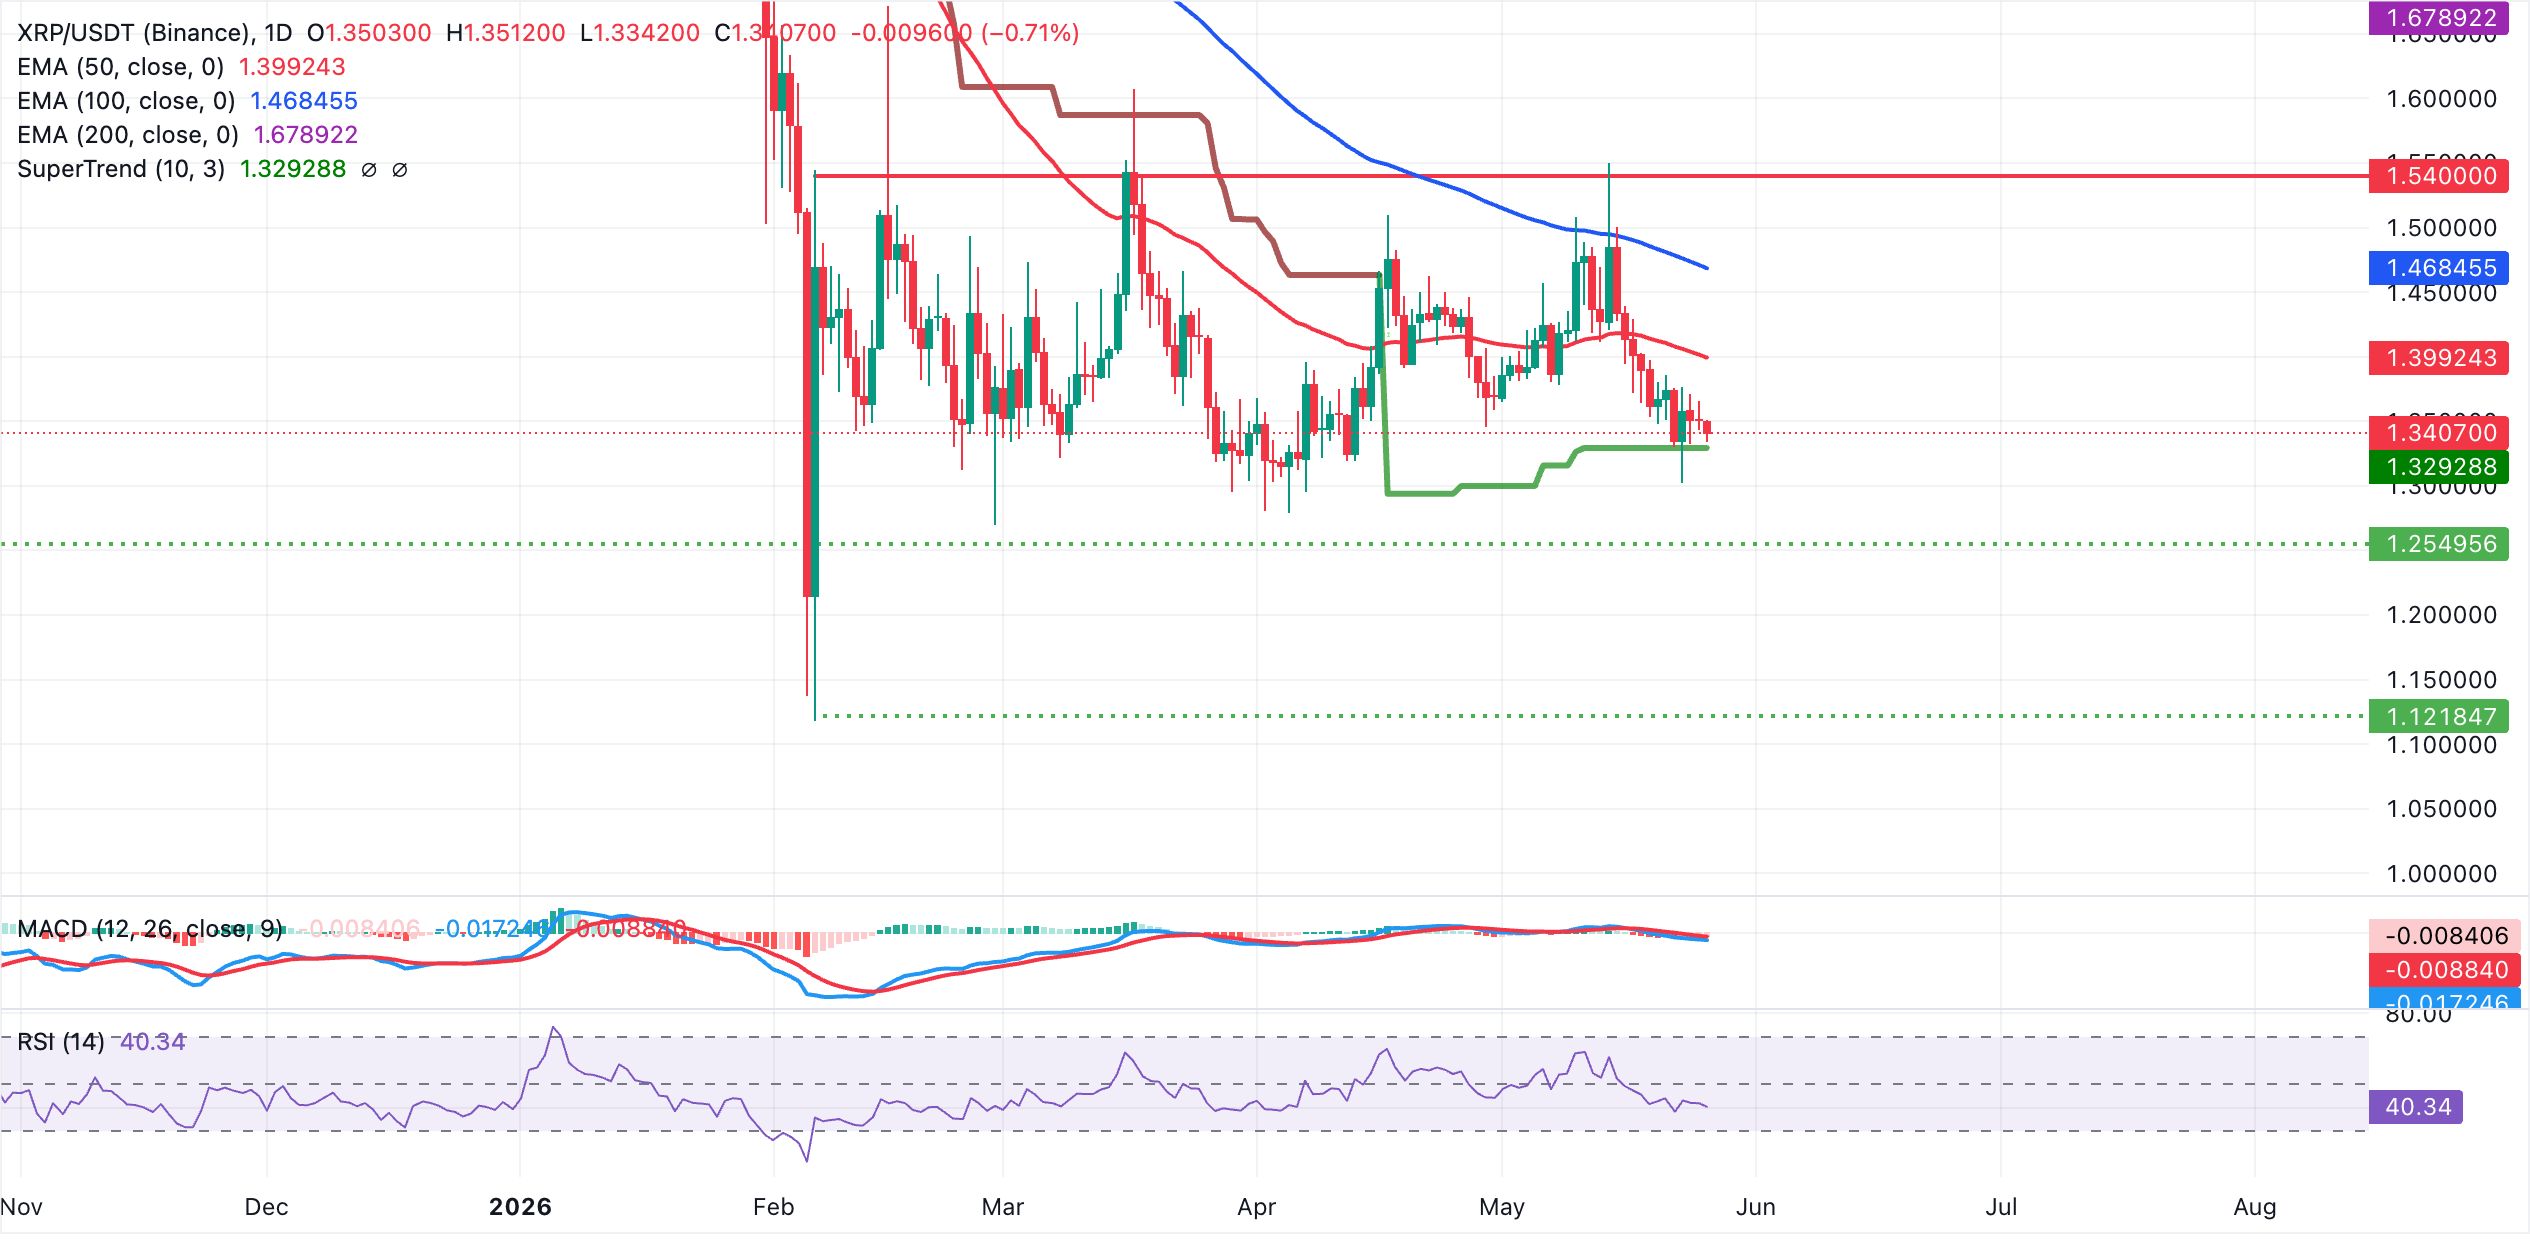
On the upside, initial resistance lies at the 50-day EMA around $1.40, ahead of a more meaningful barrier at the 100-day EMA near $1.47, while the 200-day EMA at $1.68 marks a broader bearish cap if recovered. On the downside, immediate support is provided by the SuperTrend line at $1.33. A decisive break below this level would open the door to a deeper pullback, while holding above it would merely keep XRP consolidating beneath the stacked EMAs.
(The technical analysis of this story was written with the help of an AI tool.)
Bitcoin, altcoins, stablecoins FAQs
Bitcoin is the largest cryptocurrency by market capitalization, a virtual currency designed to serve as money. This form of payment cannot be controlled by any one person, group, or entity, which eliminates the need for third-party participation during financial transactions.
Altcoins are any cryptocurrency apart from Bitcoin, but some also regard Ethereum as a non-altcoin because it is from these two cryptocurrencies that forking happens. If this is true, then Litecoin is the first altcoin, forked from the Bitcoin protocol and, therefore, an “improved” version of it.
Stablecoins are cryptocurrencies designed to have a stable price, with their value backed by a reserve of the asset it represents. To achieve this, the value of any one stablecoin is pegged to a commodity or financial instrument, such as the US Dollar (USD), with its supply regulated by an algorithm or demand. The main goal of stablecoins is to provide an on/off-ramp for investors willing to trade and invest in cryptocurrencies. Stablecoins also allow investors to store value since cryptocurrencies, in general, are subject to volatility.
Bitcoin dominance is the ratio of Bitcoin's market capitalization to the total market capitalization of all cryptocurrencies combined. It provides a clear picture of Bitcoin’s interest among investors. A high BTC dominance typically happens before and during a bull run, in which investors resort to investing in relatively stable and high market capitalization cryptocurrency like Bitcoin. A drop in BTC dominance usually means that investors are moving their capital and/or profits to altcoins in a quest for higher returns, which usually triggers an explosion of altcoin rallies.














