
Crypto Today: Bitcoin, Ethereum, XRP slide as downward pressure intensifies
Di Vishal Dixit
Aggiornato: 1 Jun 2026


ARTICOLI POPOLARI

Cryptocurrency prices edge lower on Monday, with Bitcoin (BTC) falling below $73,000, Ethereum (ETH) under $2,000, and Ripple (XRP) holding at $1.30 after a 2% intraday decline at press time.
- Bitcoin slips below $73,000 on Monday, risking a breakdown toward $70,000 amid deteriorating sentiment in the crypto market.
- Ethereum trades below $2,000 as bearish momentum intensifies amid persistent ETF outflows.
- Ripple is down 2% on Monday, testing $1.30 support as prevailing downward pressure outweighs institutional inflows.
Cryptocurrency prices edge lower on Monday, with Bitcoin (BTC) falling below $73,000, Ethereum (ETH) under $2,000, and Ripple (XRP) holding at $1.30 after a 2% intraday decline at press time. Intense outflows from BTC and ETH-focused Exchange Traded Funds (ETFs), while inflows in XRP ETFs signal a shift in institutional interest.
Market sentiment weakens amid institutional restructuring
The broader crypto market sentiment shows signs of risk aversion amid consistent ETF outflows. CoinMarketCap data shows the Fear and Greed Index at 34 on Monday, down from 52 on May 11, suggesting waning risk appetite among investors.
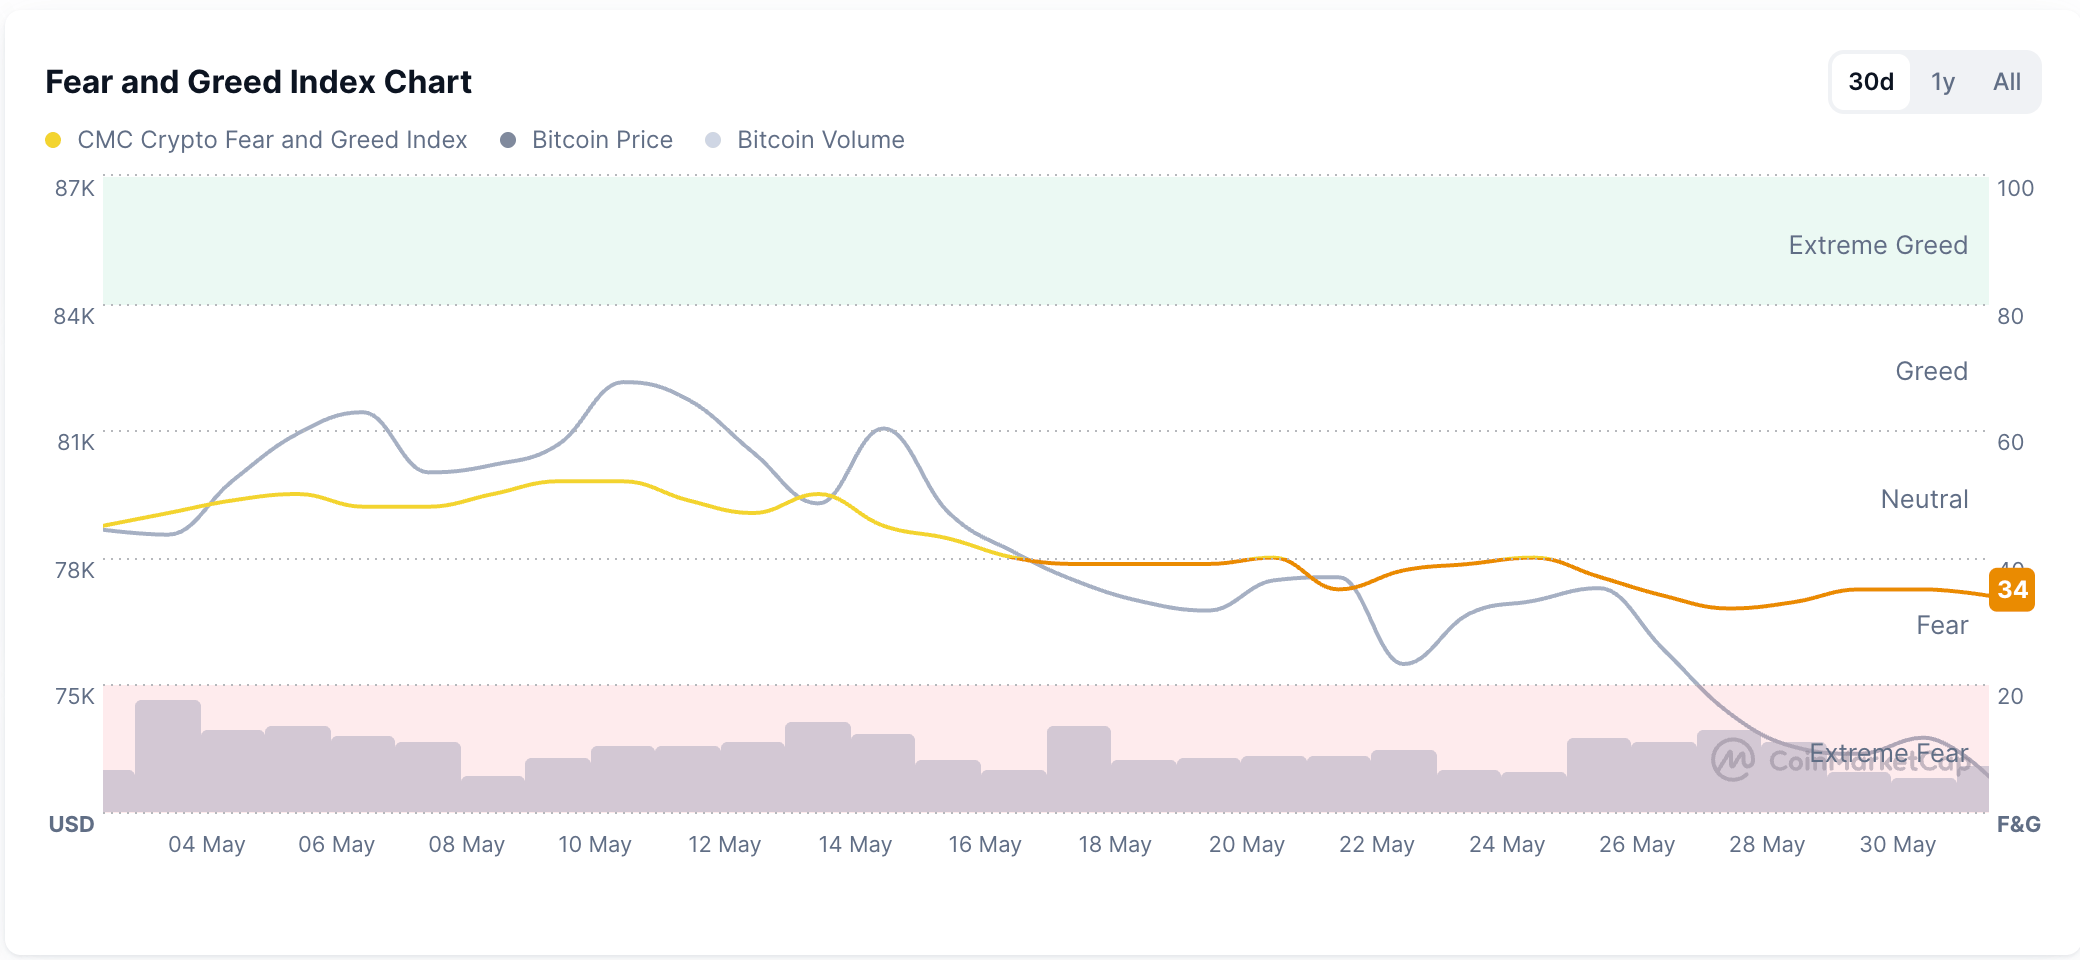
The weakening market sentiment indicates that bears are regaining control. Three consecutive weekly outflows in Bitcoin and Ethereum ETFs support the bearish dominance.
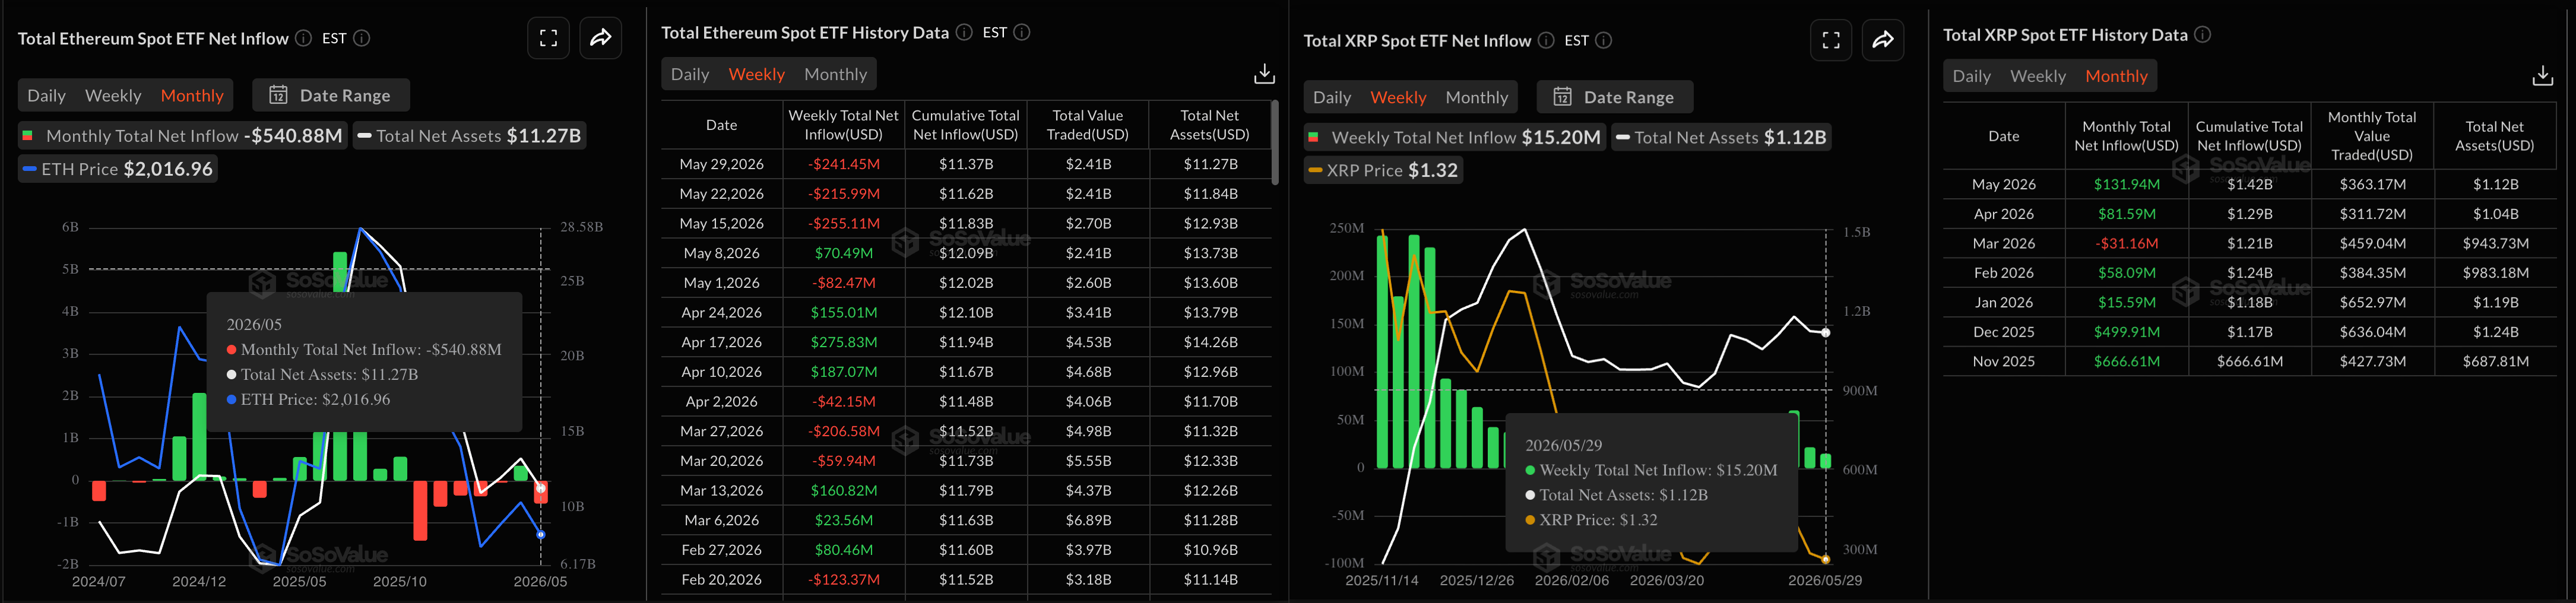
Bitcoin ETFs recorded $2.43 billion in outflows last week, driven by three straight weekly outflows exceeding $1 billion, as previously reported by FXStreet. Meanwhile, Ethereum’s third successive weekly outflow recorded $241 million last week.
On the other hand, XRP ETFs recorded $15.20 million in inflows last week, bringing total inflows to $131.94 million in May. Taken together, the data suggest reduced interest in top crypto and a shift toward altcoins.
Price analysis: Bitcoin pressured as technical structure weakens
Bitcoin is in a corrective phase, risking a break below Thursday's low of $72,582, which would confirm a breakout from the short-term consolidation on the 4-hour chart. BTC price remains decisively under the 50-period Exponential Moving Average (EMA) near $74,636, with the 100-period EMA around $75,805 and the 200-period EMA close to $76,242 stacked above it, collectively suggesting a market capped by medium- to long-term trend resistance.
Momentum is mixed: the Relative Strength Index (RSI) at 31 on the 4-hour timeframe hovers closer to the oversold zone, while the Moving Average Convergence Divergence (MACD) has crossed below its signal line, hinting that upside pressure has reversed.
A decisive close below $72,582 could test the S1 and S2 Pivot Points at $71,431 and $69,188, respectively.
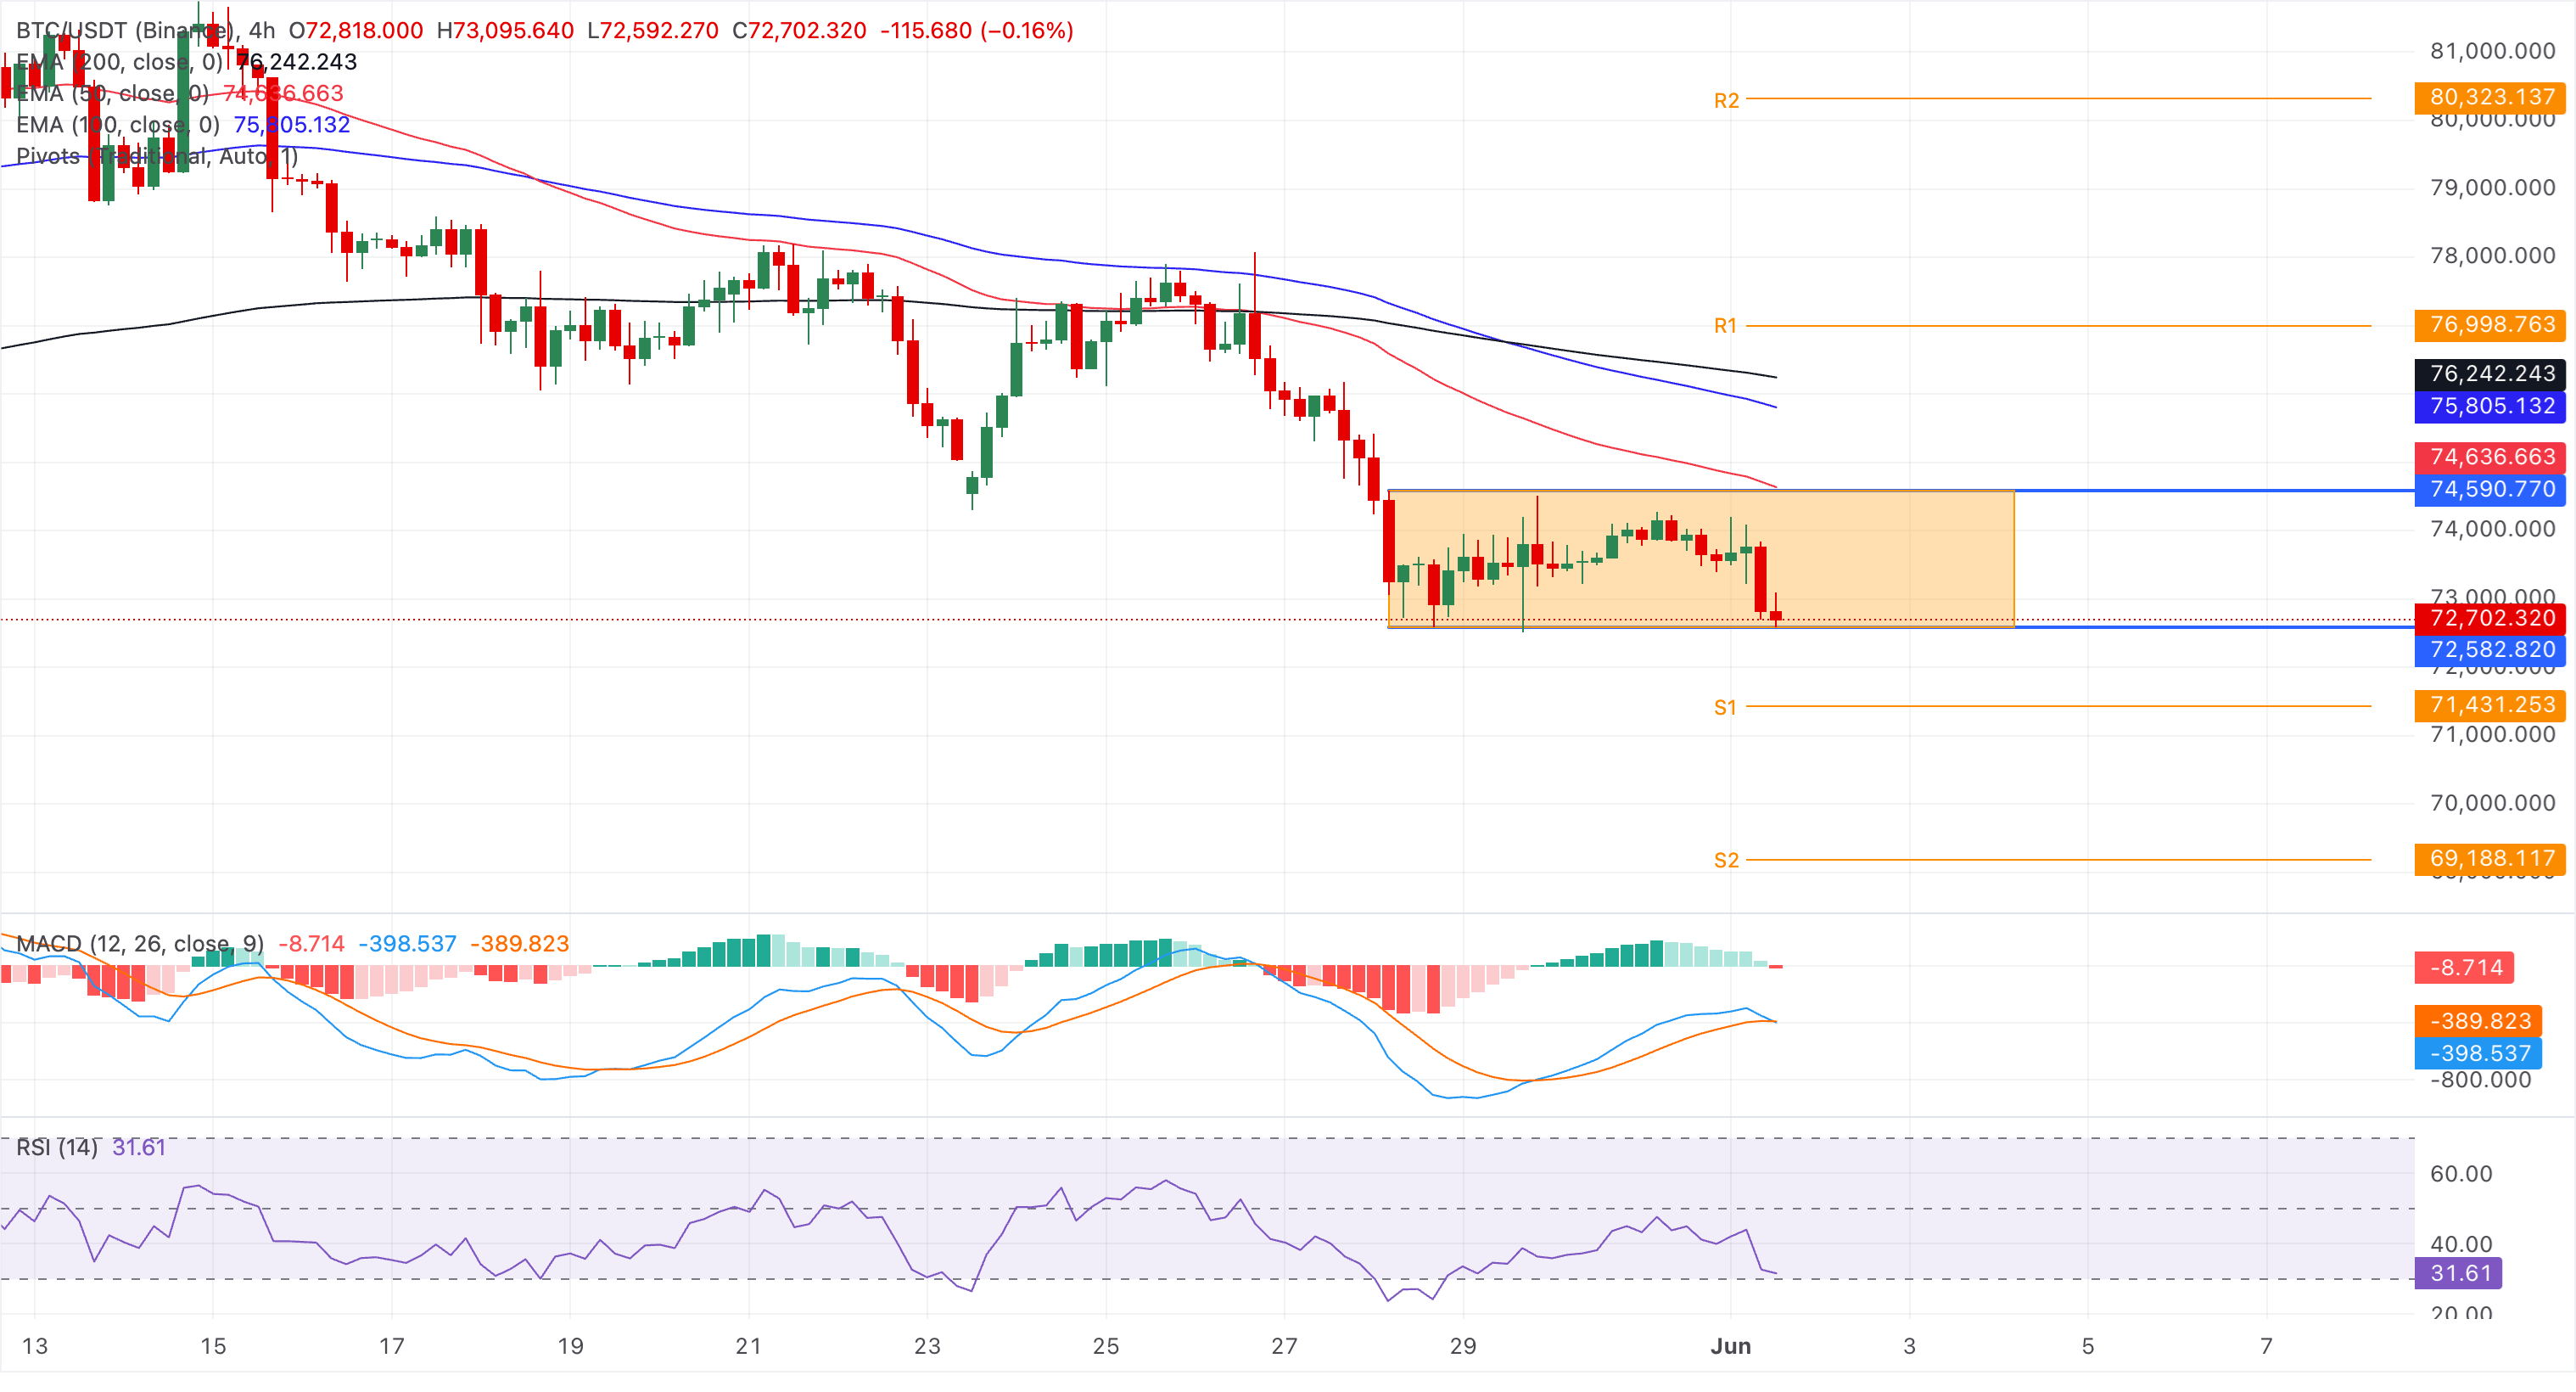
Looking up, the initial resistance is seen at the 50-period EMA around $74,636, and a sustained break above this barrier would be needed to open the way toward the 100-period EMA near $75,805.
Altcoins technical outlook: Ethereum and Ripple walk toward the cliff's edge
Ethereum hovers below $2,000 on Monday, keeping a bearish bias, but takes support at Thursday's low of $1,967 on the 4-hour chart. ETH price holds beneath the 50-period EMA at $2,043 and the 100- and 200-period EMAs at $2,093 and $2,148, respectively.
The major altcoin also trades below a descending resistance trendline that currently comes in near $2,049, reinforcing a capped tone. Momentum is heavy, with the RSI at 38 still below the midline on the 4-hour chart, while the Moving Average Convergence Divergence (MACD) crosses below its signal line into negative territory, hinting at subdued bullish conviction.
Immediate support for ETH below $1,967 lies at the S1 and S2 Pivot Point levels at $1,935 and $1,863, respectively.
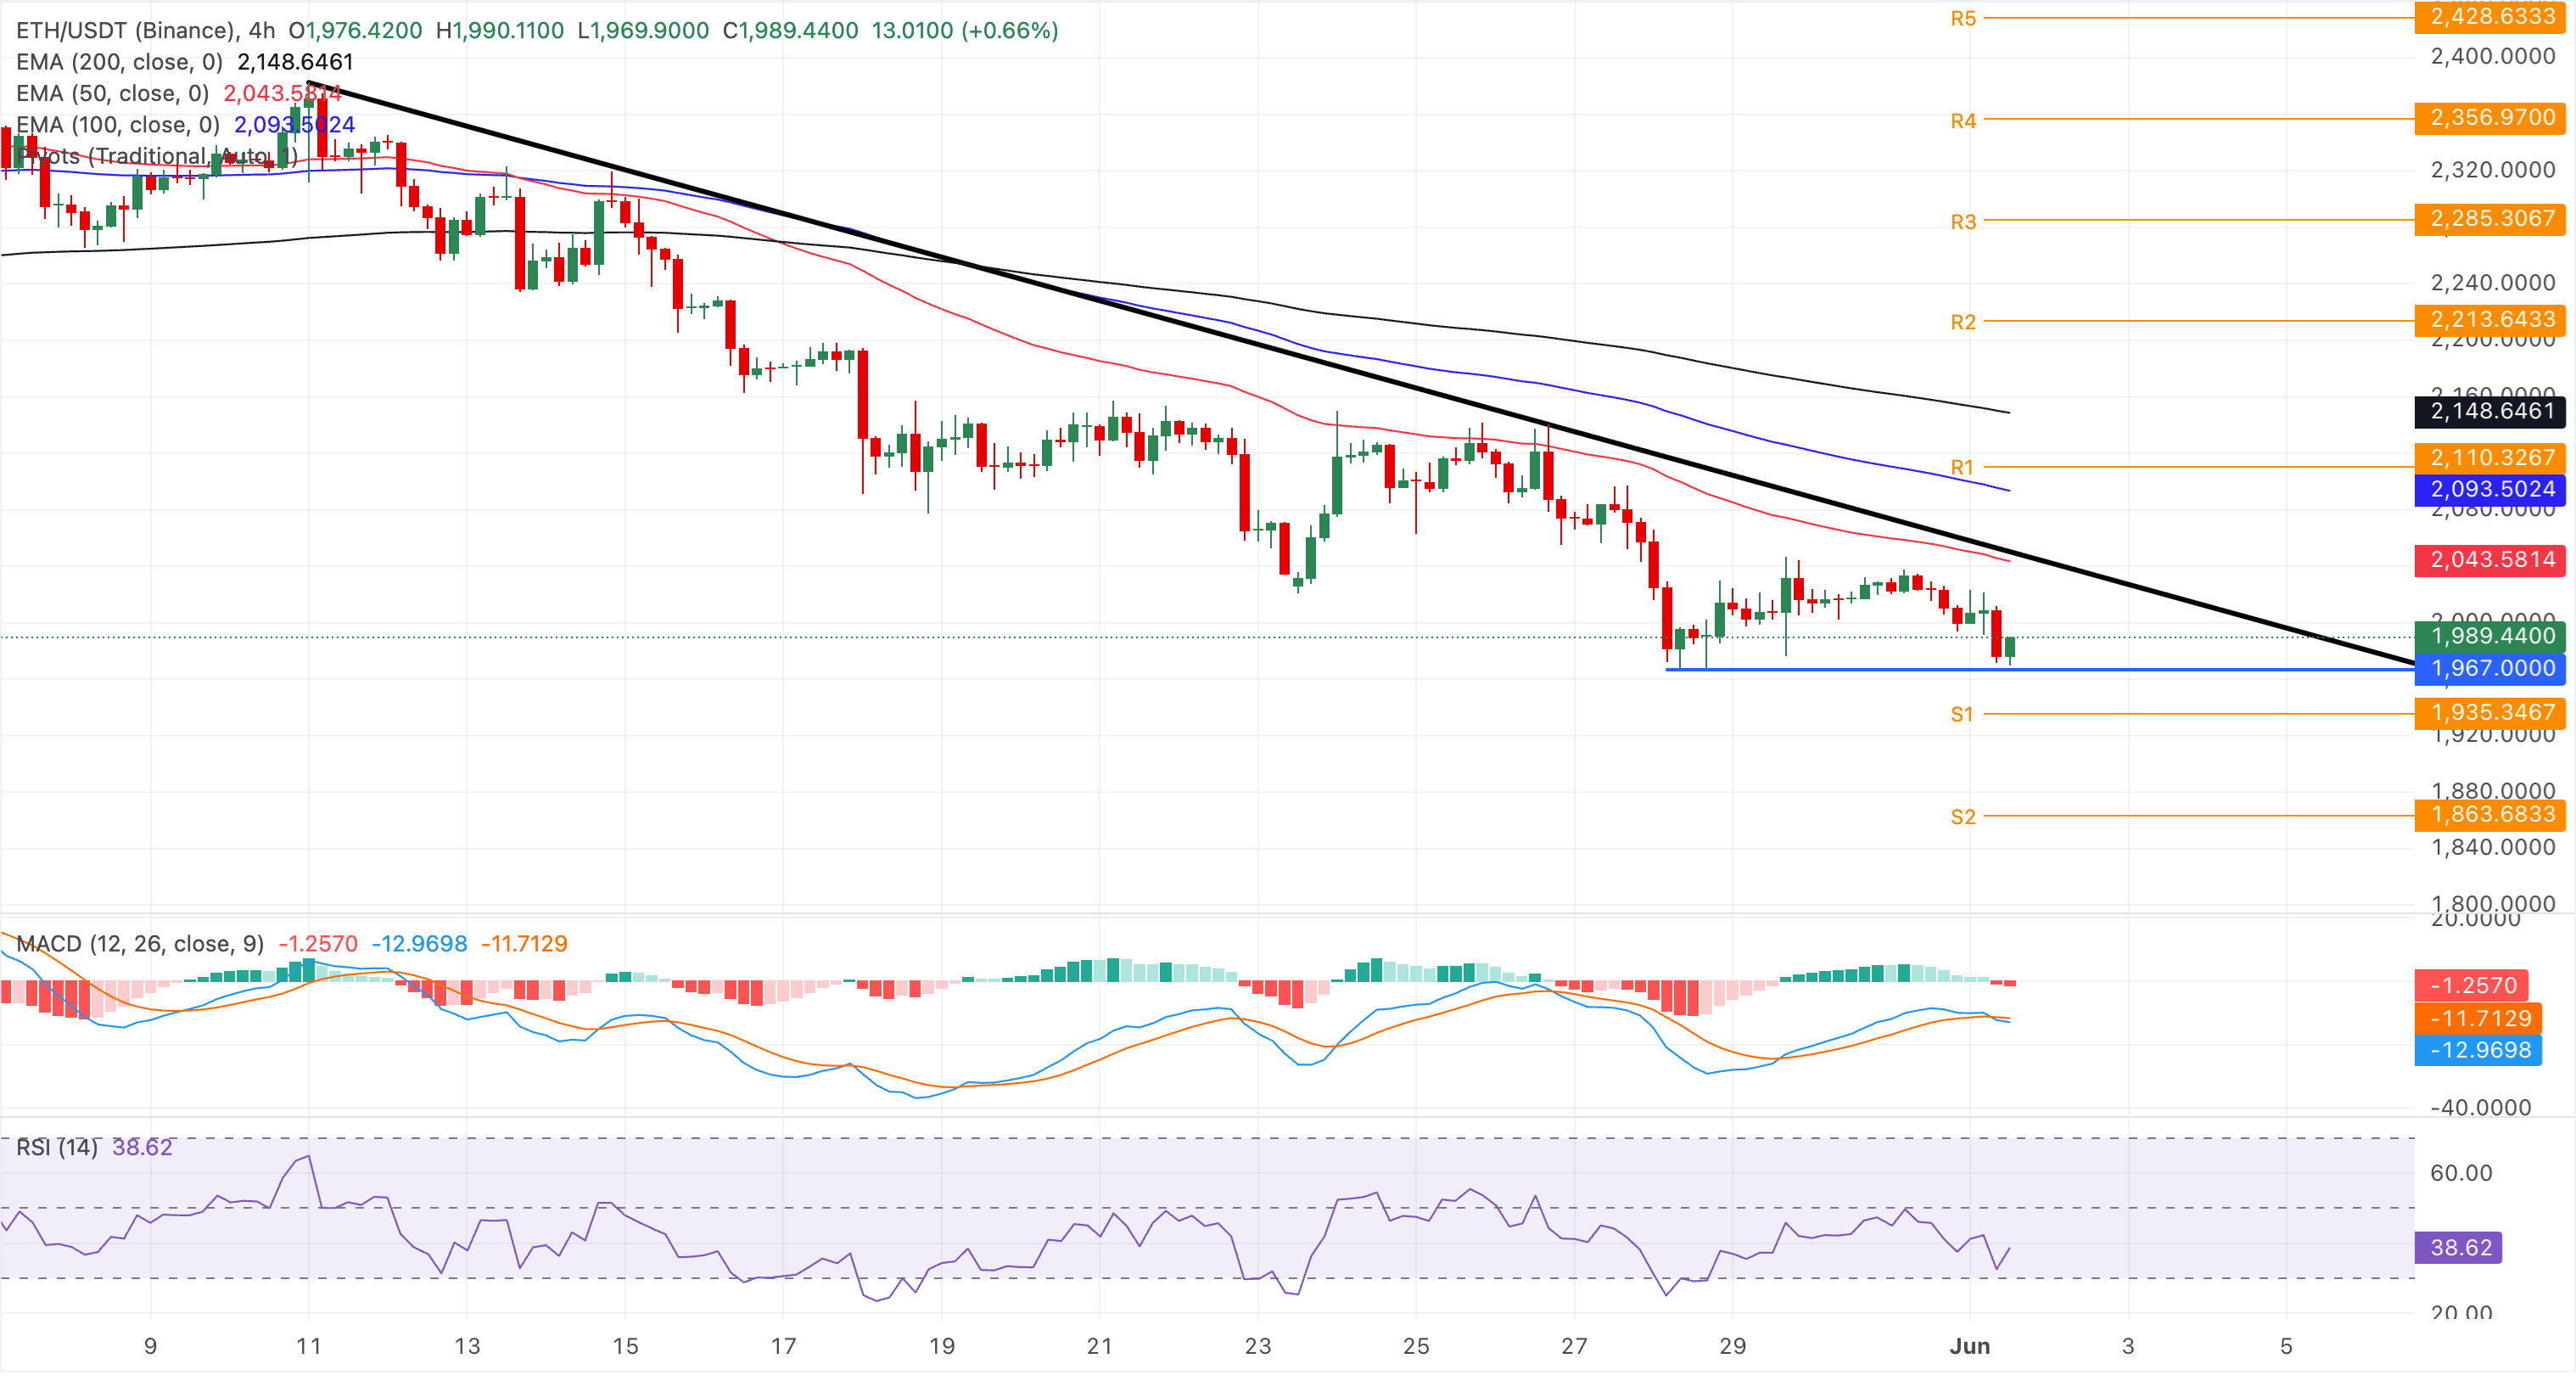
On the topside, initial resistance is located at the 50-period EMA at $2,043, near the descending trendline barrier around $2,049.
Ripple trades around $1.3000 at the time of writing on Monday, extending a bearish phase as the price holds below the 50-, 100-, and 200-day EMAs at $1.3824, $1.4519, and $1.6517, respectively. This stacked EMA configuration suggests that rallies remain capped for now, while XRP price decline could test the $1.2700 support zone, which has remained intact since February 28.
The RSI at 28 on the daily chart leans toward oversold territory, with a downtick, while the MACD remains below its signal line in negative territory, reinforcing persistent downside pressure.
If buyers fail to hold the XRP price above the $1.2700-$1.2543 supply zone, a downside breakout could threaten the February 6 low at $1.1179, triggering a sustained decline.
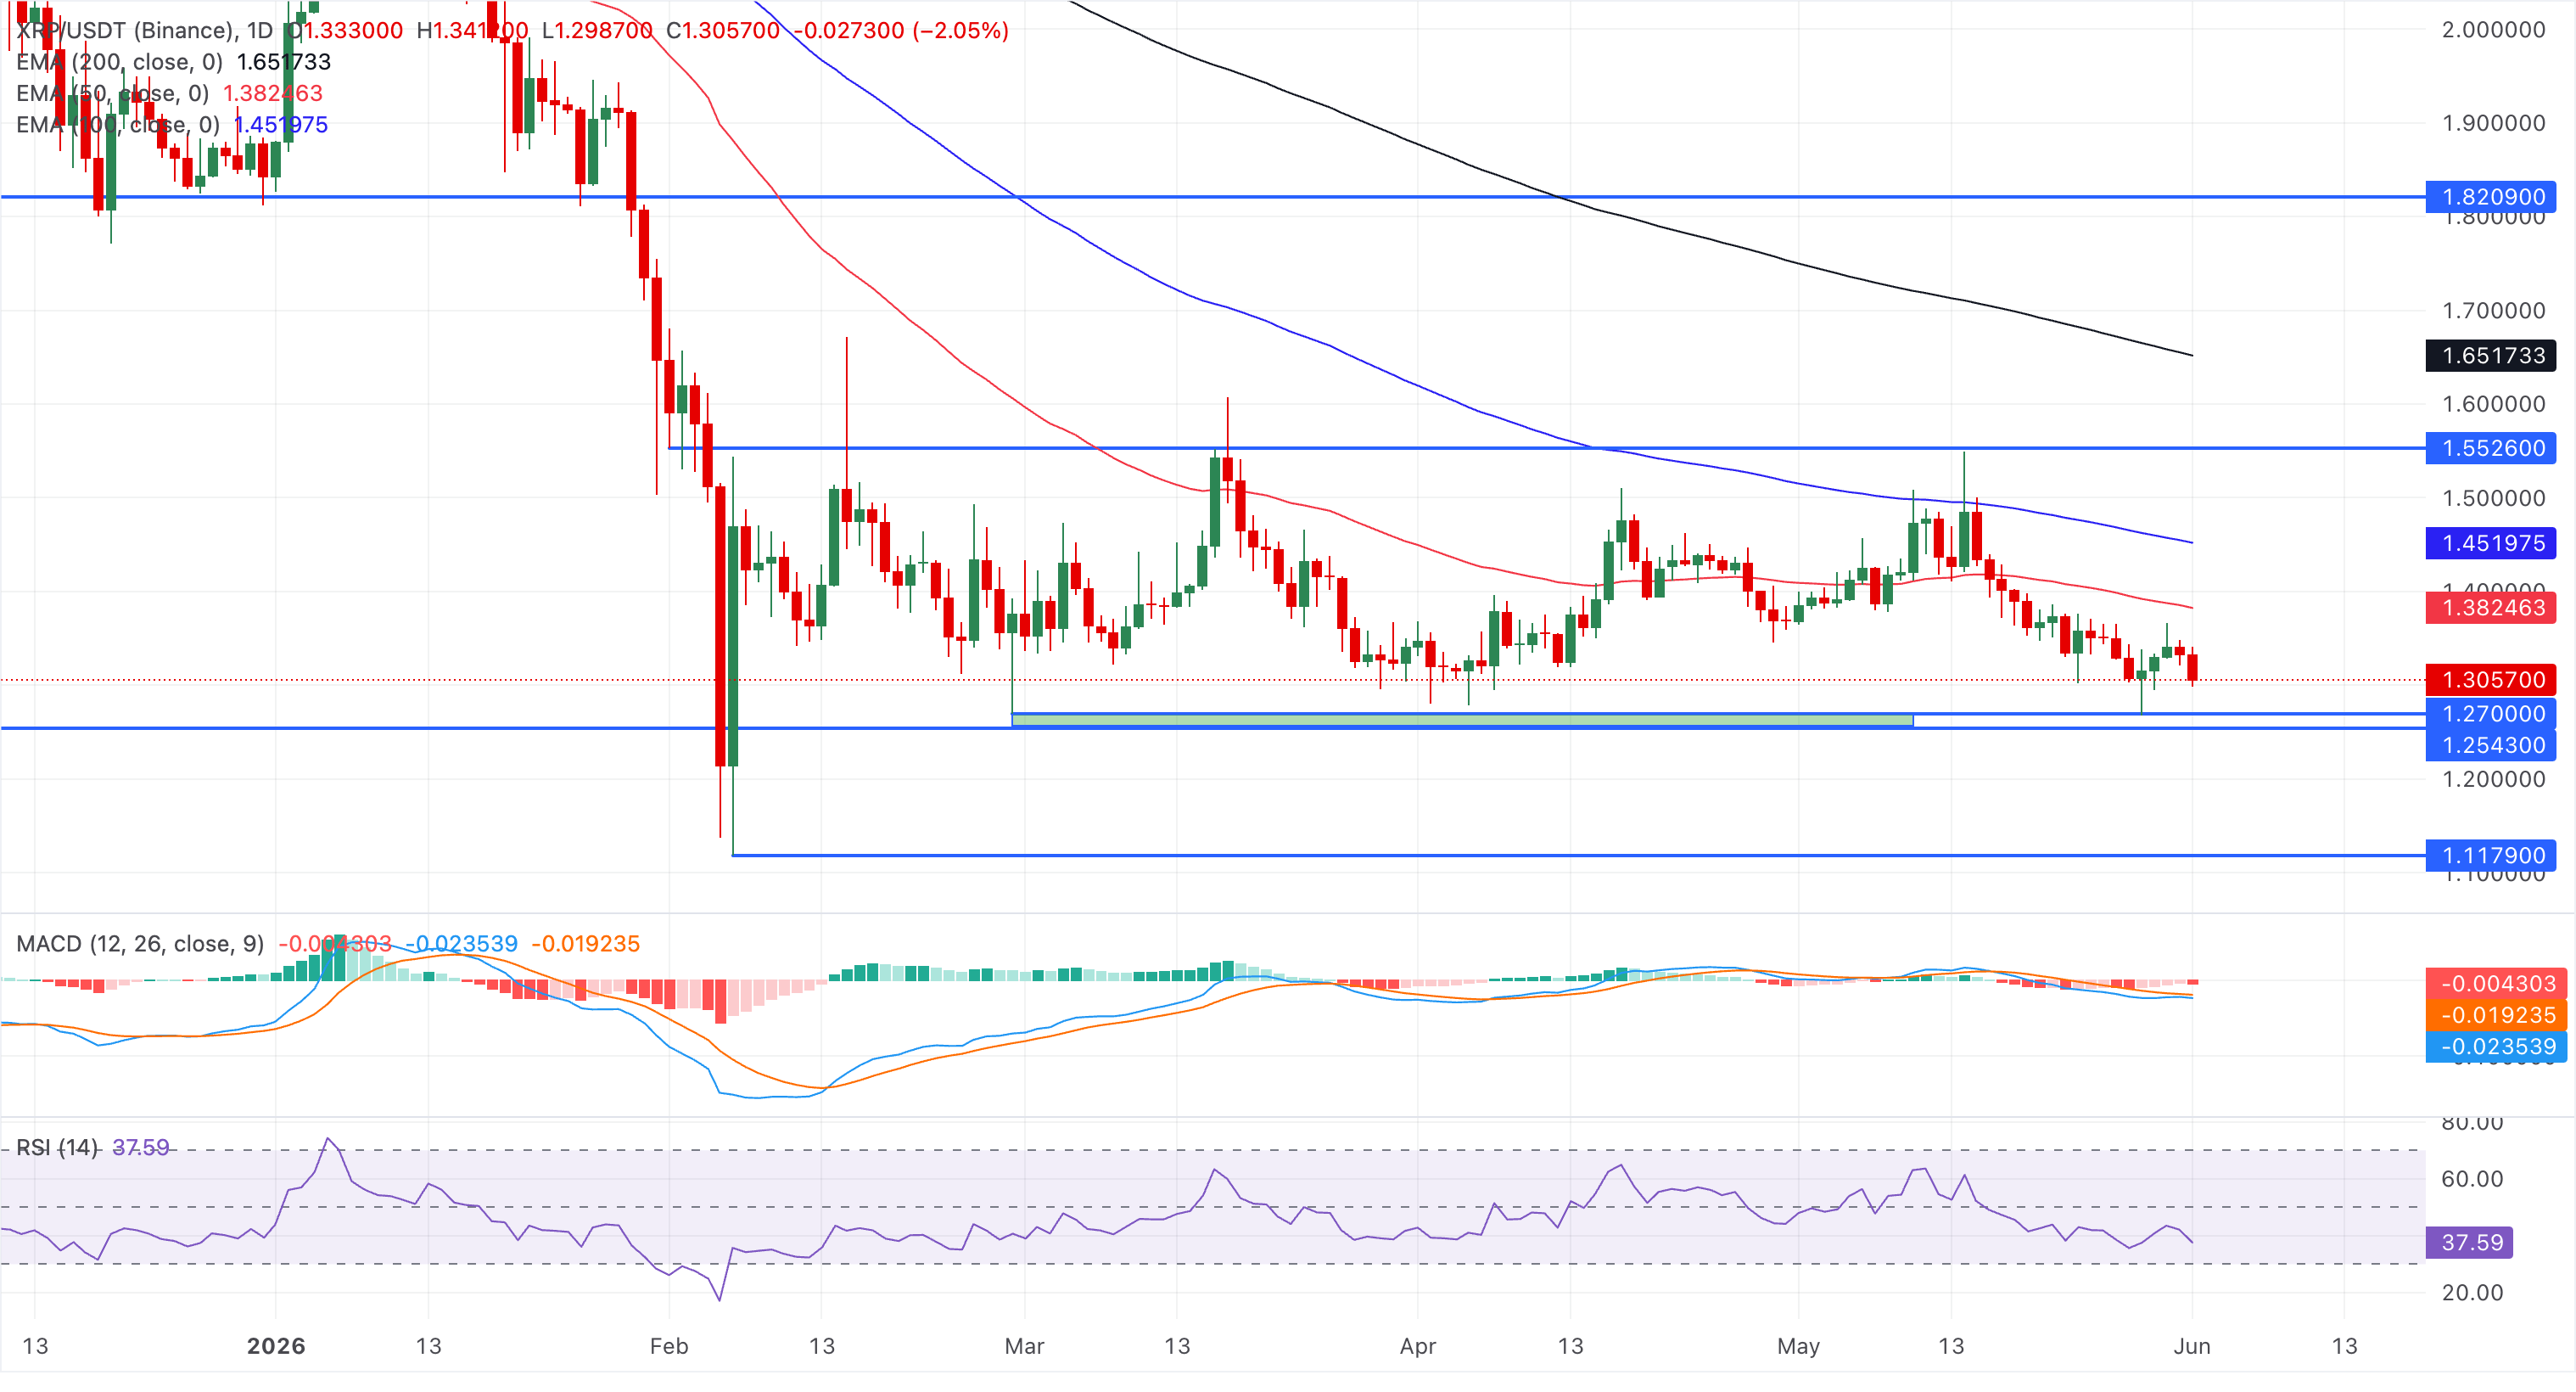
On the topside, unless buyers can reclaim and hold above the 50-day EMA at $1.3824, the pair is likely to trade with a heavy tone, where any bounce would more likely meet supply near these moving-average caps than trigger a sustained trend recovery.
(The technical analysis of this story was written with the help of an AI tool.)

Oltre un milione di utenti si affida a FXStreet per dati di mercato in tempo reale, strumenti di charting, approfondimenti di esperti e notizie Forex. Il loro calendario economico completo e i webinar formativi aiutano i trader a rimanere informati e a prendere decisioni ponderate. FXStreet conta circa 60 professionisti tra la sede di Barcellona e diverse regioni globali.
Leggi di più


