
Crypto Today: Bitcoin, Ethereum, XRP stay under pressure as investors turn more risk-averse
Di John Isige
Aggiornato: 1 Jul 2026


ARTICOLI POPOLARI

The cryptocurrency market trades under intense headwinds on Wednesday, led by Bitcoin’s (BTC) deepening sell-off below $60,000. The Crypto King hovers above $58,000.
- Bitcoin losses deepen around $58,000, after touching levels last seen in September 2024, amid weakening technical structure and capital outflows.
- Ethereum maintains a bearish outlook and remains constrained within the $1,500-$1,600 range as spot ETFs record persistent outflows.
- XRP pressed against the psychological $1.00 support, with its upside capped by downtrending major moving averages.
The cryptocurrency market trades under intense headwinds on Wednesday, led by Bitcoin’s (BTC) deepening sell-off below $60,000. The Crypto King hovers above $58,000.
Altcoins such as Ethereum (ETH) and Ripple (XRP) are tracking Bitcoin’s downward momentum, with ETH confined to the $1,500–$1,600 range and XRP testing critical support at the $1.00 level.
Crypto sentiment remains fragile as capital outflows persist
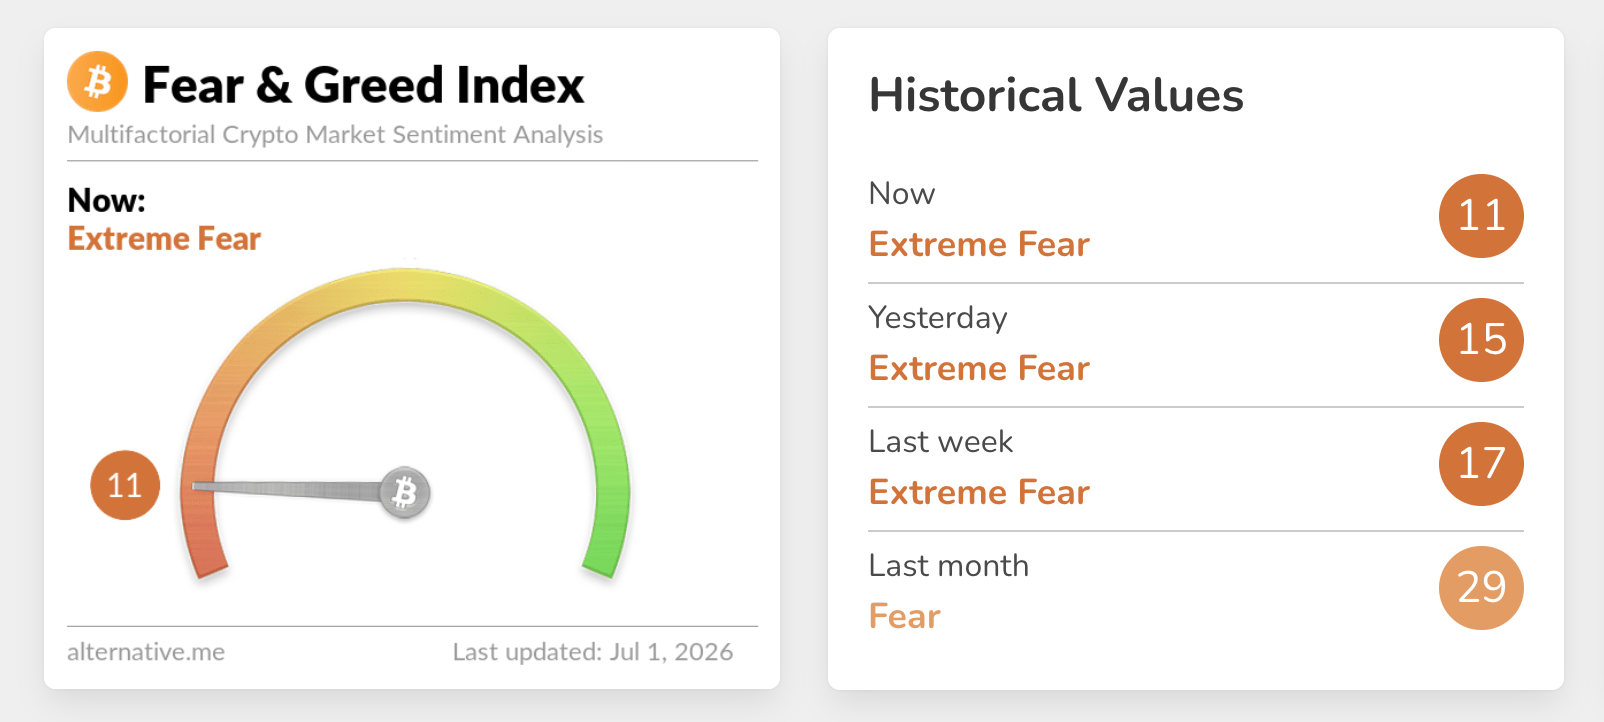
Sentiment in the broader crypto market remains significantly subdued, as reflected in the Fear & Greed Index, which holds in Extreme Fear territory at 11 on Wednesday, down from 15 the previous day. Persistently weak risk appetite dampens demand for risk assets and constrains price movement across the market.
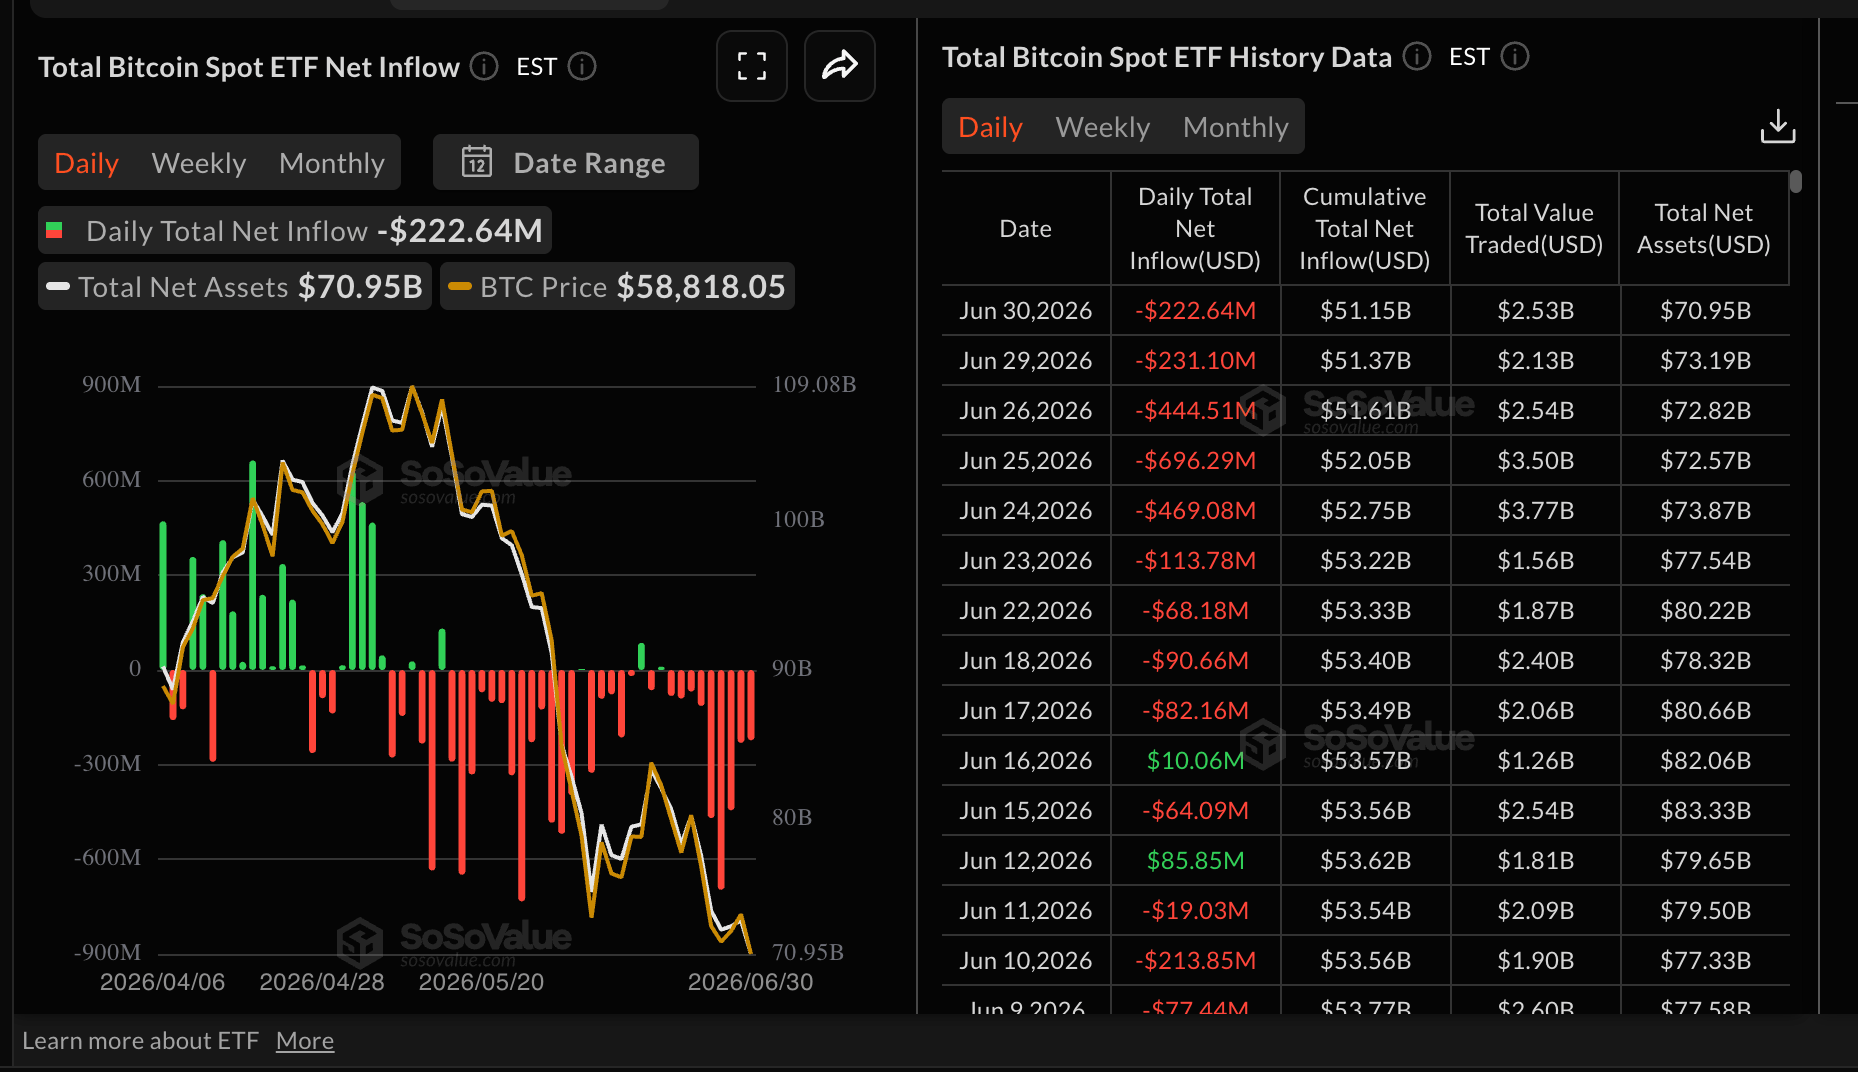
Outflows from US-listed Bitcoin spot Exchange-Traded Funds (ETFs) underscore waning institutional interest, with $223 million withdrawn on Tuesday alone. This marks the ninth consecutive day of net redemptions, reinforcing the ongoing bearish narrative.
Despite the outflows, cumulative inflows remain positive at $51.15 billion, while net assets under management average $70.95 billion.
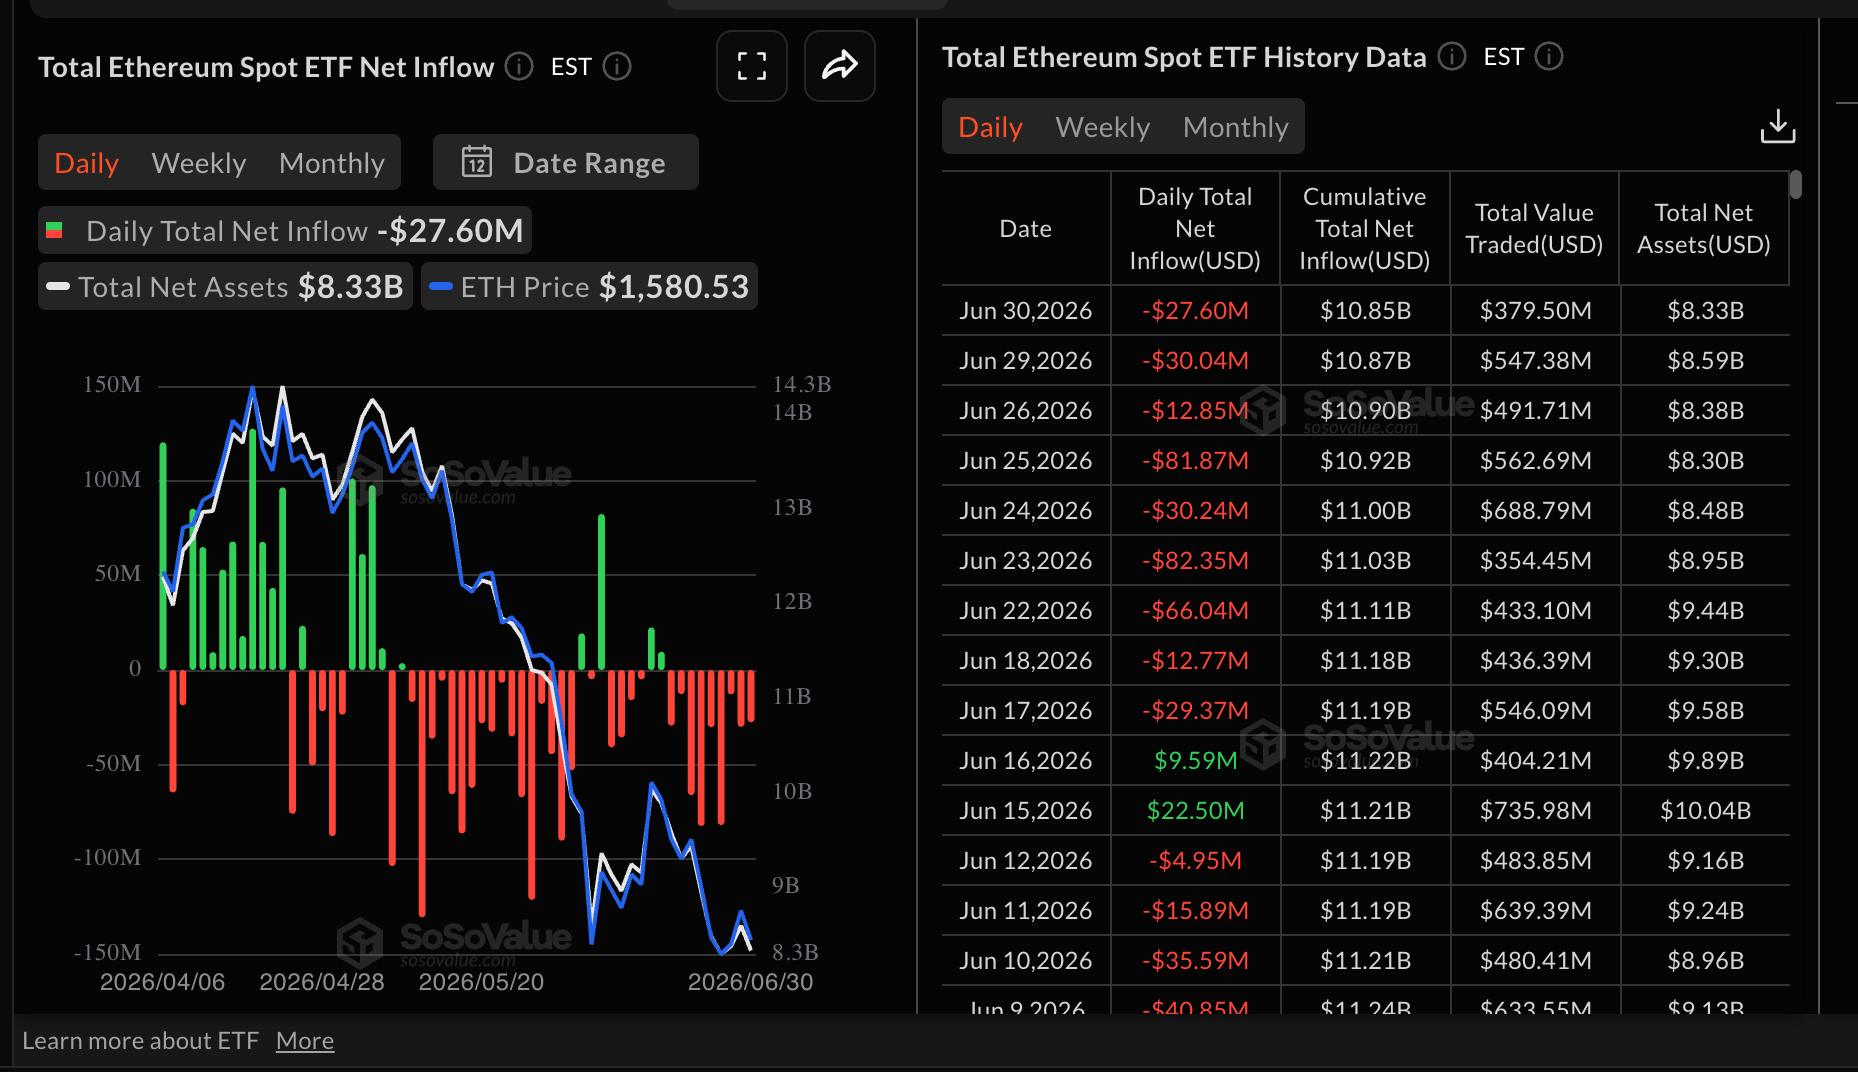
Ethereum spot ETFs present a similar grim picture to BTC, with outflows totaling $28 million on Tuesday, down slightly from $30 million on Monday. According to SoSoValue, ETH ETF outflows have persisted for the ninth consecutive day, reflecting ongoing market caution.
Despite the current market headwinds, cumulative inflows hold steady at $10.85 billion, with total assets under management at $8.33 billion, signaling that conviction among long-term investors remains resilient.
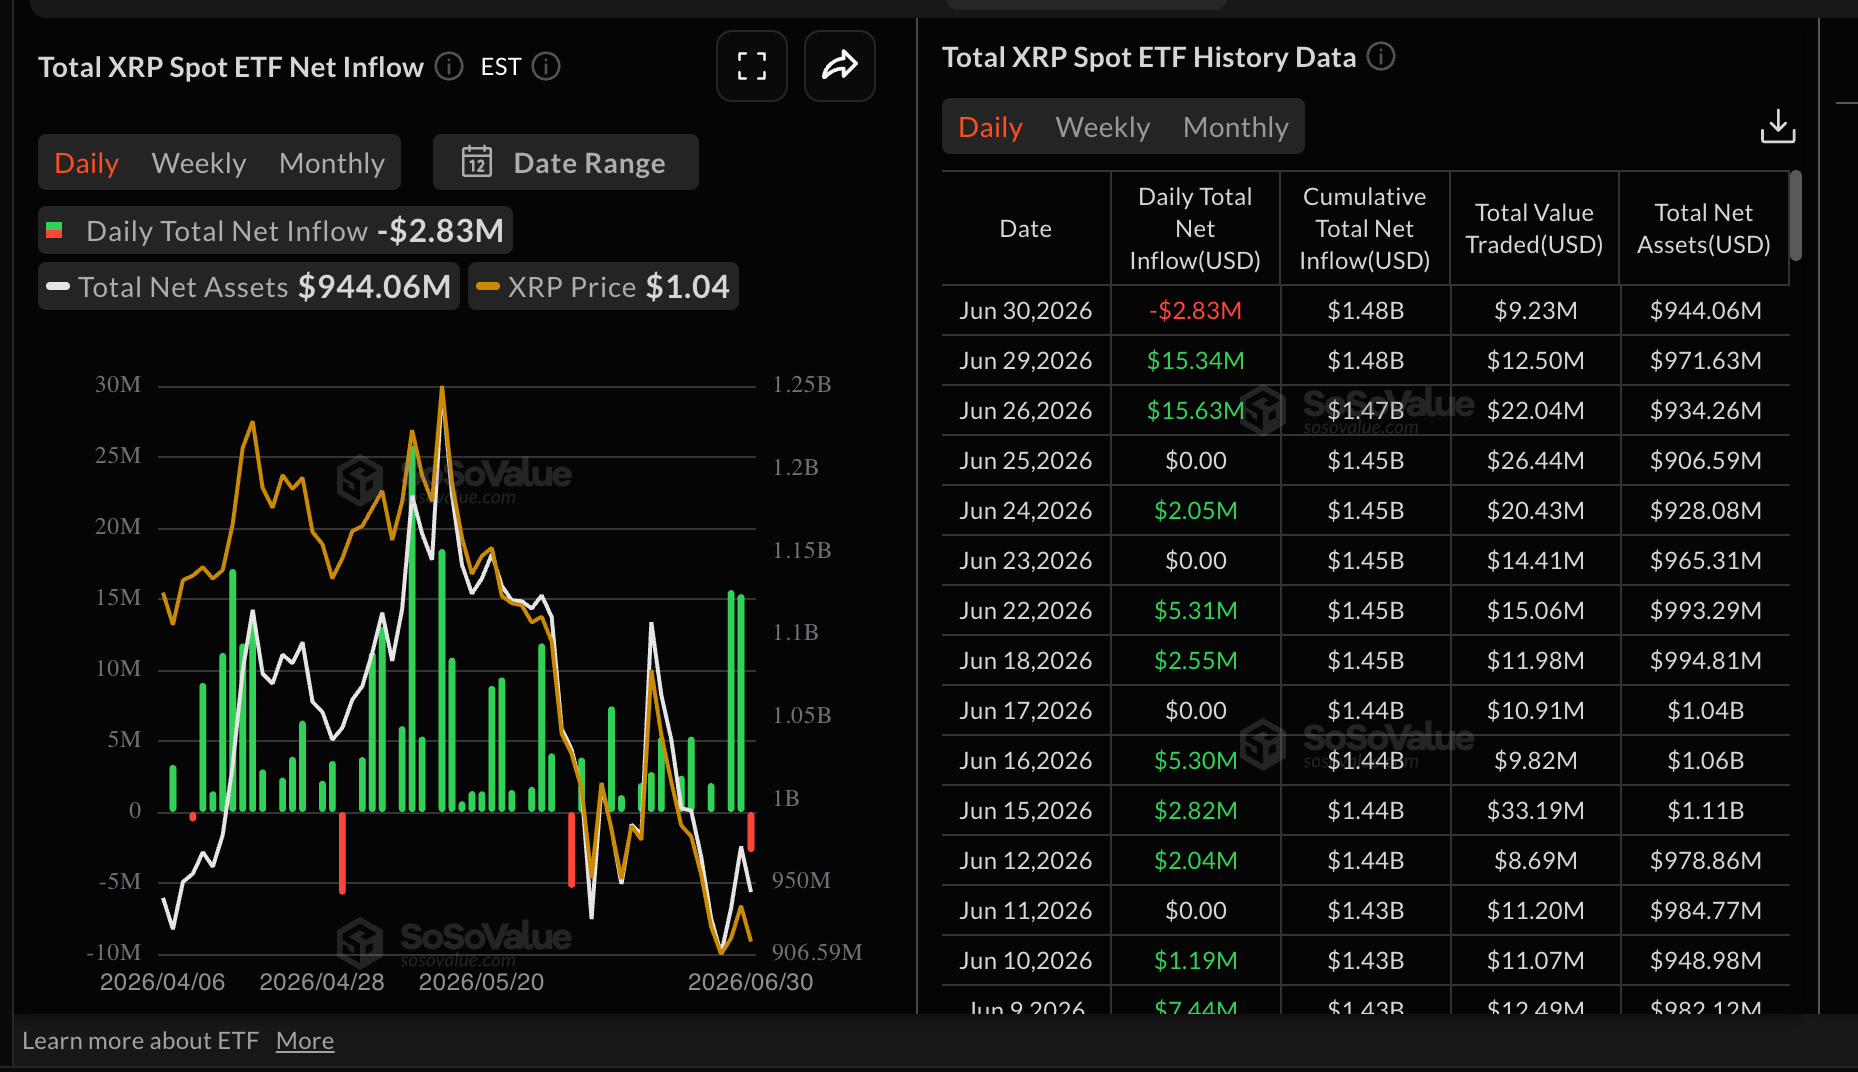
Interest in XRP spot ETFs took a downturn, with nearly $3 million in outflows on Tuesday, after logging two consecutive days of notable inflows totaling $16 million on Friday and $15 million on Monday.
Cumulative inflows hold steady at $1.48 billion while net assets under management average $944 million, according to SoSoValue data. Appetite for XRP investment products has remained relatively steady despite the headwinds experienced in recent weeks.
Price analysis: Bitcoin extends losses amid technical weakness
Bitcoin trades at above $58,000, keeping a clear bearish bias as price sits well below the 50-day, 100-day and 200-day Exponential Moving Averages (EMAs).
The Moving Average Convergence Divergence (MACD) histogram remains slightly negative while both lines hover below the zero line on the daily chart, and the Relative Strength Index (RSI) holds near 30, which together suggests persistent but somewhat fatigued downside momentum rather than an imminent bullish reversal.
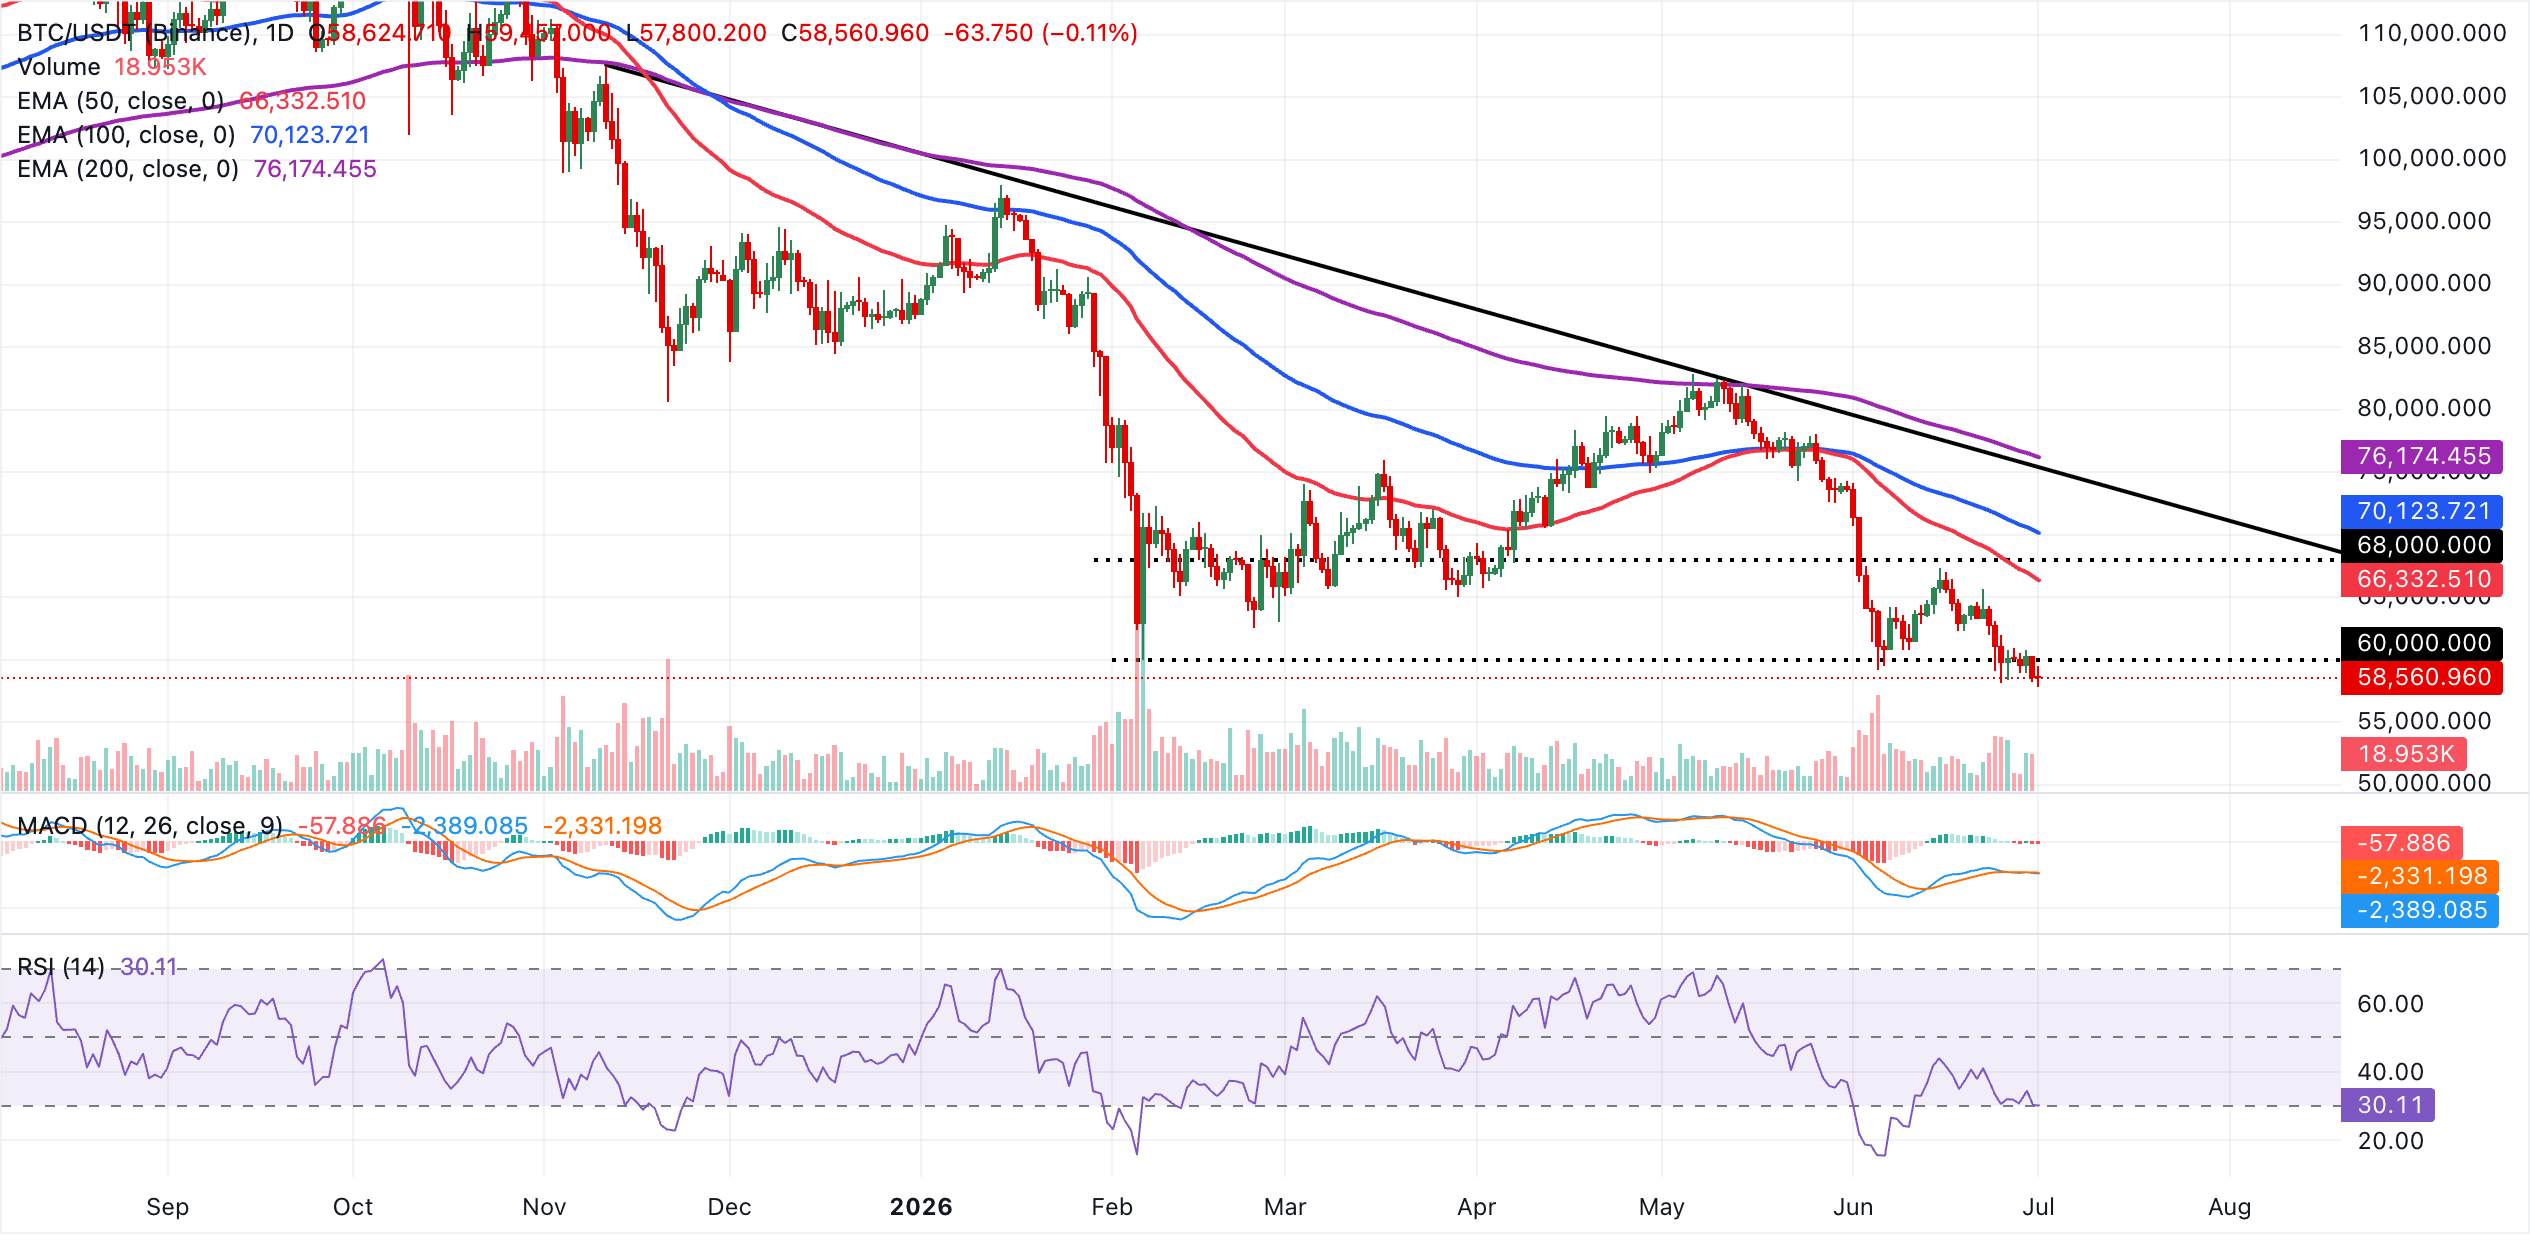
On the topside, initial resistance emerges at the 50-day EMA near $66,333, with further barriers at the 100-day EMA around $70,124 and the broken descending trendline region close to $75,348, before the broader bearish cap from the 200-day EMA at about $76,174. This is the first time Bitcoin has traded around the $58,000 psychological support since September 2024, underscoring the broader bearish outlook. Other key areas of interest for traders include $56,000 and $52,000, where investors may reengage to increase exposure.
Altcoins technical outlook: Ethereum and XRP
Ethereum trades at $1,575 maintaining a bearish near‑term bias as the spot price holds well below the key moving averages. The 50‑day EMA at roughly $1,814 sits as the nearest dynamic cap, with the 100‑day EMA around $1,994 and the 200‑day EMA near $2,286 reinforcing a broader downtrend structure.
The MACD histogram has inched into positive territory on the daily chart, hinting at a modest attempt to stabilize, but the RSI hovering in the mid‑30s suggests that rebounds are still occurring within a weak, corrective context rather than a sustained trend reversal.
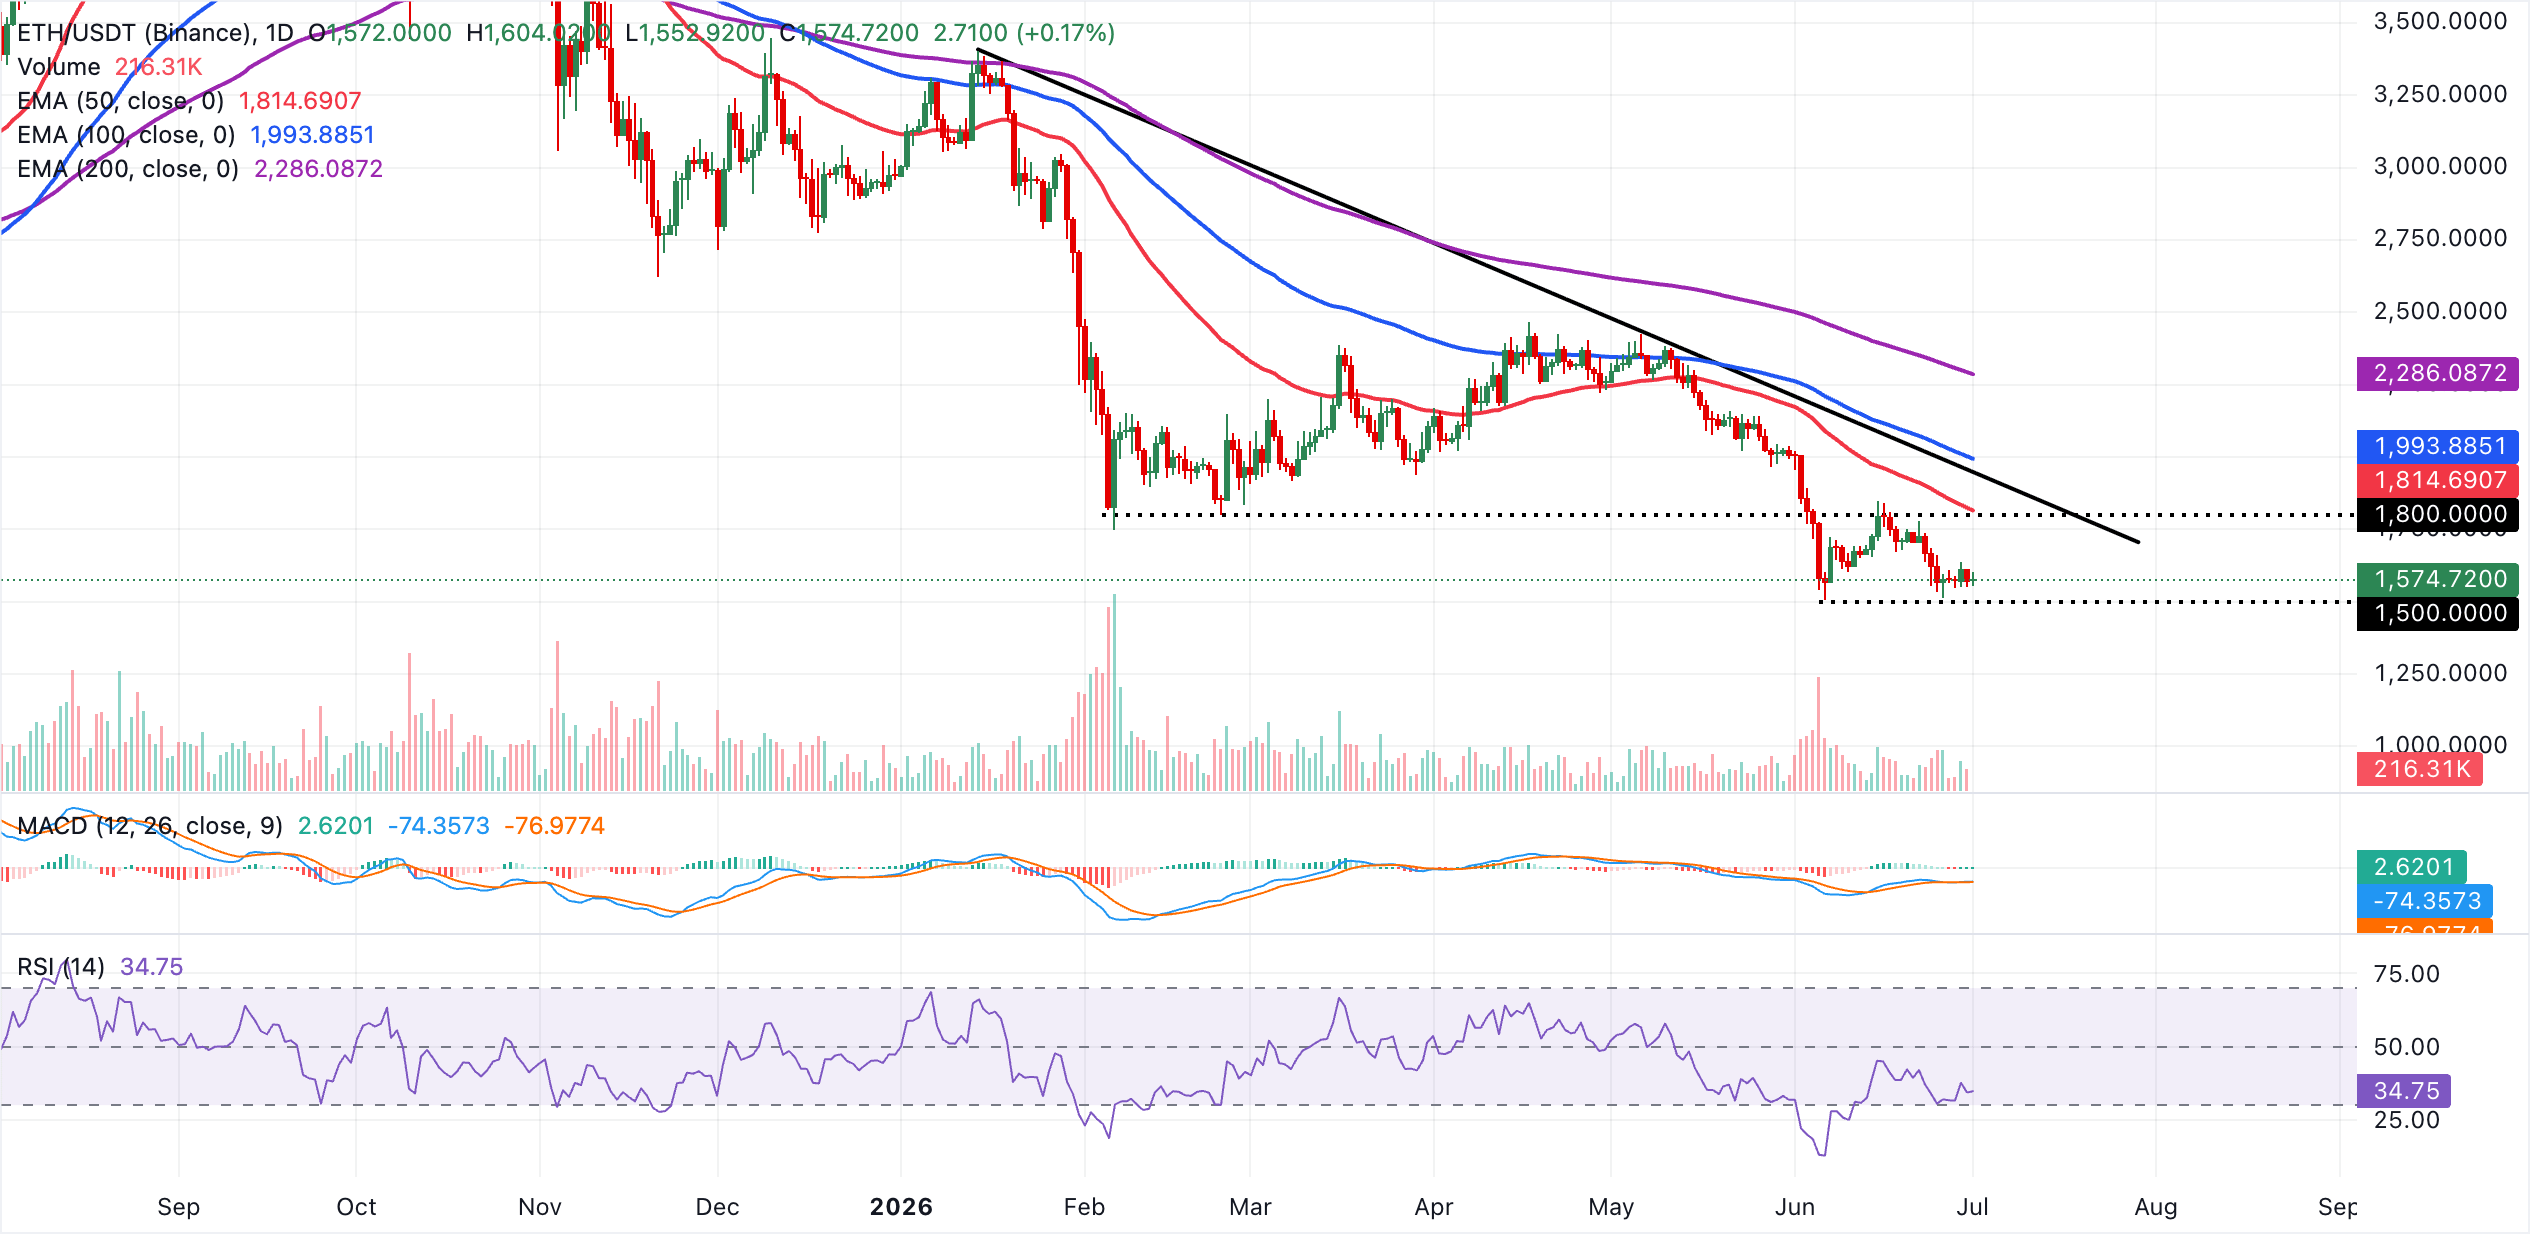
On the topside, immediate resistance lies at the 50‑day EMA around $1,815. A daily close above this zone would be required to ease the current downside pressure and open the way toward the descending trendline resistance near $1,946. Beyond these barriers, the 100‑day EMA at about $1,994 and the 200‑day EMA close to $2,286 form successive hurdles that would need to be reclaimed to shift the medium‑term outlook back toward a constructive bias. Looking down, trading below the narrow range support at $1,500 could reinforce an extended bearish trend.
XRP trades at $1.04, keeping a bearish near-term tone as it sits well below the 50-day, 100-day and 200-day EMAs clustered from roughly $1.19 to $1.52. The long-standing descending resistance trendline, with a break price around $1.23, continues to cap the broader structure, while the RSI hovering near 33 on the daily chart hints at lingering weak momentum rather than a decisive oversold rebound.
The MACD histogram holds just below zero with a marginally negative reading, suggesting downside pressure is fading but not yet reversed.
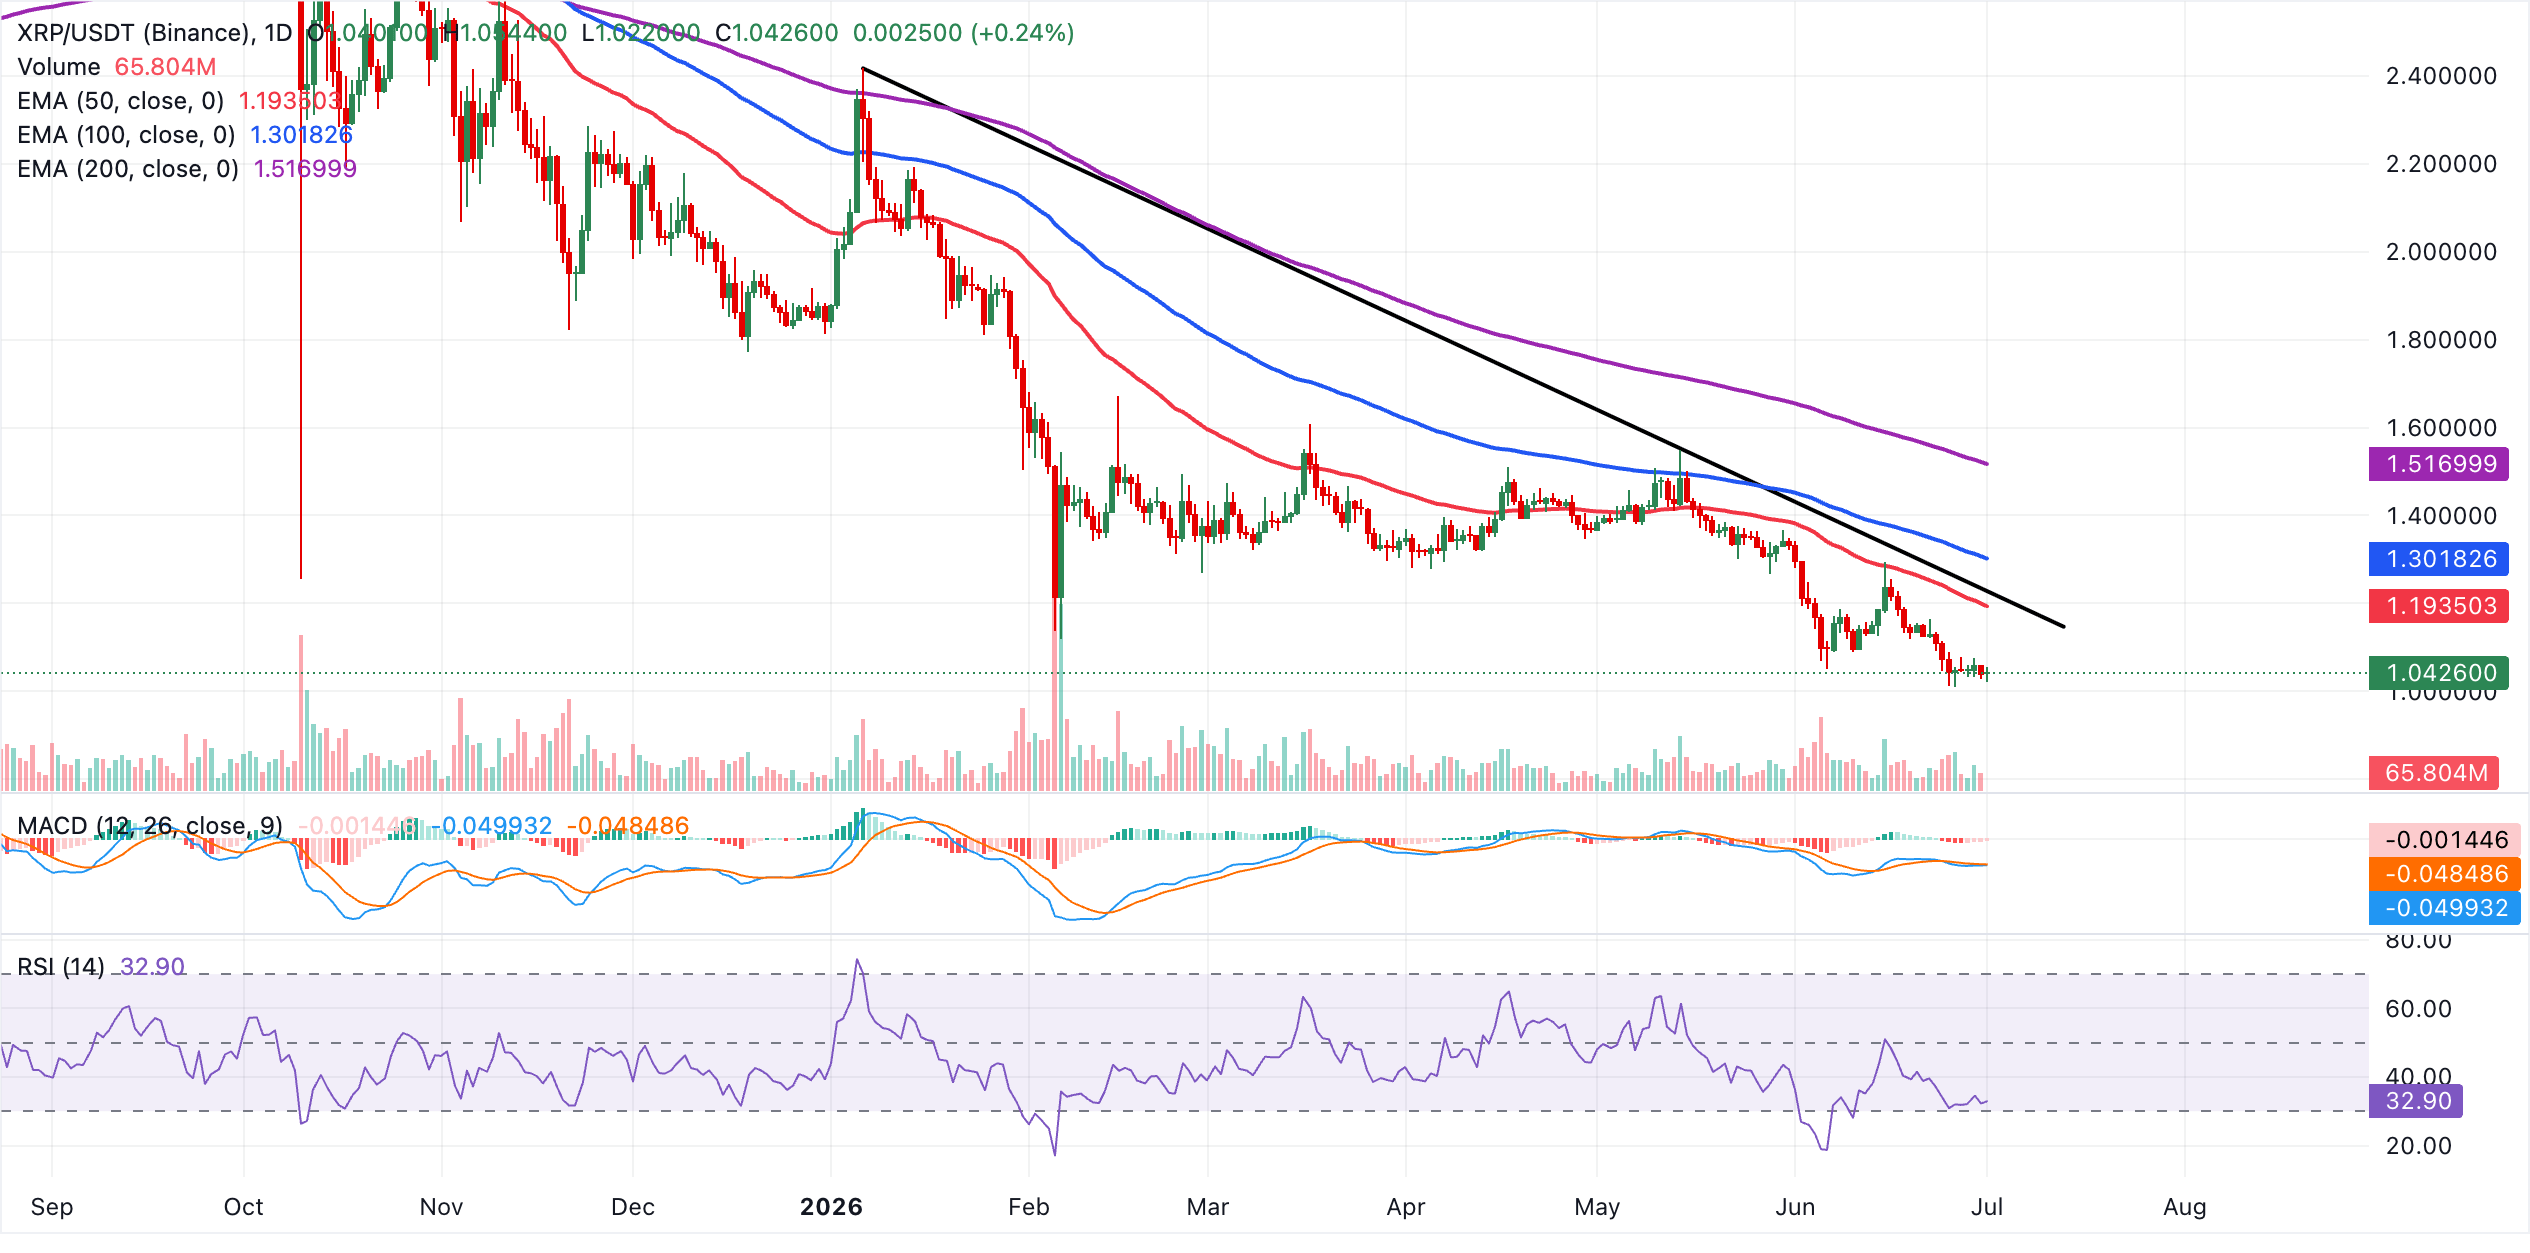
On the topside, initial resistance lies at the 50-day EMA near $1.19, with the trendline break area around $1.23 acting as the next barrier if buyers attempt a recovery. Above that, the 100-day EMA around $1.30 forms a more substantial cap, ahead of the 200-day EMA near $1.52, which defines the upper boundary of the broader bearish regime. Conversely, price action below the current area at $1.04 will be driven by whether sellers can extend the current slide or if oversold conditions entice a corrective bounce back toward those overhead EMAs. The next psychological support lies at $1.00.
(The technical analysis of this story was written with the help of an AI tool.)
Crypto ETF FAQs
An Exchange-Traded Fund (ETF) is an investment vehicle or an index that tracks the price of an underlying asset. ETFs can not only track a single asset, but a group of assets and sectors. For example, a Bitcoin ETF tracks Bitcoin’s price. ETF is a tool used by investors to gain exposure to a certain asset.
Yes. The first Bitcoin futures ETF in the US was approved by the US Securities & Exchange Commission in October 2021. A total of seven Bitcoin futures ETFs have been approved, with more than 20 still waiting for the regulator’s permission. The SEC says that the cryptocurrency industry is new and subject to manipulation, which is why it has been delaying crypto-related futures ETFs for the last few years.
Yes. The SEC approved in January 2024 the listing and trading of several Bitcoin spot Exchange-Traded Funds, opening the door to institutional capital and mainstream investors to trade the main crypto currency. The decision was hailed by the industry as a game changer.
The main advantage of crypto ETFs is the possibility of gaining exposure to a cryptocurrency without ownership, reducing the risk and cost of holding the asset. Other pros are a lower learning curve and higher security for investors since ETFs take charge of securing the underlying asset holdings. As for the main drawbacks, the main one is that as an investor you can’t have direct ownership of the asset, or, as they say in crypto, “not your keys, not your coins.” Other disadvantages are higher costs associated with holding crypto since ETFs charge fees for active management. Finally, even though investing in ETFs reduces the risk of holding an asset, price swings in the underlying cryptocurrency are likely to be reflected in the investment vehicle too.

Oltre un milione di utenti si affida a FXStreet per dati di mercato in tempo reale, strumenti di charting, approfondimenti di esperti e notizie Forex. Il loro calendario economico completo e i webinar formativi aiutano i trader a rimanere informati e a prendere decisioni ponderate. FXStreet conta circa 60 professionisti tra la sede di Barcellona e diverse regioni globali.
Leggi di più


