
Dogecoin Price Forecast: DOGE rises as whales halt sell-off, but retail refuses to bite
Di Vishal Dixit
Aggiornato: 11 Jun 2026


ARTICOLI POPOLARI

Dogecoin (DOGE) is trading in the green at around $0.08500 at press time on Thursday, edging up over 2% despite broader market risk-off sentiment.
- Dogecoin is up over 2% at press time on Thursday, maintaining its footing above $0.08000.
- A brief pause in profit-taking by DOGE whales provides breathing room for buyers.
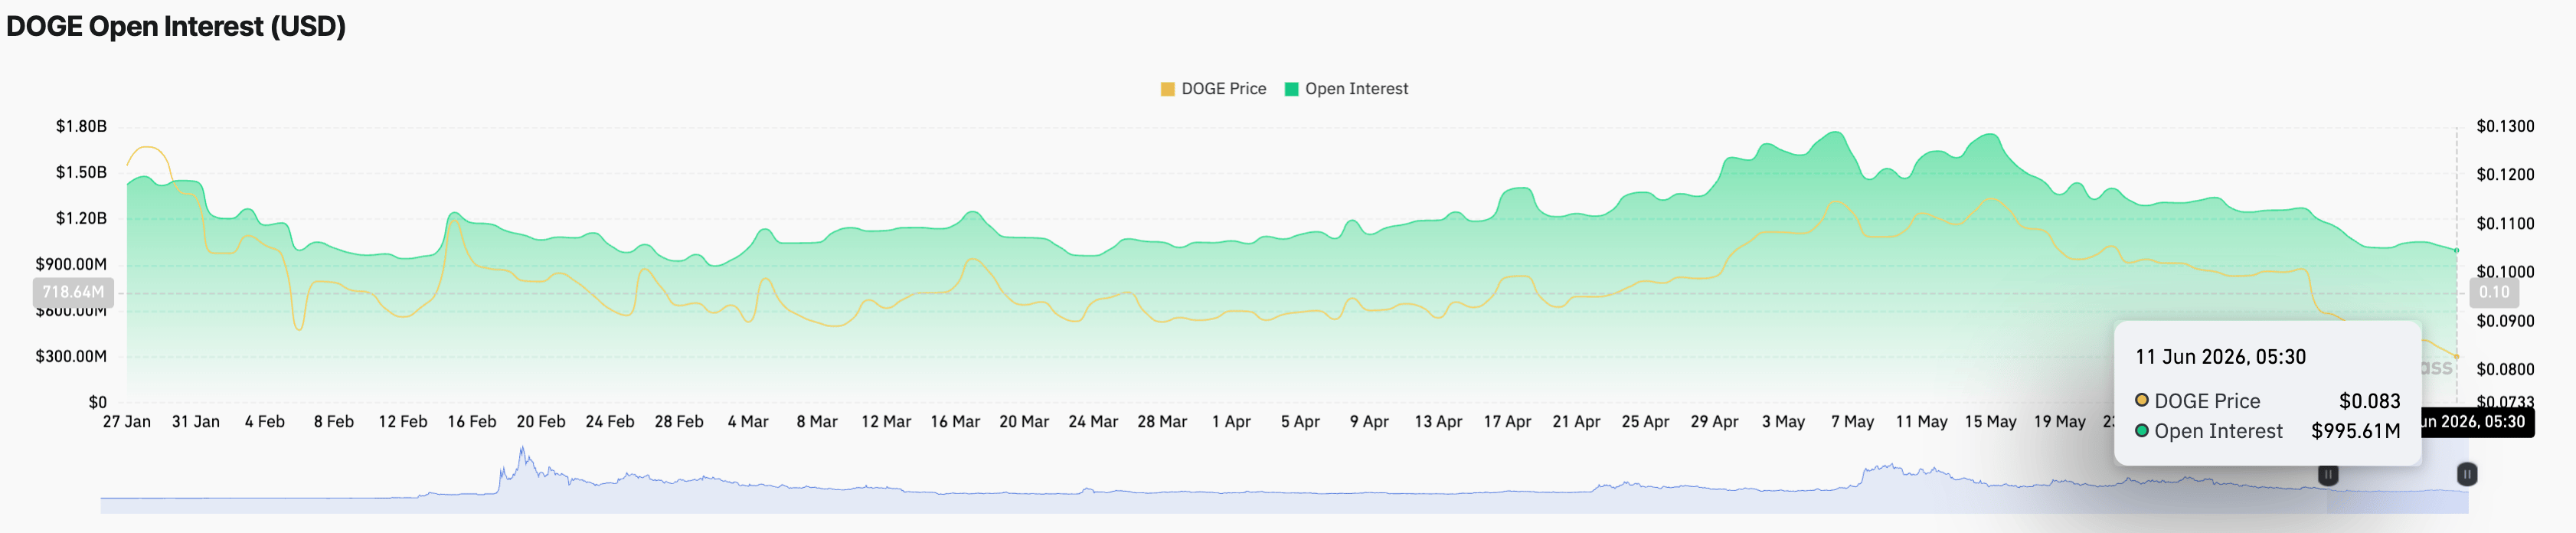
- Retail demand for DOGE is drying up, with Open Interest dropping to a two-month low below $1 billion.
Dogecoin (DOGE) is trading in the green at around $0.08500 at press time on Thursday, edging up over 2% despite broader market risk-off sentiment. On-chain data show that large-wallet investors, commonly referred to as whales, briefly pause their profit-taking, easing the selling pressure that fuels the short-term recovery. However, retail sentiment remains risk-averse, with capital withdrawing from DOGE futures, signaling reduced leverage activity.
Technically, DOGE should sustain above $0.0800 and extend recovery to clear above $0.1000 for a decisive upward trend.
Dogecoin whales take a step back, but retail continues to be bearish
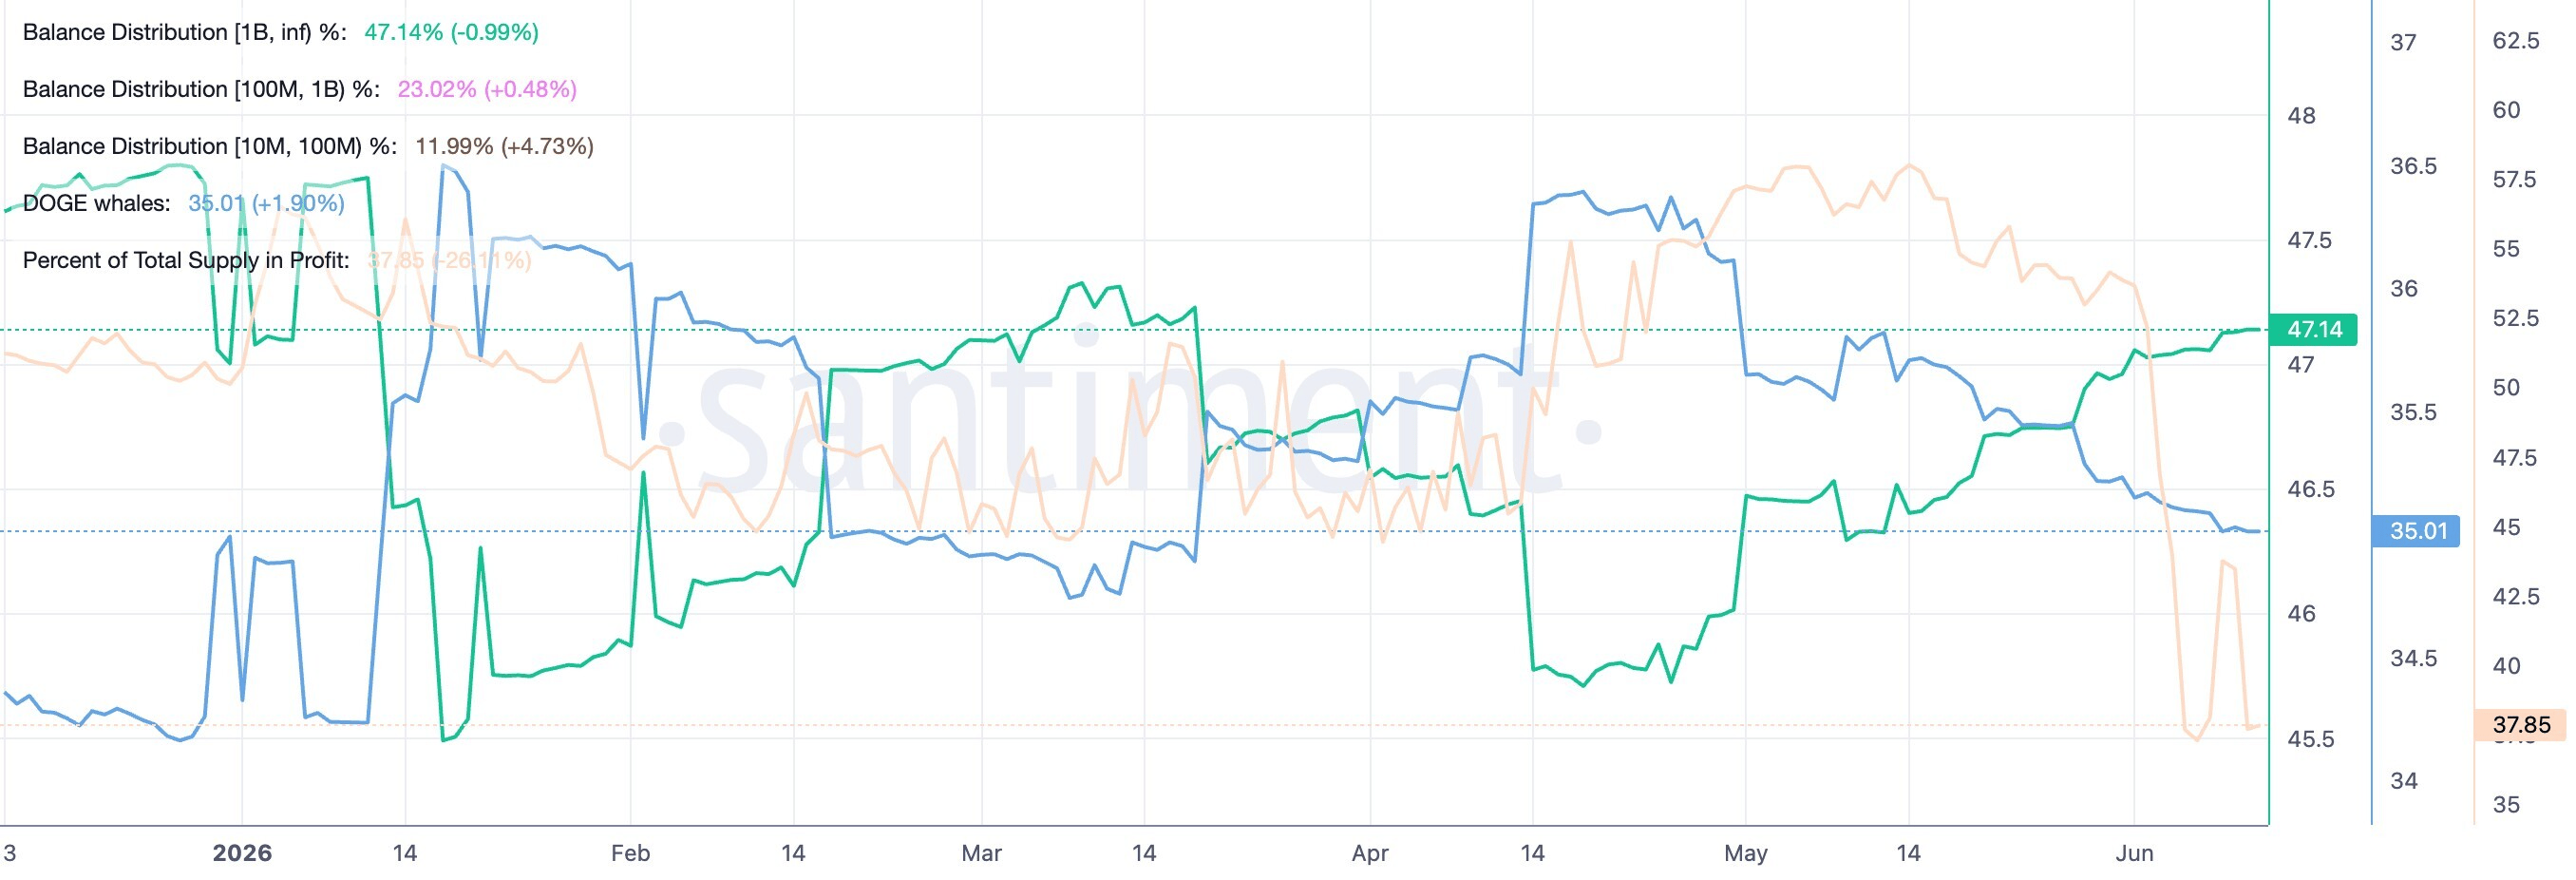
Dogecoin recovers as the bleeding whale wallets halt their supply outflow. Santiment data shows the wallets with over 1 billion DOGE tokens, typically linked to exchanges, hold 47.14% of the total supply as of Thursday, up from 45.73% on April 25.
Meanwhile, the wallets holding 10 million to 1 billion DOGE, which are largely controlled by whales that largely dictate the DOGE price, hold 35.01% of the total supply, up from 36.37% over the same period. However, a sideways trend in these wallet holdings so far this week suggests a brief pause in the distribution, offering a breathing room for bulls.
That said, the DOGE supply in profit is down to 37.85% on Thursday, recording a significant drop from 58.01% on May 14, reflecting the growing pressure on investors.
On the retail side, confidence in Dogecoin remains low. CoinGlass data show that the declining DOGE futures Open Interest (OI) has fallen below $1 billion as traders continue to withdraw capital. As of Thursday, DOGE OI is down to $995.61 million, the lowest since March 24.
Is Dogecoin running on fumes?
Dogecoin hovers above $0.0850 at press time on Thursday, under clear downside pressure, following a 14% drop last week. From a technical perspective, the minor consolidation above the $0.0800 threshold on February 6 reflects intense dip buying that halted further decline.
However, DOGE holds well below the 50-, 100-, and 200-day Exponential Moving Averages (EMAs) at $0.0973, $0.1020, and $0.1179, respectively, which keeps the near-term bias bearish.
That said, a modest intraday bounce from recent lows aligns with early signals of easing downside pressure. The Relative Strength Index (RSI) has lifted to about 33, moving out of oversold territory but still indicating weak demand. Meanwhile, the Moving Average Convergence Divergence (MACD) remains in negative territory with a slightly improving profile that only hints at easing downside momentum rather than a firm reversal.
On the downside, immediate protection is seen at the horizontal support zone near $0.0800-$0.0776, and a decisive break below that floor would open the door to a continuation of the broader decline toward lower uncharted levels.
On the topside, initial resistance aligns with the $0.0879 support-turned-resistance level, followed by the 50-day EMA at $0.0973, which acts as a short-term trend cap.
(The technical analysis of this story was written with the help of an AI tool.)

Oltre un milione di utenti si affida a FXStreet per dati di mercato in tempo reale, strumenti di charting, approfondimenti di esperti e notizie Forex. Il loro calendario economico completo e i webinar formativi aiutano i trader a rimanere informati e a prendere decisioni ponderate. FXStreet conta circa 60 professionisti tra la sede di Barcellona e diverse regioni globali.
Leggi di più


