

Dow Jones Industrial Average sells the war without an earnings alibi
- DJIA falls around 600 points to the 51,600 area, unwinding the week's recovery as the index ends a two-week run of trading through the war.
- Trump tells Axios he is weighing a massive attack on Iran as Red Sea tanker strikes send Brent Crude Oil through the $100.00 handle.
- September hike odds jump to nearly 83% with the 10-year yield above 4.7% and jobless claims at a 57-year low.
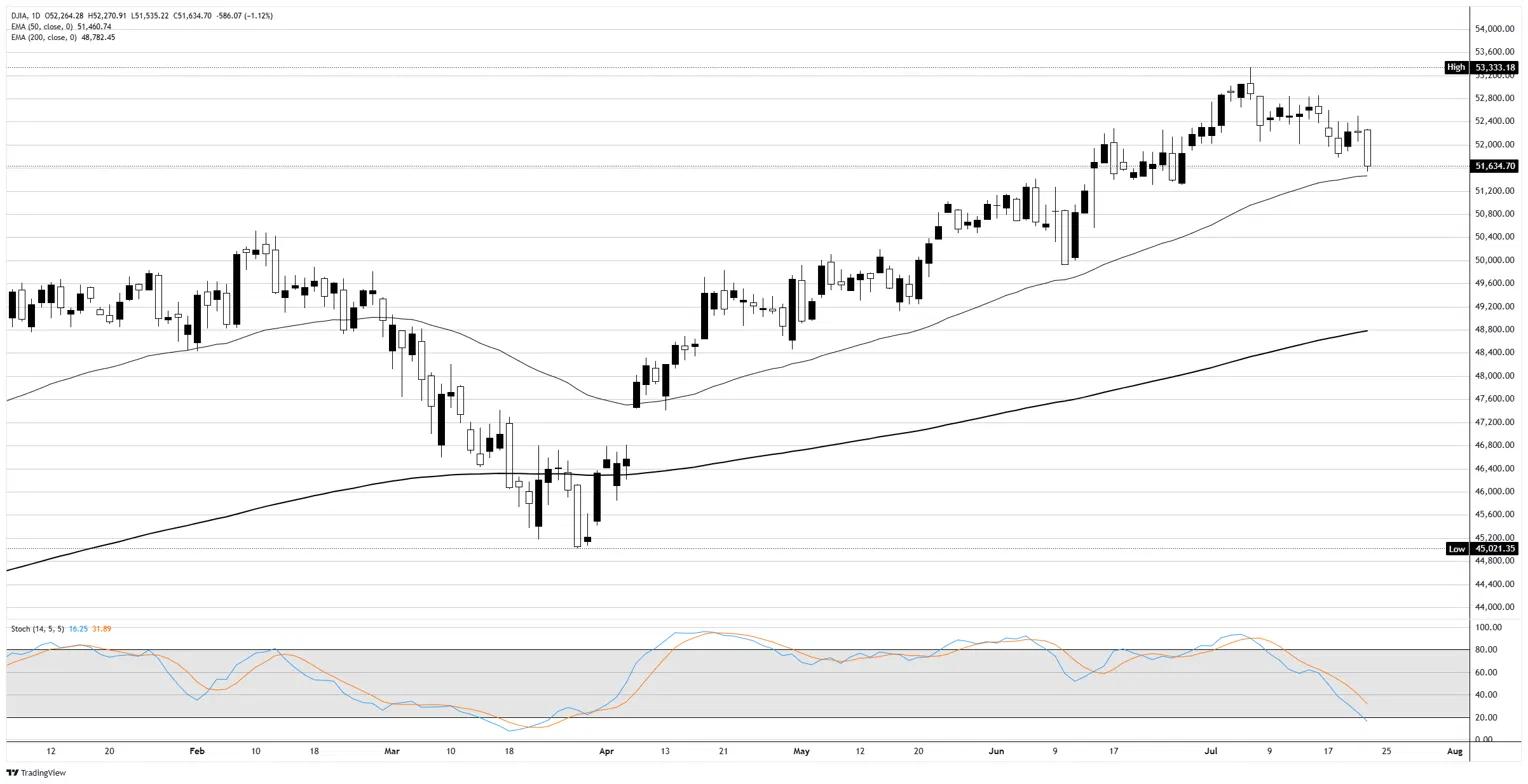
The Dow Jones Industrial Average trades around 600 points lower on Thursday, down 1.1% near 51,600 in a session whose high sits within a handful of points of the opening print. The decline unwinds this week's two-day recovery, carrying the index through the prior weekly floor near 51,800 to its lowest level in roughly three weeks.

The cause of the drop matters more than its size, because equities spent eleven consecutive rounds of nightly strikes treating the war as a Crude Oil problem someone else would pay for, and the Dow led that indifference through both of this week's advances. That trade stops today, and this index, unlike its peers, has nowhere to file the damage except under the war itself.
From price list to blank cheque
The escalation driving the selling arrived in three installments, beginning with Yemen's Tehran-backed Houthi movement claiming strikes on two Saudi tankers in the Red Sea. The attacks convert the maritime embargo Tehran's allies declared last week from rhetoric into action and stretch the war beyond the Strait of Hormuz into a second chokepoint.
Trump then formalized last week's retaliation arithmetic on Truth Social, committing the United States to destroy one Iranian bridge or power plant, including targets beside or inside Tehran, for every ship attacked in the Strait. The third installment landed through an Axios interview in which the president said he is considering a massive attack on Iran larger than anything launched so far, with a decision close and preparations complete. He volunteered that Israel would join within two minutes of being asked and gave no deadline, leaving the countdown missing only its final number.
Crude Oil translated the headlines faster than equities managed, with Brent up 7% above $101.00 for its first look over the $100.00 handle in roughly two months and West Texas Intermediate (WTI) 6% higher beyond $92.00. Both benchmarks now sit at levels last seen before last month's peace framework was signed, and RBC Capital Markets argues a full regional war could carry the tape through the $128.00 high of 2022, or even the $146.00 record of 2008.
An index without an alibi
The S&P 500 trades around 1.2% lower and the Nasdaq more than 2% down, which looks worse than the Dow's showing until composition enters the picture. Alphabet (GOOGL) sheds 6% after lifting its 2026 capital spending forecast to as much as $205 billion, while Tesla (TSLA) drops 13% on a second-quarter miss. Neither name sits inside the 30-stock average, so both of those tapes carry an earnings excuse that this one lacks.
That absence makes the Dow's roughly 600-point decline the cleanest war print on the board: a price-weighted average with no capital-spending controversy and no delivery miss to hide behind still sells off nearly as hard as the S&P 500. The war-shelter divergence flagged in this week's coverage, the Dow outperforming while the bombing rolled on, has not died so much as received its first invoice.
Retail sentiment caught the mood before today's tape confirmed it, with the American Association of Individual Investors' weekly survey showing bulls collapsing to 29.6% from 44.9%, the lowest since last September, while bears climb to 42.3% against a long-run norm near 31%. A reading that lopsided often marks exhaustion in a normal regime, but a regime where the White House floats attacking Tehran's power grid is not that.
The bond market does the translating
The war reaches equities through the curve rather than through fear. The 10-year Treasury yield tops 4.7% for the first time since January 2025, the 2-year trades above 4.35%, and CME FedWatch pricing assigns nearly 83% odds to a September hike, from 52% a week ago. A war that re-inflates energy is a war that re-arms a Federal Reserve chaired by a man on record as uncomfortable with inflation above 2%.
The morning's data then removed the soft-landing counterargument, with initial jobless claims falling to 187K in the week to 18 July, below the 212K consensus and the lowest level since 1969. A labour market that tight against a $100.00 Brent tape is the passthrough combination the hawkish case has forecast all year. Next Wednesday's Fed decision is no longer a placeholder either: the same pricing puts better than one-in-three odds on a hike at that meeting, a one-in-seven tail a week ago, and the December-dated curve now leans toward two hikes this year rather than one.
Friday hands the hawks a microphone
The calendar keeps the pressure on into Friday, when S&P Global's preliminary July Purchasing Managers Index (PMI) round lands at 13:45 GMT: manufacturing is expected to accelerate to 54.5 from 53.9, services is seen near 51 from 51.2, and the composite arrives from a prior 51.9. June New Home Sales follow at 14:00 GMT after May's 7.3% MoM slide. A manufacturing beat would be the threat rather than the comfort here, because every release confirming acceleration feeds the repricing that is bleeding equities today.
Technical levels to watch
Resistance: The 52,000 handle, surrendered inside the opening hour, is the first hurdle and the line any recovery must reclaim. The 52,500 area capped both of this week's advances and guards the range highs, while the record just above 53,300 stays out of the conversation until the index trades back through both.
Support: Today's low probed the 51,500 area, where the rising 50-day Exponential Moving Average (EMA) sits as the last defence of the July trend. A daily close through the average opens the late-June shelf near 51,200, with the 51,000 handle the round-number backstop beneath.
Bias: Bearish below the 52,000 handle. The index trades beneath the 51,800 invalidation line flagged in this week's map and is on track for the daily close that confirms the bullish setup's failure, leaving the 50-day EMA as the only support of consequence between the tape and 51,200. An oversold daily Stochastic reading argues for chop rather than rescue, and a daily close back above 52,000 invalidates the bearish read while putting the 52,500 supply shelf back in play.
Dow Jones daily chart
Dow Jones FAQs
The Dow Jones Industrial Average, one of the oldest stock market indices in the world, is compiled of the 30 most traded stocks in the US. The index is price-weighted rather than weighted by capitalization. It is calculated by summing the prices of the constituent stocks and dividing them by a factor, currently 0.152. The index was founded by Charles Dow, who also founded the Wall Street Journal. In later years it has been criticized for not being broadly representative enough because it only tracks 30 conglomerates, unlike broader indices such as the S&P 500.
Many different factors drive the Dow Jones Industrial Average (DJIA). The aggregate performance of the component companies revealed in quarterly company earnings reports is the main one. US and global macroeconomic data also contributes as it impacts on investor sentiment. The level of interest rates, set by the Federal Reserve (Fed), also influences the DJIA as it affects the cost of credit, on which many corporations are heavily reliant. Therefore, inflation can be a major driver as well as other metrics which impact the Fed decisions.
Dow Theory is a method for identifying the primary trend of the stock market developed by Charles Dow. A key step is to compare the direction of the Dow Jones Industrial Average (DJIA) and the Dow Jones Transportation Average (DJTA) and only follow trends where both are moving in the same direction. Volume is a confirmatory criteria. The theory uses elements of peak and trough analysis. Dow’s theory posits three trend phases: accumulation, when smart money starts buying or selling; public participation, when the wider public joins in; and distribution, when the smart money exits.
There are a number of ways to trade the DJIA. One is to use ETFs which allow investors to trade the DJIA as a single security, rather than having to buy shares in all 30 constituent companies. A leading example is the SPDR Dow Jones Industrial Average ETF (DIA). DJIA futures contracts enable traders to speculate on the future value of the index and Options provide the right, but not the obligation, to buy or sell the index at a predetermined price in the future. Mutual funds enable investors to buy a share of a diversified portfolio of DJIA stocks thus providing exposure to the overall index.














