
Ethereum Price Forecast: ETH recovers $2,300 despite sustained whale selling pressure
Di Michael Ebiekutan
Aggiornato: 8 May 2026


ARTICOLI POPOLARI

Ethereum (ETH) has erased gains recorded earlier in the week and is hovering near $2,300 at the time of writing on Friday. The move follows sustained selling activity across key whale wallets.
Ethereum price today: $2,310
- A key whale wallet deposited 78K ETH to Binance on Friday, stretching its potential sales to 244K ETH over the past three days.
- Ethereum ETFs broke their four-day inflow streak, recording $103.5 million in outflows.
- ETH bounced off the 50-day EMA after a 2-day decline.
Ethereum (ETH) has erased gains recorded earlier in the week and is hovering near $2,300 at the time of writing on Friday. The move follows sustained selling activity across key whale wallets.
A key Bitcoin OG, Garrett Jin, who also holds a large ETH balance, transferred another 78K ETH to the crypto exchange Binance on Friday, according to smart money tracker EmberCN. The whale had previously moved 166K ETH to the exchange on Wednesday, bringing its potential sales to 244K ETH over the past three days.
The sale coincides with a nearly 6% decline in ETH's price as the top altcoin fell from $2,423 to $2,277 during the period.
The whale is known for timing the October 10 leverage flush after building a massive $1.1 billion short position. However, it suffered a $378 million loss from several long positions in January.
Market participants often use whale activity to time their market entries and exits.
Similarly, several notable whale wallets have increased deposits to exchanges over the past few days.
On the institutional side, US spot ETH exchange-traded funds broke their four-day inflow streak on Thursday, posting $103.5 million in net outflows, per SoSoValue data.
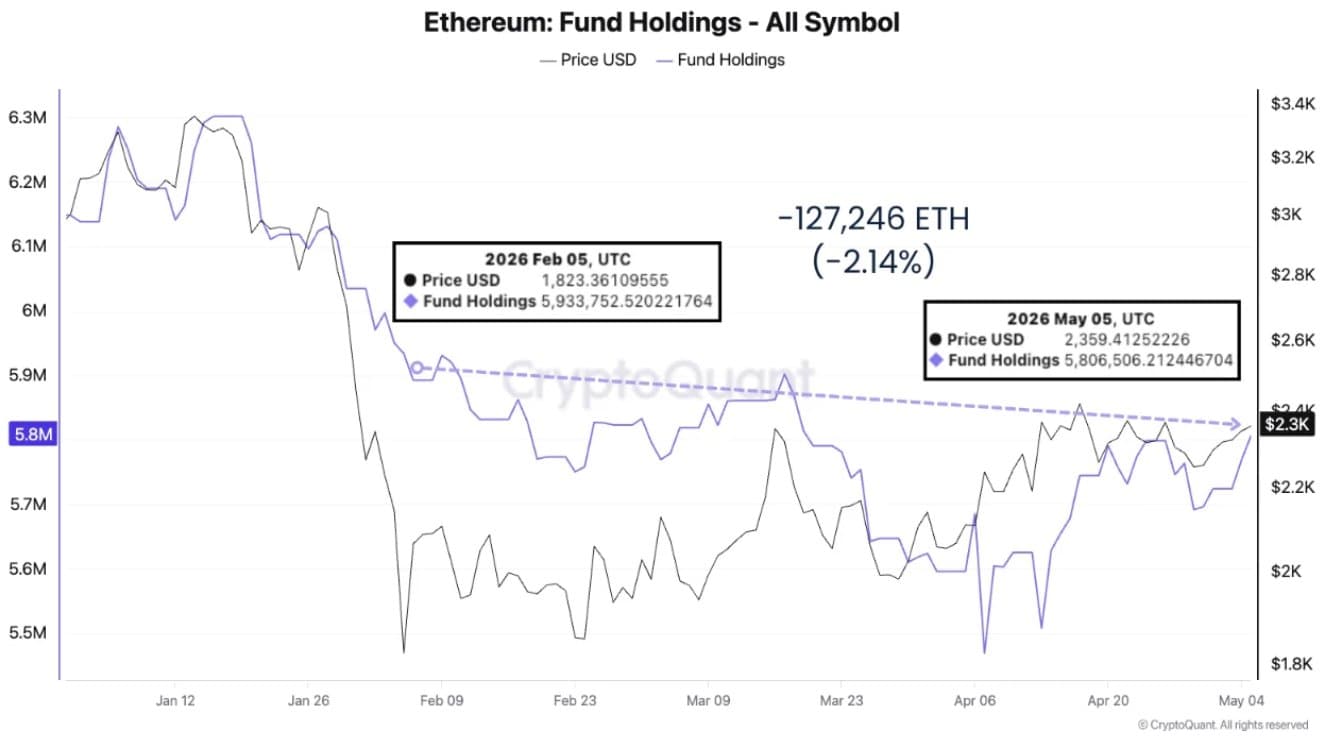
According to a CryptoQuant report on Thursday, institutional capital is showing a preference for Bitcoin over Ethereum. Since the market bottom in early February, Bitcoin funds have added 92,116 BTC while Ethereum funds have shed 127,000 ETH. The latter only picked up pace in April.
"During periods of uncertainty, many funds appear more willing to reduce ETH exposure first, while maintaining or rebuilding BTC positions as the 'safer' crypto allocation," the report states.
Meanwhile, bearish positioning in ETH perpetuals continues to weigh on prices, as funding rates show short dominance.
Ethereum Price Forecast: ETH holds 50-day EMA support
Ethereum recorded $43.4 million in liquidations over the past 24 hours, led by $27.8 million in long liquidations.
On the daily chart, ETH is holding a constructive bias as it sits near the 20- and 50-day Exponential Moving Averages (EMAs) at roughly $2,307 and $2,265, respectively. This positioning suggests dip-buying interest persists, while the 100-day EMA near $2,355 serves as the first notable overhead cap.
Momentum is mildly positive, with the Relative Strength Index hovering just above the 50 line and the Stochastic oscillator in mid-range, hinting at room for extension but without strong directional conviction.
On the topside, immediate resistance emerges at the 100-day EMA, followed by a horizontal barrier at $2,388; a sustained break above this zone would open the way toward $2,746 and then $3,411 as next bullish objectives.
On the downside, initial protection is provided by the 50-day EMA around $2,265, which prices bounced off on Friday, with stronger structural support at $2,211 and then $2,107. A loss of these levels would expose deeper retracements toward $1,909 and $1,741.
(The technical analysis of this story was written with the help of an AI tool.)

Oltre un milione di utenti si affida a FXStreet per dati di mercato in tempo reale, strumenti di charting, approfondimenti di esperti e notizie Forex. Il loro calendario economico completo e i webinar formativi aiutano i trader a rimanere informati e a prendere decisioni ponderate. FXStreet conta circa 60 professionisti tra la sede di Barcellona e diverse regioni globali.
Leggi di più


