

Ethereum Price Forecast: ETH remains fragile underneath the surface despite outperformance
Ethereum price today: $1,830
- US sentiment toward Ethereum remains in negative territory despite declines in ETH exchange reserves and ETF inflows.
- Ethereum’s increasing transaction counts and staking inflows are driven by a few players rather than broad market participation.
- ETH eyes a bounce off the 50-day EMA and $1,806 horizontal level.
Ethereum's (ETH) outperformance over the past week shows it's gaining relative strength against other top cryptocurrencies, but under the surface, key metrics indicate its rise remains fragile.
Between last week and Wednesday, ETH recorded double-digit gains, outperforming fellow crypto majors Bitcoin (BTC), XRP, and Solana (SOL), before the broader market began to correct on Thursday.

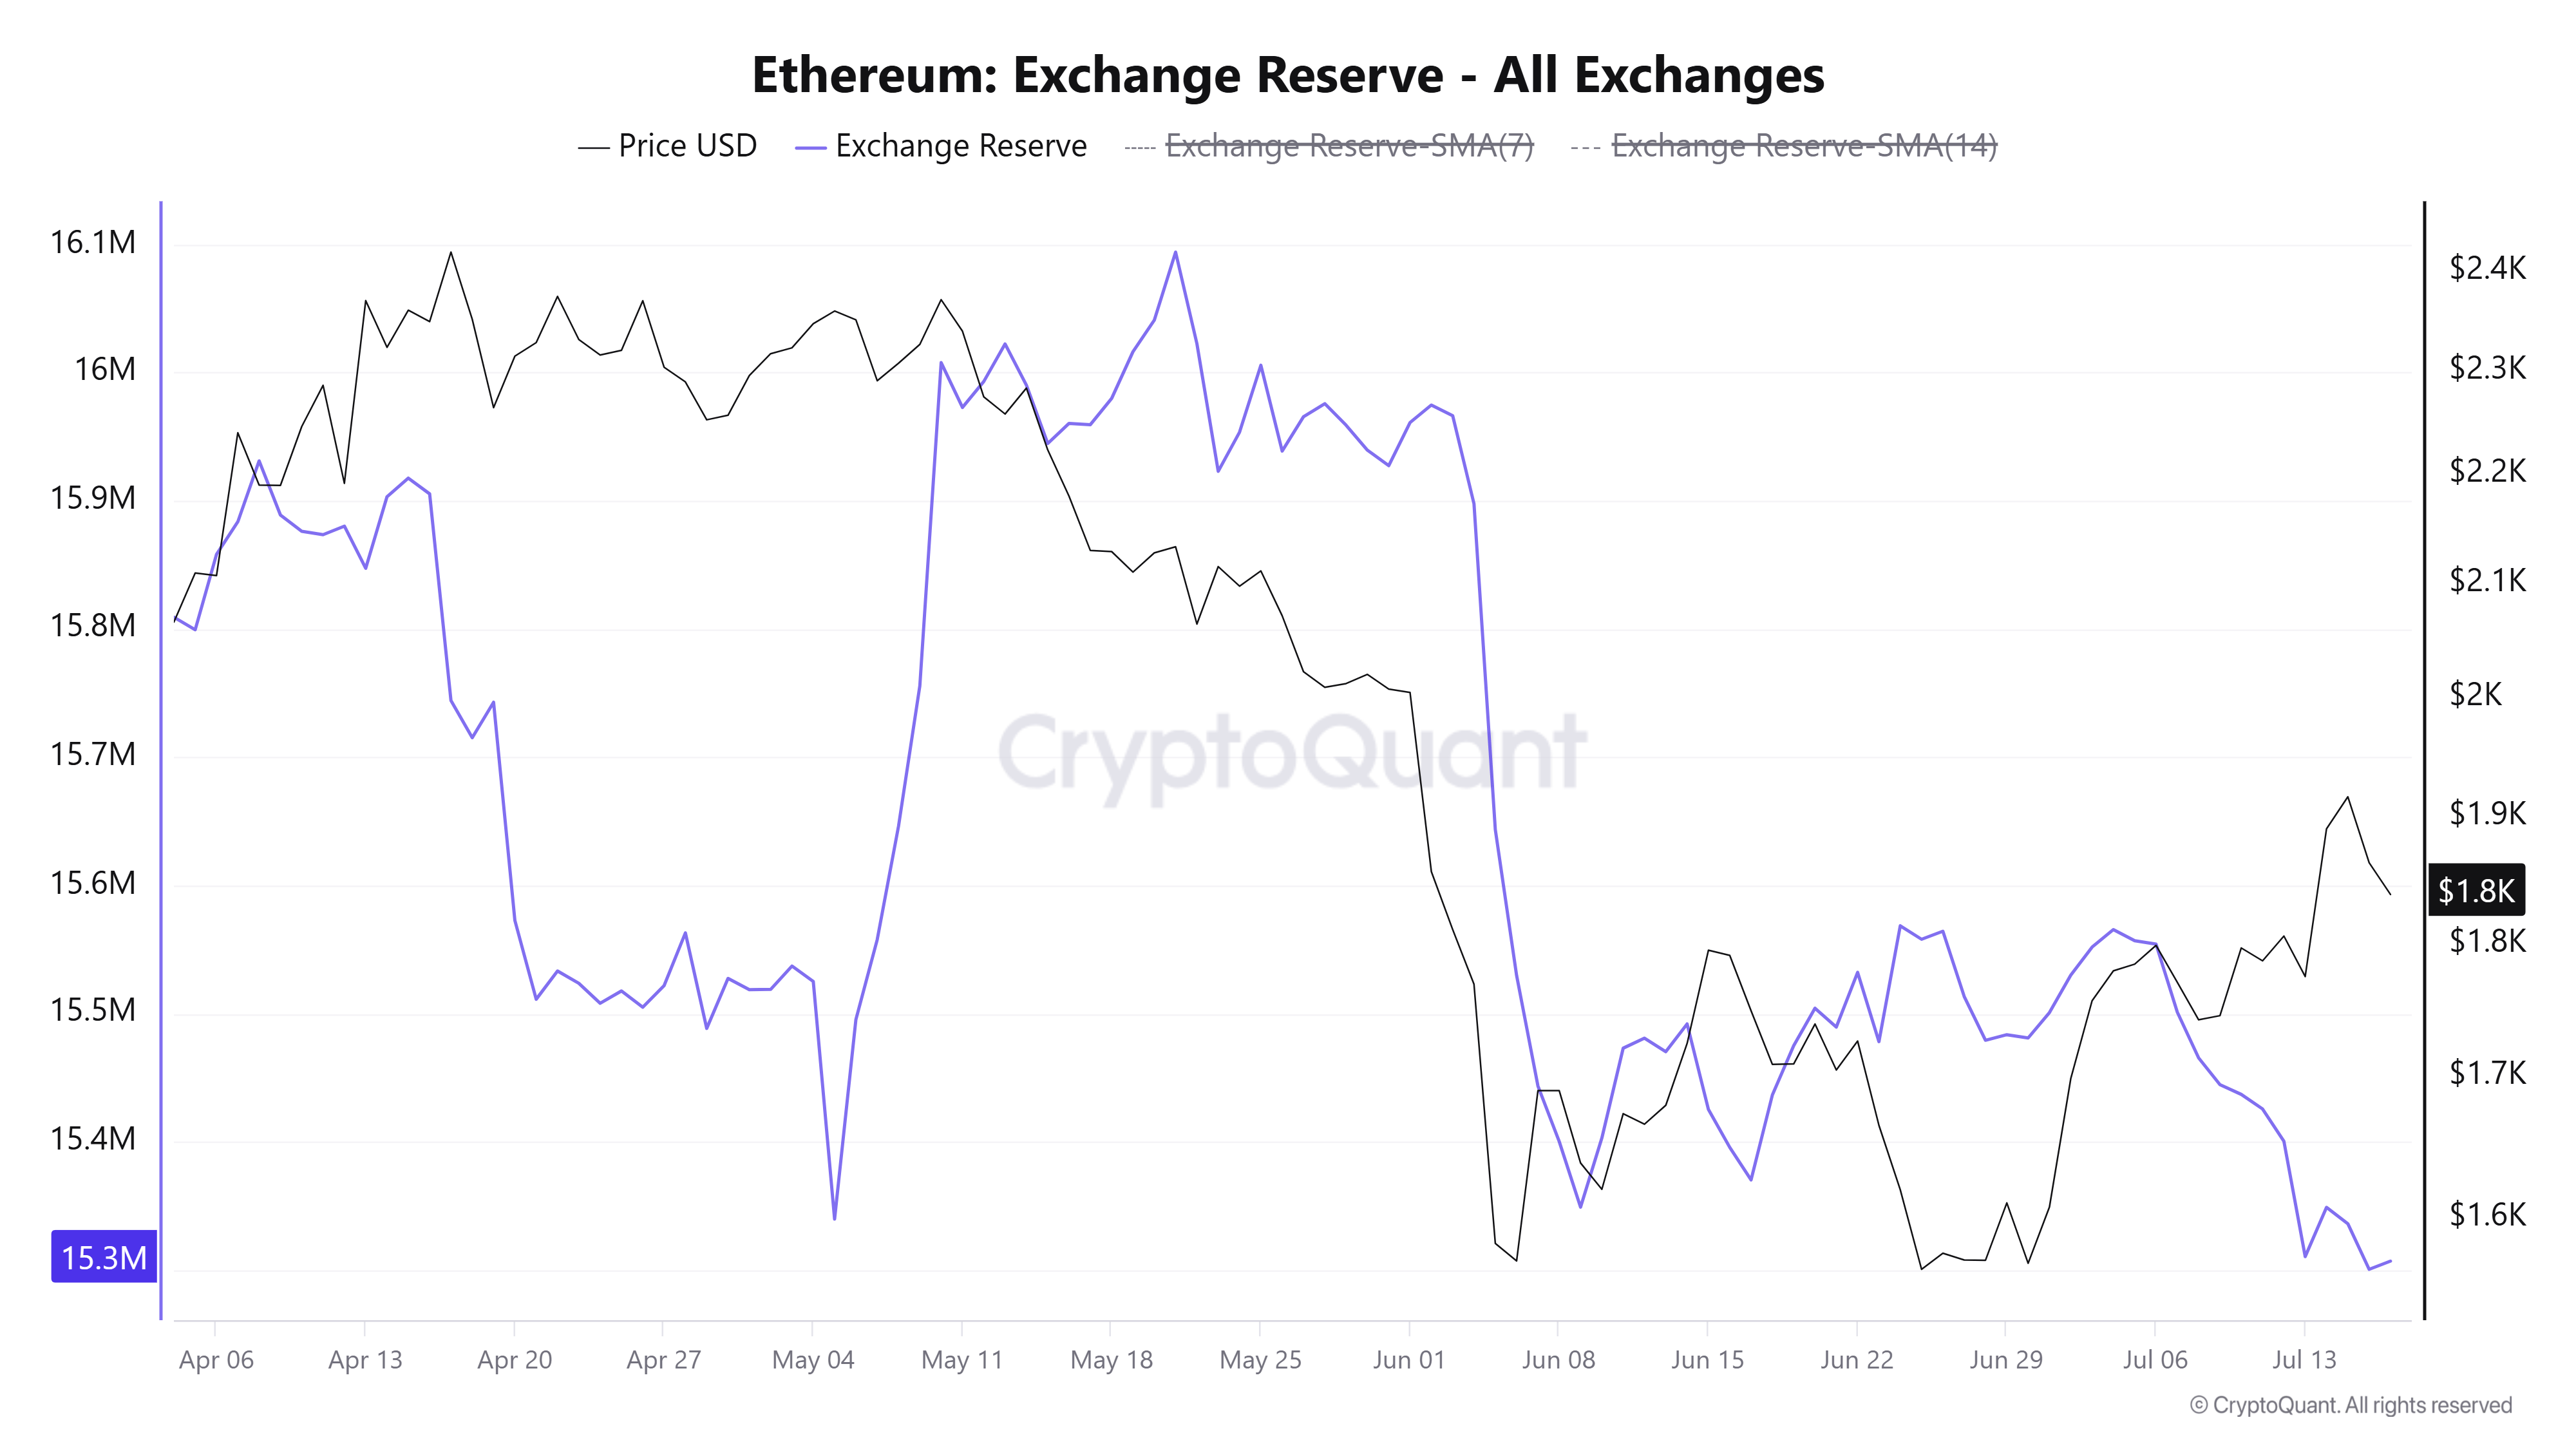
Since July 5, Ethereum Exchange Reserves have fallen by 253K ETH, indicating more investors are moving coins to self-custody wallets and reducing available sell-side supply.
Similarly, US spot ETH exchange-traded funds (ETFs) are on track to end the week positively after $68 million in net inflows between Monday and Thursday, according to SoSoValue data.
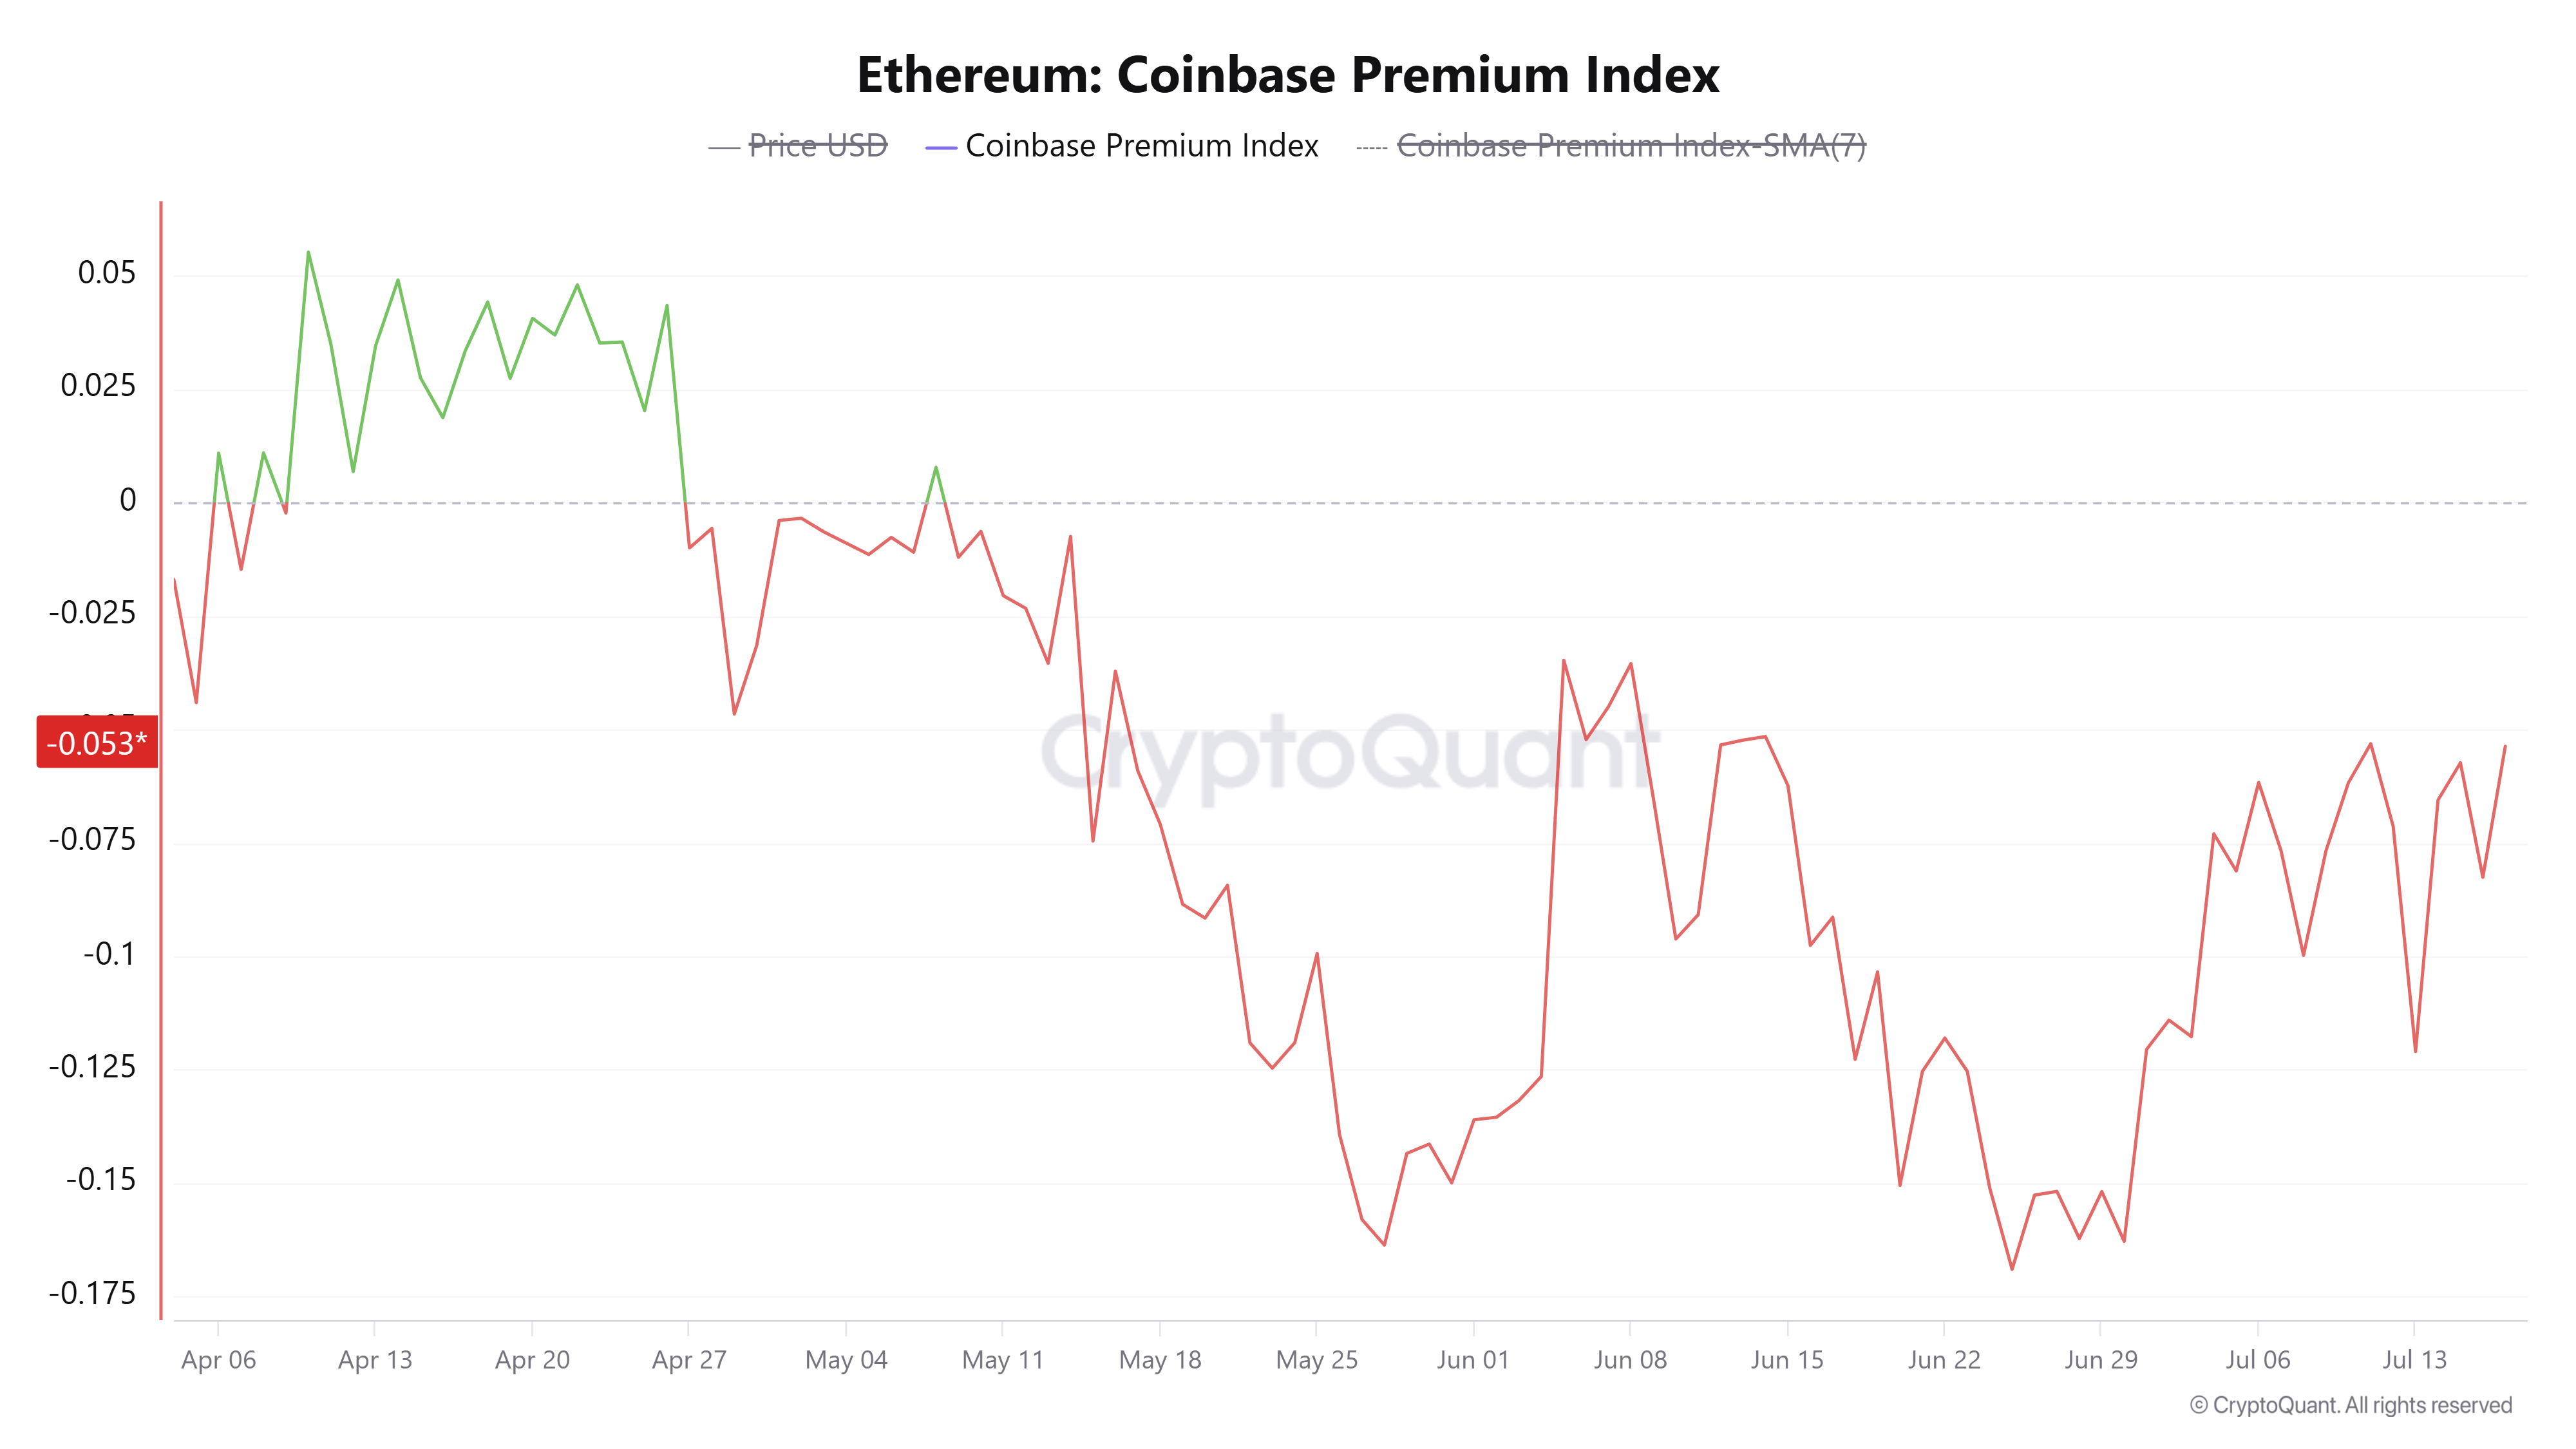
However, the Coinbase Premium Index, which measures US sentiment, remains in negative territory despite seeing a slight recovery earlier in the week. The metric has to recover to positive levels and remain there to sustain ETH’s price growth.
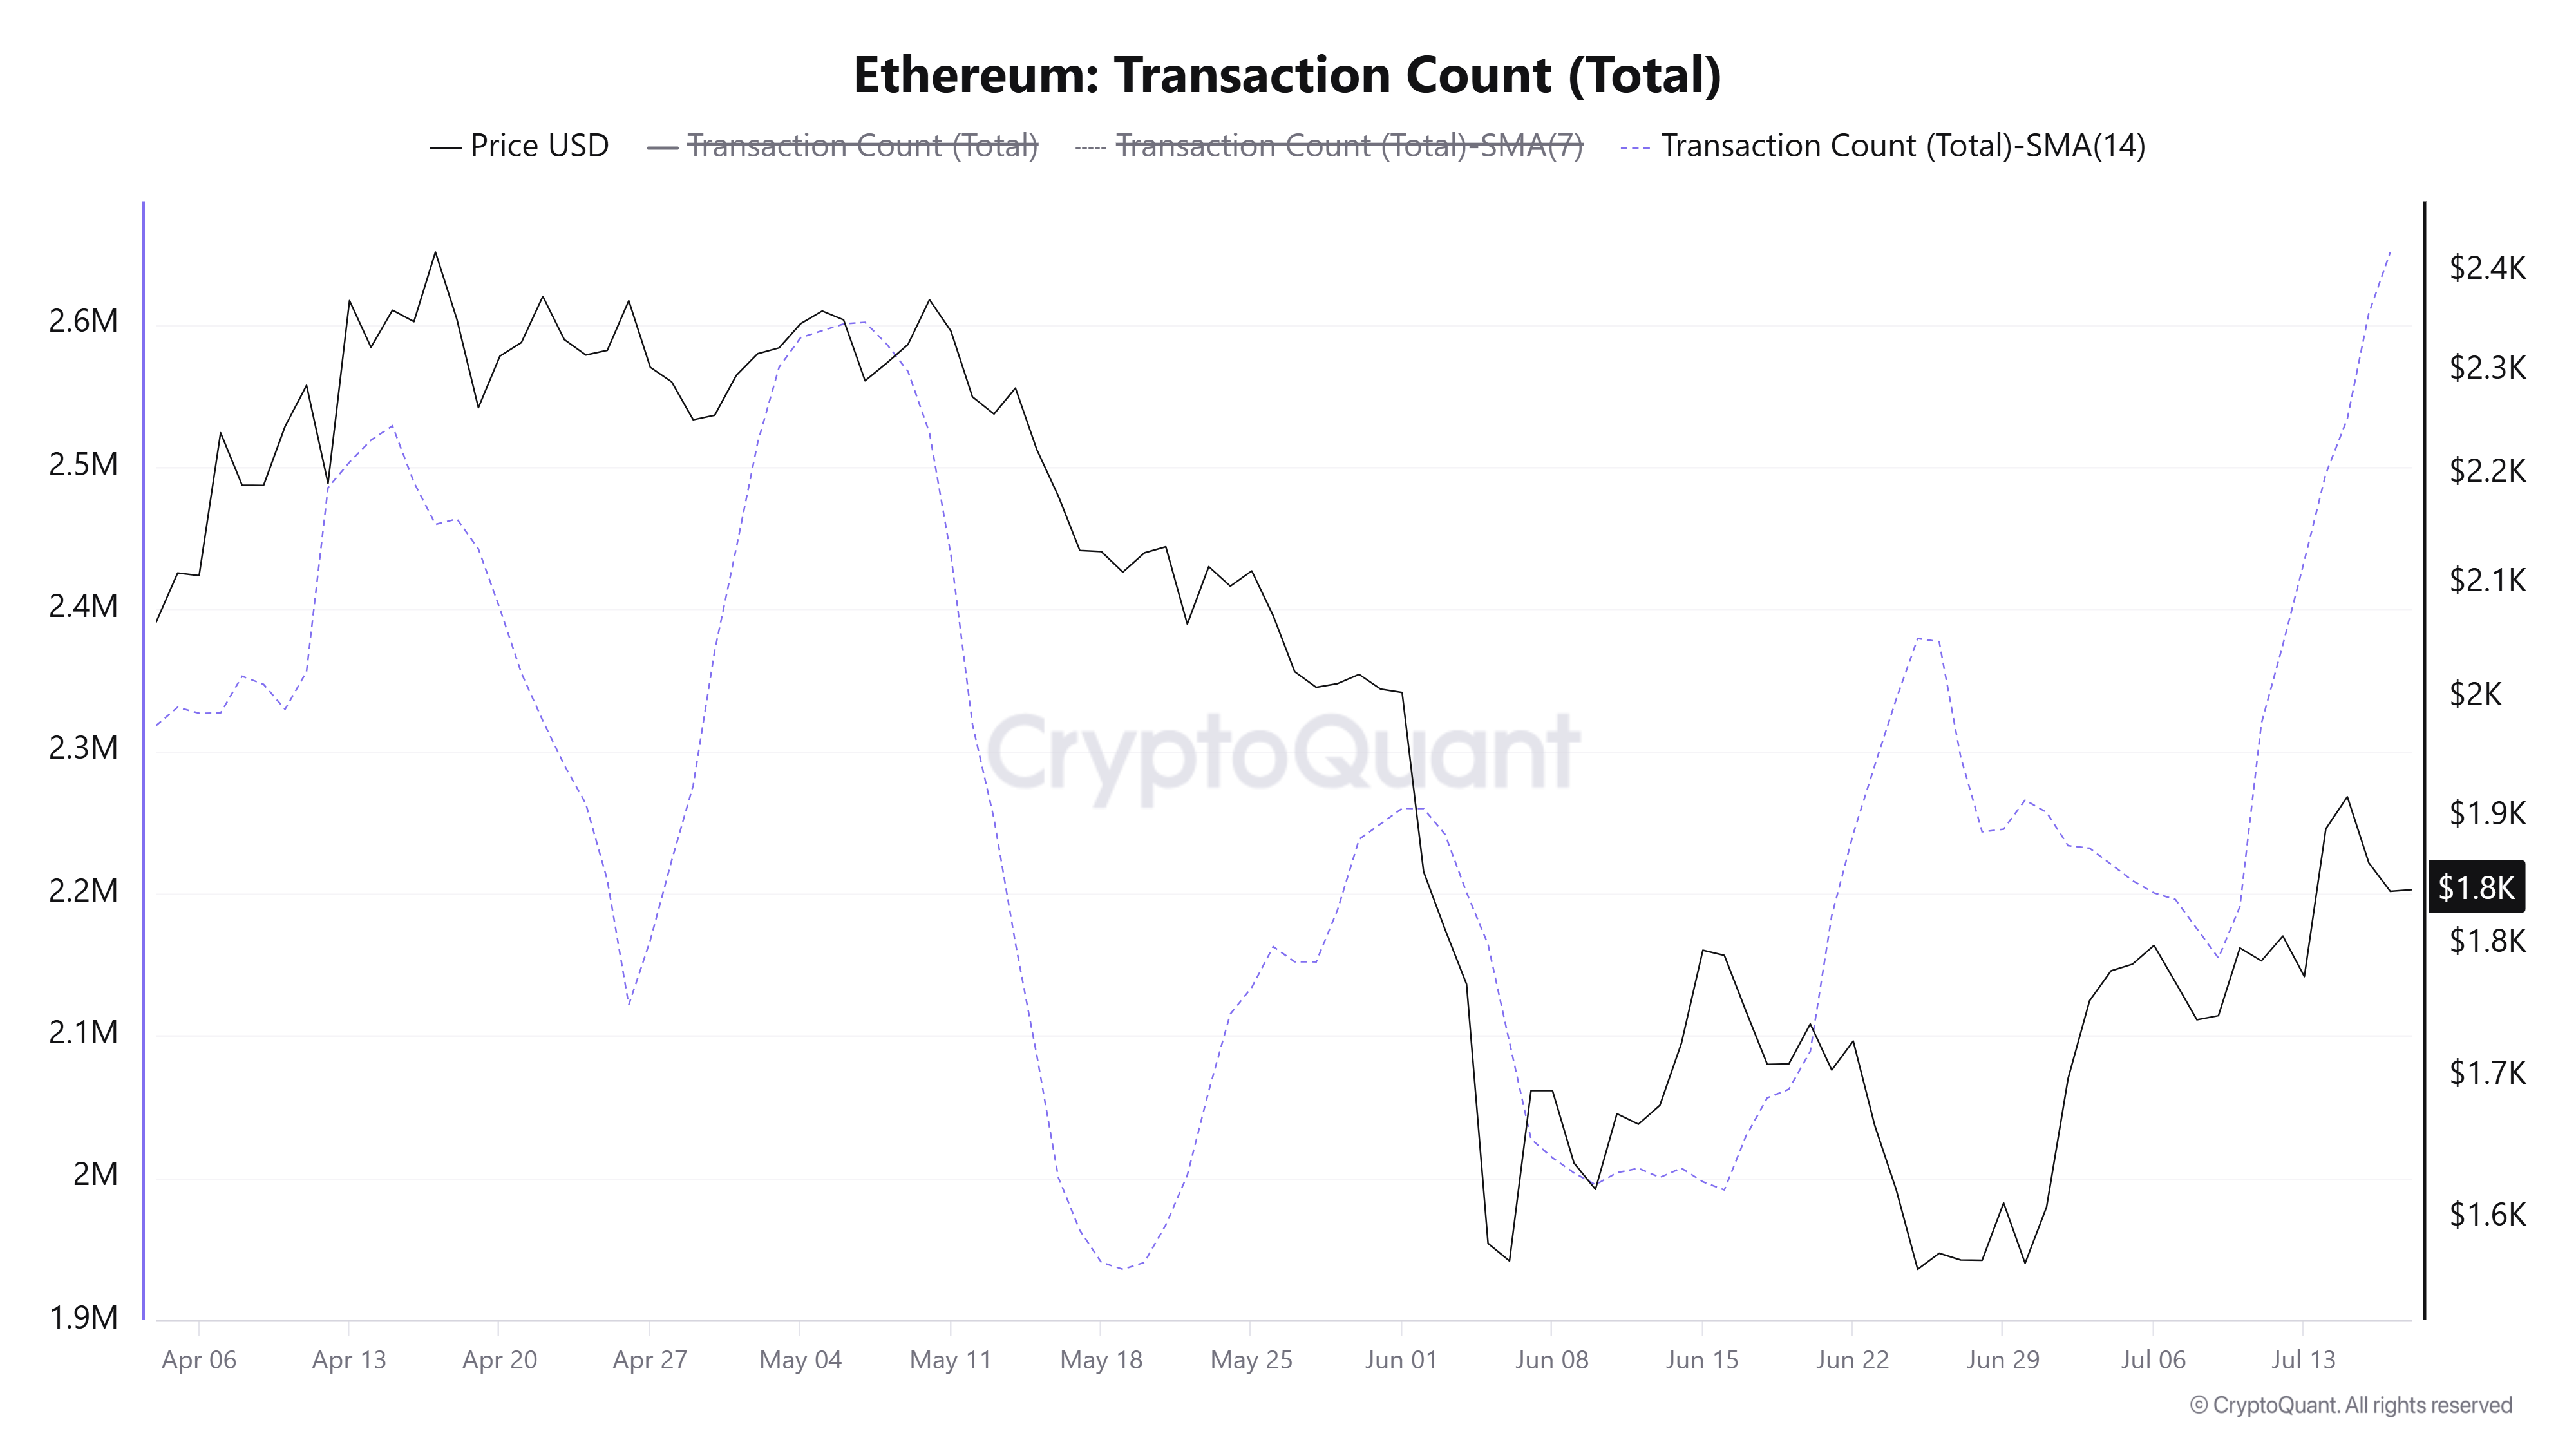
Meanwhile, network activity shows a mixed outlook. The 14-day moving average of transaction counts has soared to a new high of 2.65 million, breaking its May record.
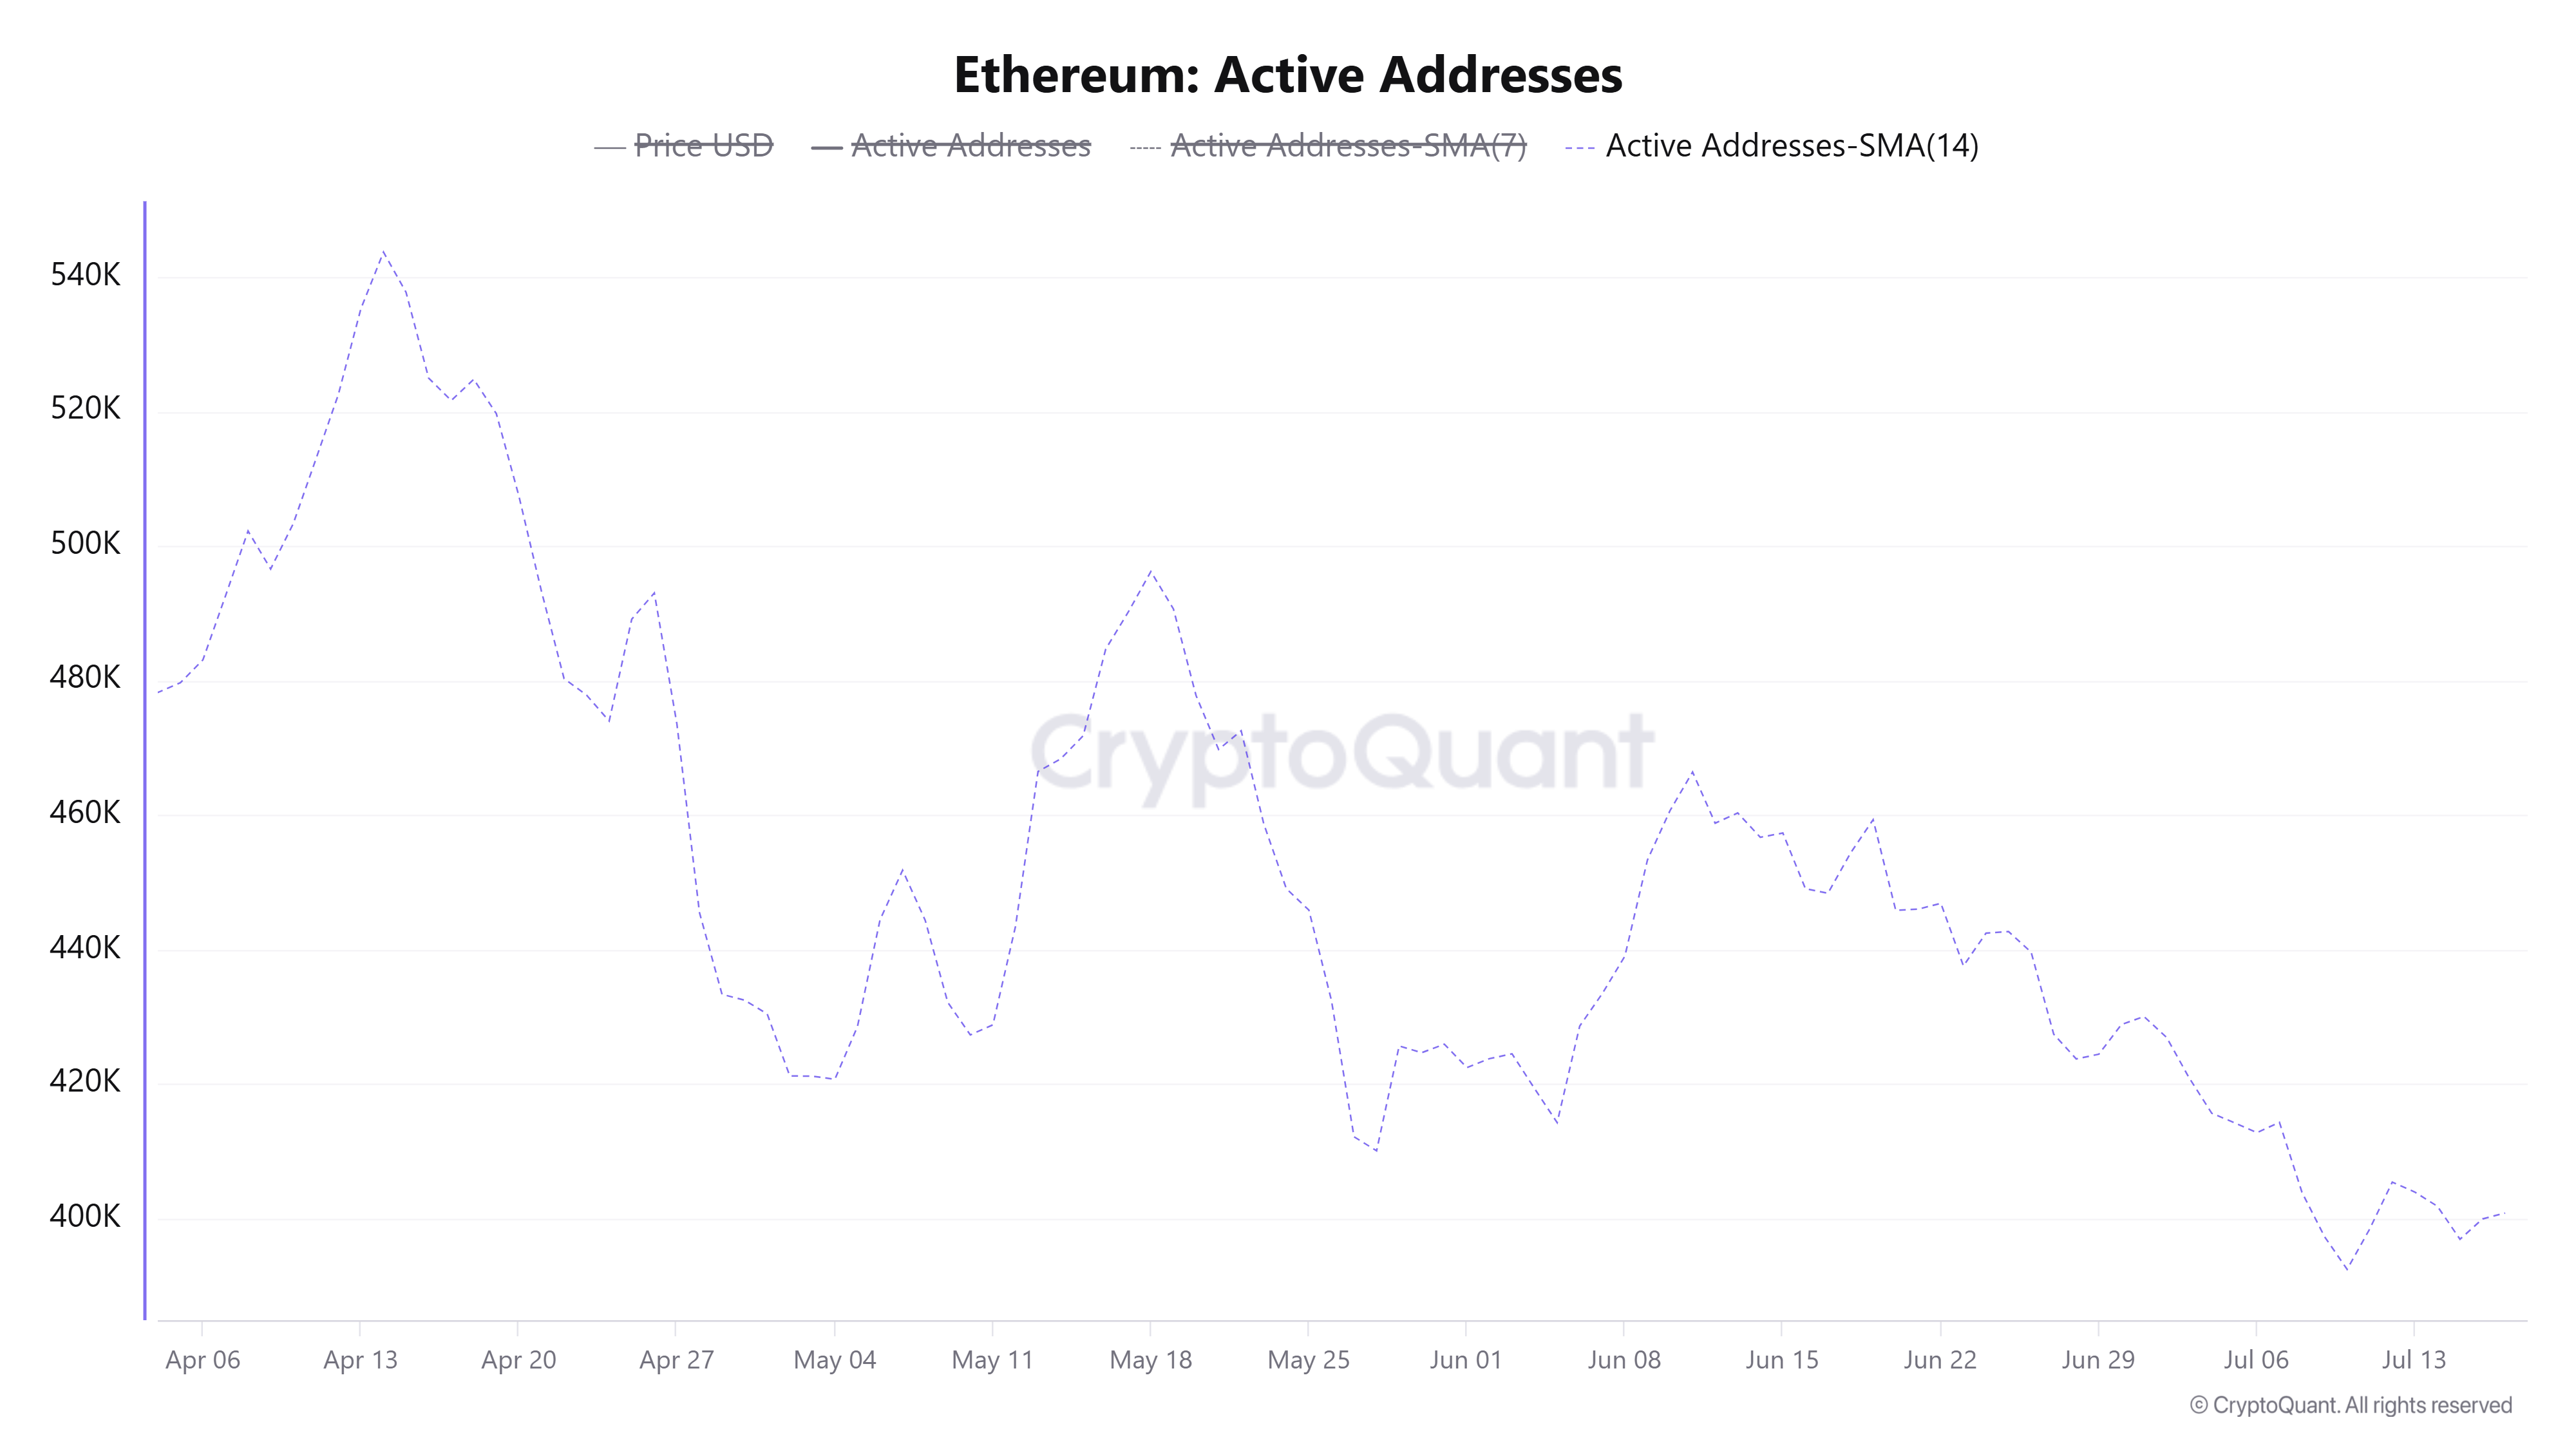
However, active addresses have continued to decline, with their 14-day SMA falling to 397K, their lowest level since December. The divergence indicates that fewer wallets are interacting with the network, but are executing transactions at a higher frequency. Historically, booms in transaction counts without broad network participation are difficult to sustain price growth.
Meanwhile, the total value of staked ETH continues to soar, reaching a new record high of 40.93 million ETH, up 4.94 million ETH since the beginning of the year. On the surface, the sustained growth in staking inflows reflects confidence in the top altcoin, as investors lock up their tokens to earn yield and contribute to network security while expecting a price recovery.
However, it's important to note that a majority of the staking inflows have stemmed from Ethereum treasury firm BitMine Immersion (BMNR), which has staked 4.9 million ETH since December. Hence, the growth in total ETH staked doesn't necessarily reflect broad participation in staking.
Ethereum Price Forecast: ETH eyes a bounce off the 50-day EMA
Ethereum has seen $91.4 million in liquidations over the past 24 hours, led by $61 million in long liquidations.
On the daily chart, ETH is holding a constructive near-term bullish bias, with price above the 20- and 50-day Exponential Moving Averages (EMAs) at $1,791 and $1,812. Momentum stays positive with the Relative Strength Index (RSI) hovering in the mid-50s and the Stochastic Oscillator (Stoch) elevated, which together suggest that buying pressure remains in control, even as the advance starts to look stretched.
On the topside, initial resistance is seen at the horizontal barrier near $1,909, ahead of a denser supply zone formed by the 100-day EMA at $1,942 and the $2,018 and $2,107 levels. Further hurdles are at $2,211 and $2,388.
On the downside, immediate support is aligned around $1,812–$1,806, where the 50-day EMA and a horizontal level converge, followed by the 20-day EMA and the structural floor at $1,741. A deeper setback would expose the next medium-term supports at $1,524, $1,404 and $1,155.
(The technical analysis of this story was written with the help of an AI tool. Know more.)














