
Ethereum Price Forecast: Network activity remains elevated despite recent declines
Di Michael Ebiekutan
Aggiornato: 10 Jun 2026


ARTICOLI POPOLARI

Ethereum Active Addresses have maintained a downtrend since declining from peak levels in early February. The 14-day moving average of the metric shows that unique on-chain participation has been contracting MoM since the sharp decline in February.
Ethereum price today: $1,620
- Ethereum active addresses and transaction counts have declined in recent weeks but remain elevated compared to levels observed last year.
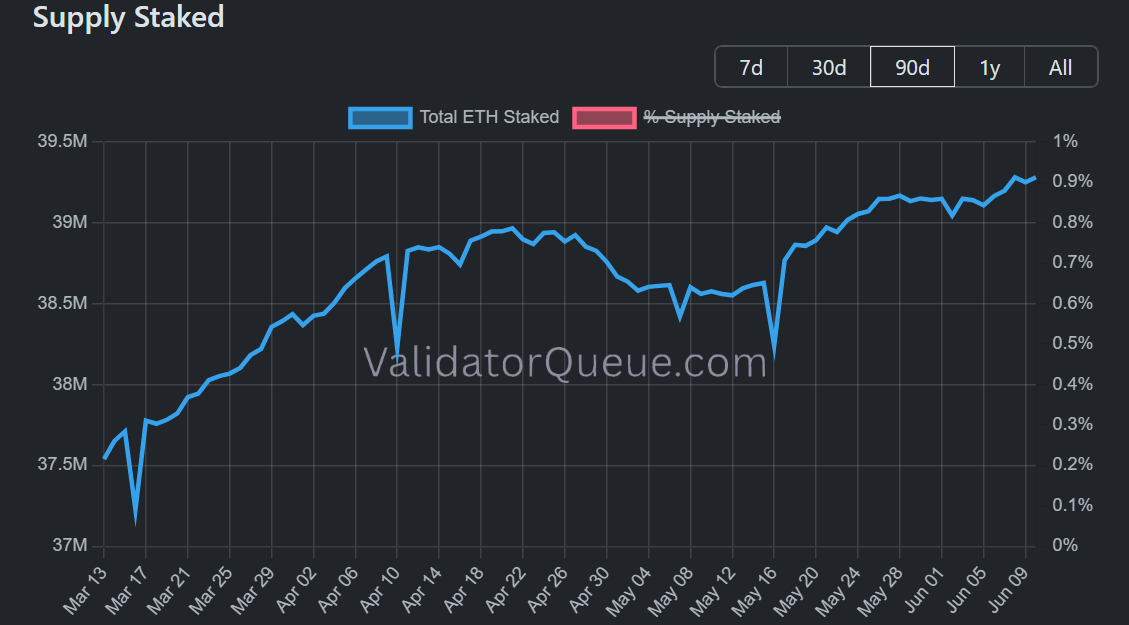
- The supply of staked ETH continues to soar to record highs, indicating investors are flocking toward staking to earn yield while prices remain subdued.
- ETH maintains a bearish bias as it eyes the $1,524 support level.
Ethereum Active Addresses have maintained a downtrend since declining from peak levels in early February. The 14-day moving average of the metric shows that unique on-chain participation has been contracting MoM since the sharp decline in February.
Notably, the metric bounced near 414K last Friday after ETH approached $1,500, indicating that the price level triggered market participants to return to the market. Hence, making $1,500 a potential key on-chain support level.
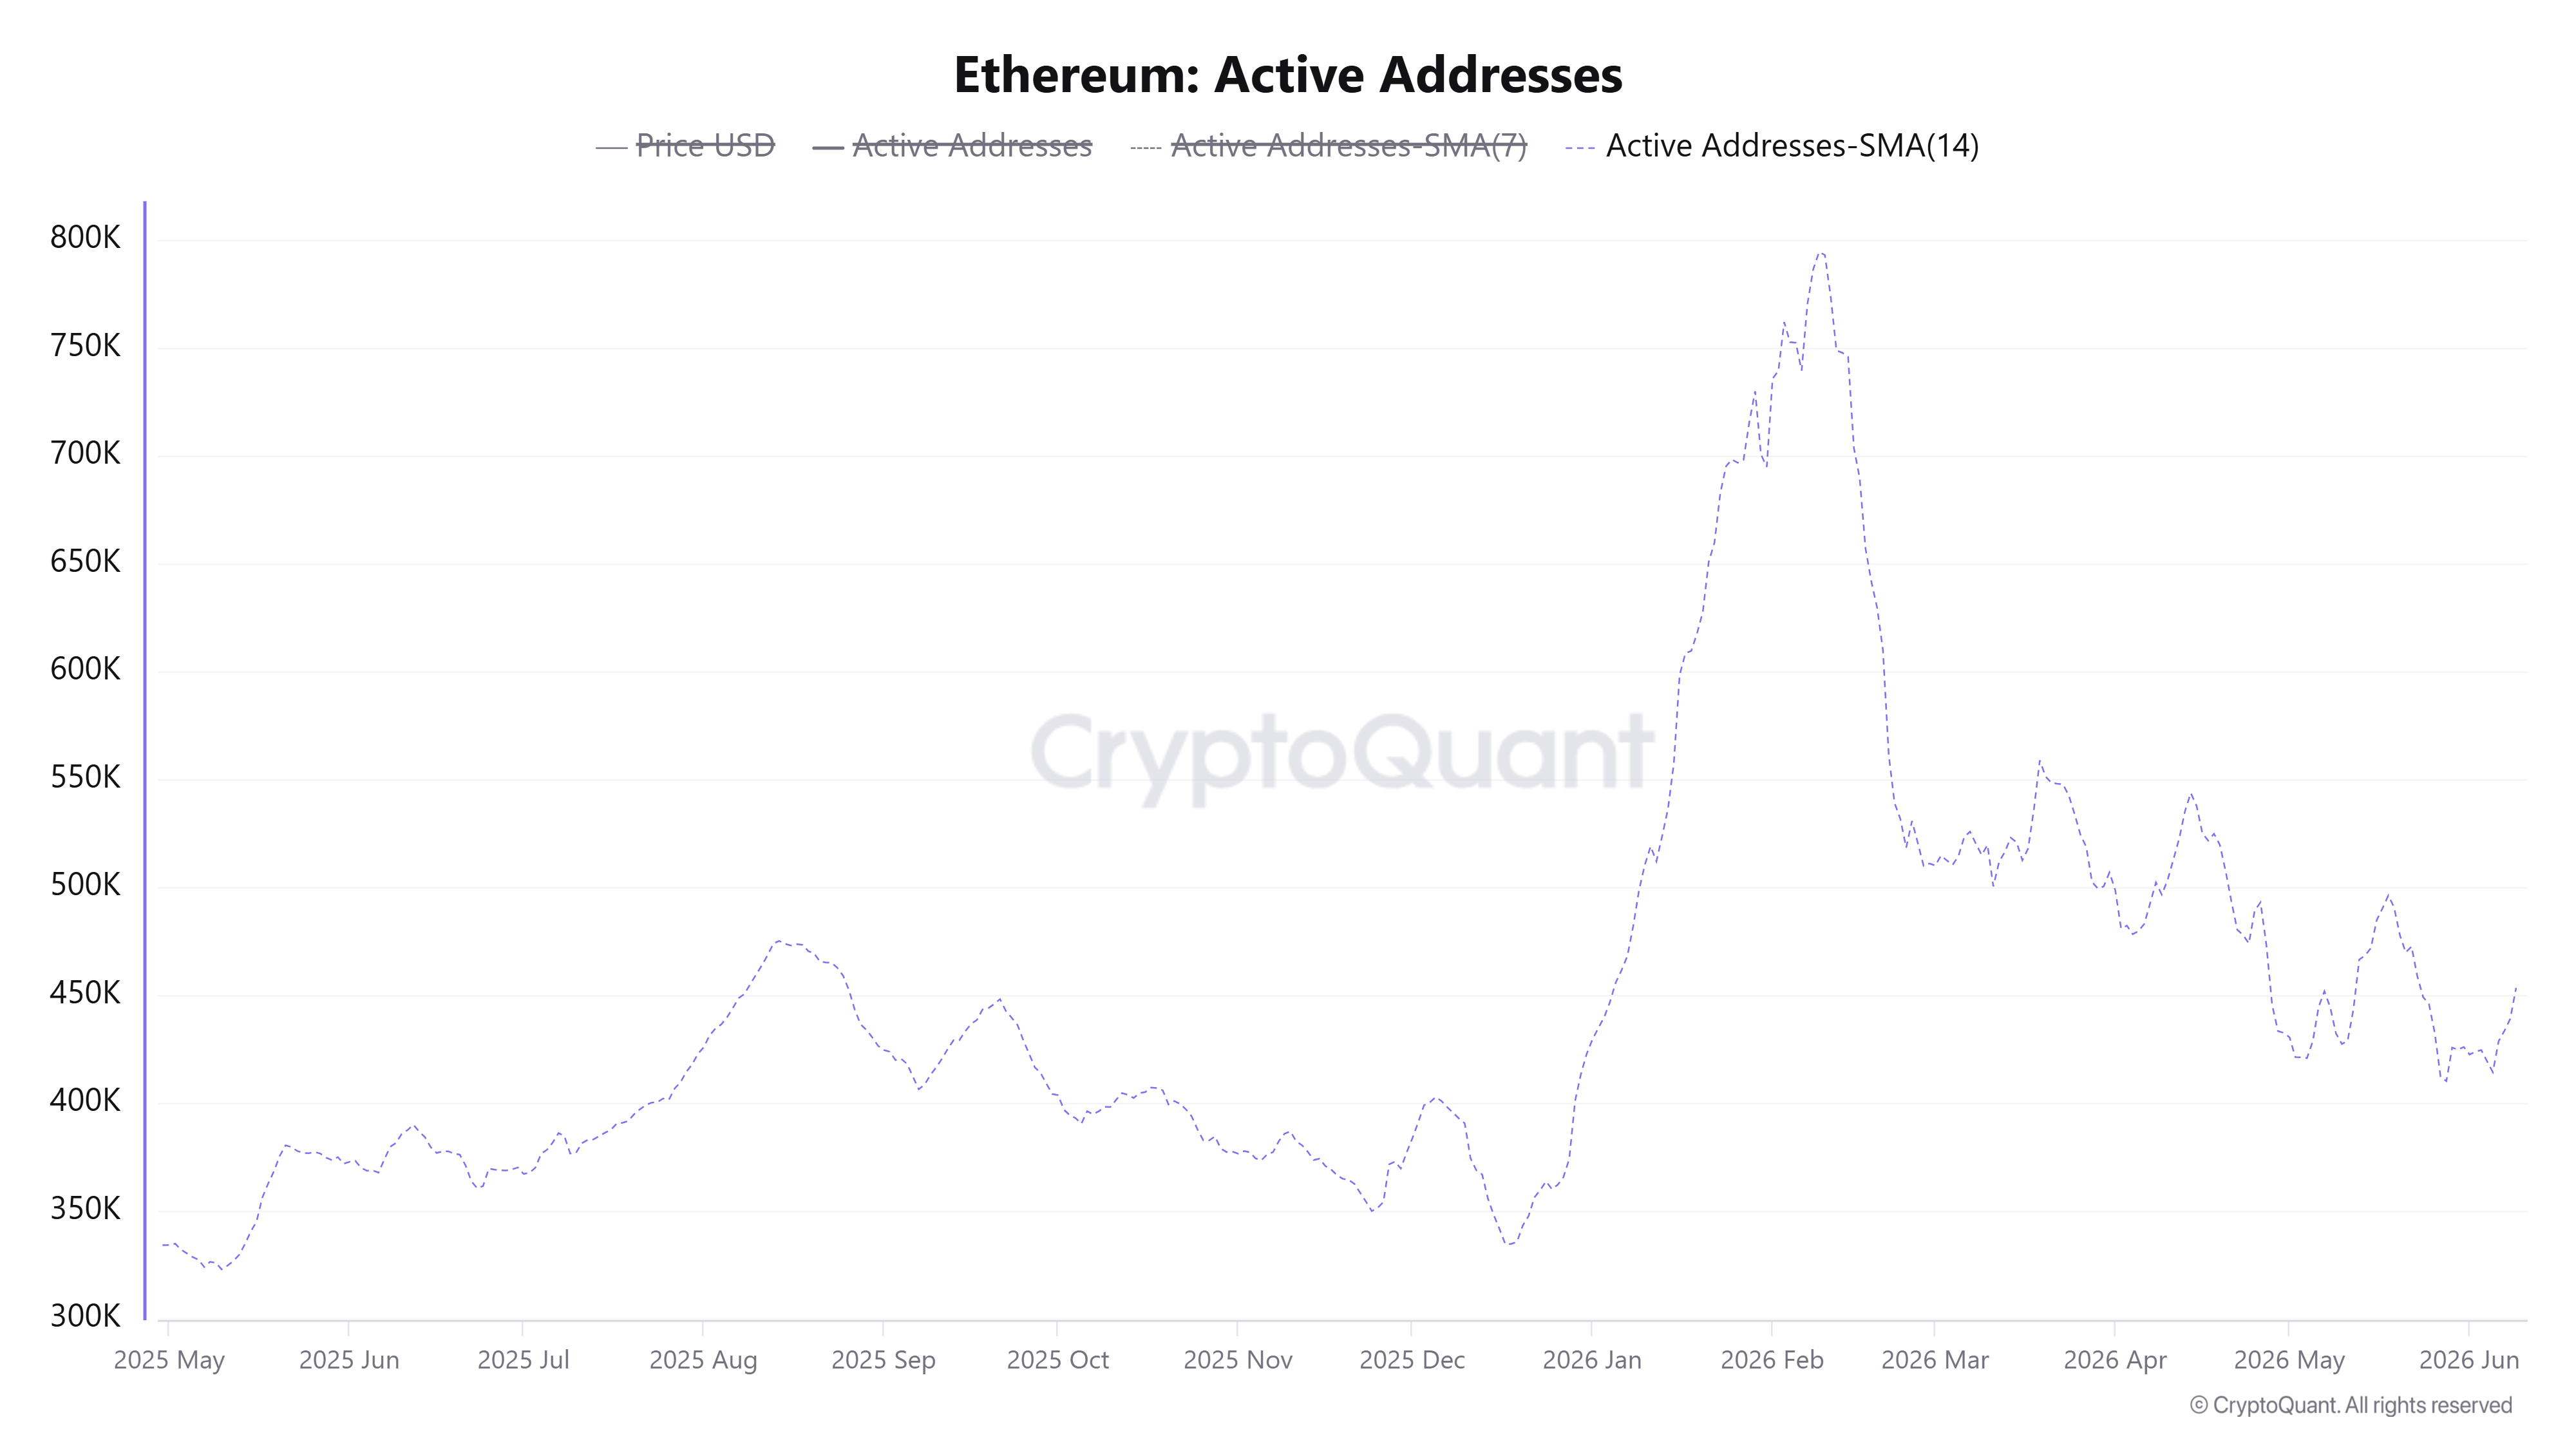
Despite the monthly decline in active addresses, the metric remains above levels seen during the May to October 2025 price rally, suggesting it may be cooling toward normal levels rather than falling solely due to dominant bearish sentiment.
Most of these addresses have maintained high transaction volumes. While transaction counts have declined from record levels seen in May, it remains elevated compared to figures observed during the May-October rally last year.
On the staking side, network health remains strong, with the total supply of staked ETH rising to 39.28 million ETH. The validator entry queue also shows consistent demand, hovering at 2.98 million ETH, while the exit queue is at only 32 ETH. Combined with modest selling activity in spot markets, the move shows that spot investors are flocking to staking to earn yield while prices remain subdued, rather than exiting the market entirely.
Meanwhile, US spot ETH exchange-traded funds (ETFs) returned to negative flows on Tuesday, with investors logging $40.85 million in outflows, according to SoSoValue data.
Ethereum Price Forecast: ETH maintains bearish bias, eyes $1,524 support
Ethereum recorded $68.5 million in liquidations over the past 24 hours, led by $40.9 million in long liquidations, per Coinglass data.
On the daily chart, ETH is holding a clear bearish near‑term bias, with price sitting well below a dense band of previously defined horizontal resistance levels.
The top altcoin trades below all nearby structural caps starting from $1,741, while the 14-day Relative Strength Index (RSI) at 25 and the Stochastic at 23 linger in oversold territory. The move suggests that, while downside pressure prevails, the pace of the recent slide could moderate or see a short‑lived bounce rather than a sustained recovery for now.
On the topside, initial resistance is seen at $1,741, followed by $1,806 and $1,909, with further barriers at $2,018 and $2,108. Above these levels, additional resistance is at $2,211 and $2,389.
On the downside, immediate focus falls on the horizontal support at $1,524, ahead of a secondary floor near $1,405 and a more strategic base around $1,156.
(The technical analysis of this story was written with the help of an AI tool.)

Oltre un milione di utenti si affida a FXStreet per dati di mercato in tempo reale, strumenti di charting, approfondimenti di esperti e notizie Forex. Il loro calendario economico completo e i webinar formativi aiutano i trader a rimanere informati e a prendere decisioni ponderate. FXStreet conta circa 60 professionisti tra la sede di Barcellona e diverse regioni globali.
Leggi di più


