
EUR/JPY Price Forecast: Slips below 184.50 near the confluence around descending wedge top
Di Akhtar Faruqui
Aggiornato: 15 May 2026


ARTICOLI POPOLARI

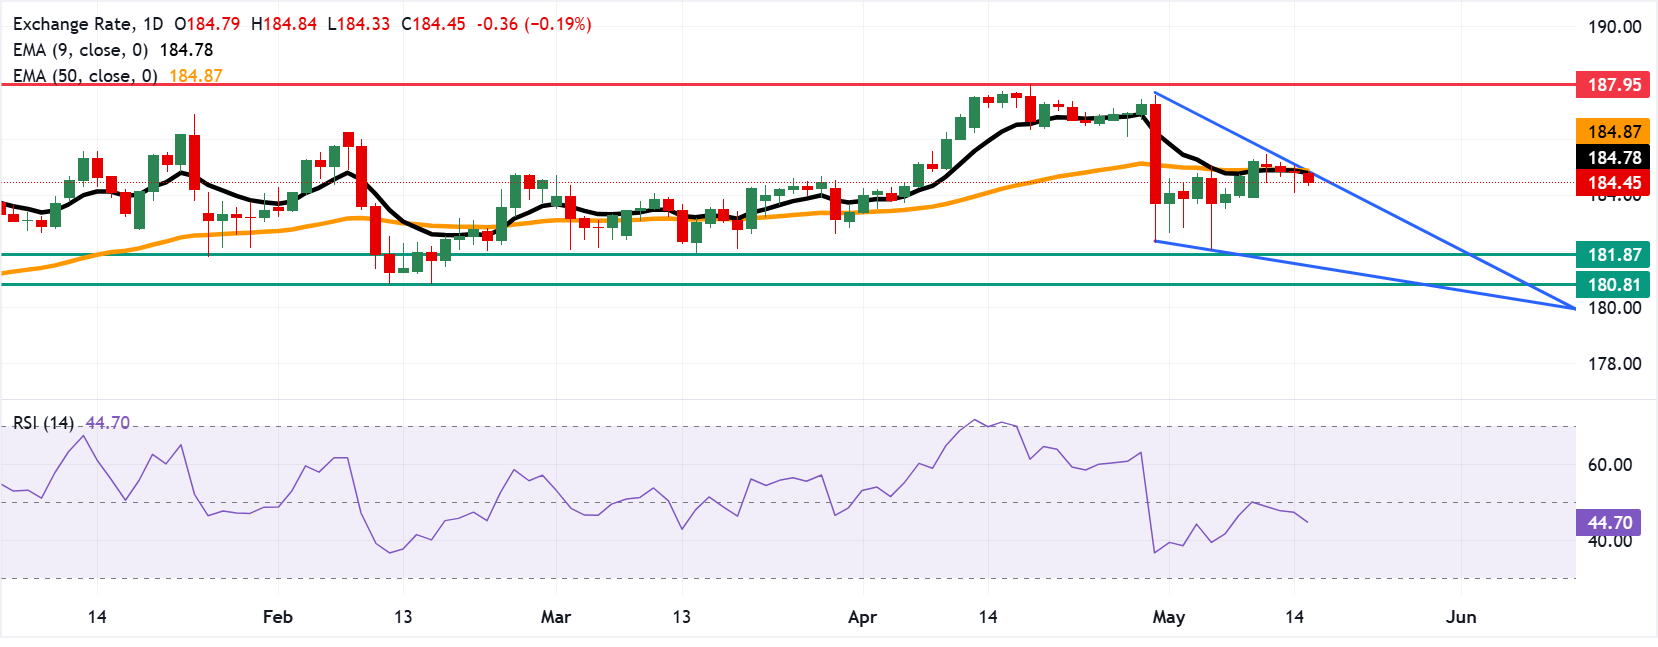
EUR/JPY continues its losing streak for the fourth successive day, trading around 184.40 during the European hours on Friday. The technical analysis of the daily chart indicates the currency cross is positioned slightly below the upper boundary of an emerging descending wedge pattern.
- EUR/JPY may retest the immediate barrier at the nine-day EMA of 184.78.
- The 14-day Relative Strength Index at 44.70 is still suggesting fading bullish momentum.
- The currency cross may fall toward the 12-week low of 181.87.
EUR/JPY continues its losing streak for the fourth successive day, trading around 184.40 during the European hours on Friday. The technical analysis of the daily chart indicates the currency cross is positioned slightly below the upper boundary of an emerging descending wedge pattern. The pattern shows lower highs and lower lows; the narrowing price range indicates that selling momentum is losing steam.
The EUR/JPY cross keeps a bearish near-term tone as it holds below both the nine-period and 50-period Exponential Moving Averages (EMAs), respectively. The currency cross has retreated from recent highs, and the 14-day Relative Strength Index (RSI) at 44.70 leans slightly to the downside, suggesting fading bullish momentum rather than an oversold condition.
The EUR/JPY cross may test the immediate barrier at the nine-day EMA of 184.78, followed by the 50-day EMA at 184.87 and the upper boundary of the descending wedge. A successful break above the confluence resistance zone around the wedge would support the EUR/JPY cross to explore the region around the all-time high of 187.95, which was recorded on April 17.
On the downside, the EUR/JPY cross may navigate the region around the 12-week low of 181.87, recorded on March 16, followed by a five-month low of 180.81, which was reached on February 12.
(The technical analysis of this story was written with the help of an AI tool.)
Euro Price Today
The table below shows the percentage change of Euro (EUR) against listed major currencies today. Euro was the weakest against the Japanese Yen.
| USD | EUR | GBP | JPY | CAD | AUD | NZD | CHF | |
|---|---|---|---|---|---|---|---|---|
| USD | 0.23% | 0.27% | -0.02% | 0.18% | 0.72% | 0.77% | 0.13% | |
| EUR | -0.23% | 0.03% | -0.24% | -0.07% | 0.49% | 0.57% | -0.09% | |
| GBP | -0.27% | -0.03% | -0.25% | -0.09% | 0.46% | 0.52% | -0.13% | |
| JPY | 0.02% | 0.24% | 0.25% | 0.19% | 0.71% | 0.78% | 0.13% | |
| CAD | -0.18% | 0.07% | 0.09% | -0.19% | 0.52% | 0.56% | -0.05% | |
| AUD | -0.72% | -0.49% | -0.46% | -0.71% | -0.52% | 0.07% | -0.58% | |
| NZD | -0.77% | -0.57% | -0.52% | -0.78% | -0.56% | -0.07% | -0.64% | |
| CHF | -0.13% | 0.09% | 0.13% | -0.13% | 0.05% | 0.58% | 0.64% |
The heat map shows percentage changes of major currencies against each other. The base currency is picked from the left column, while the quote currency is picked from the top row. For example, if you pick the Euro from the left column and move along the horizontal line to the US Dollar, the percentage change displayed in the box will represent EUR (base)/USD (quote).

Oltre un milione di utenti si affida a FXStreet per dati di mercato in tempo reale, strumenti di charting, approfondimenti di esperti e notizie Forex. Il loro calendario economico completo e i webinar formativi aiutano i trader a rimanere informati e a prendere decisioni ponderate. FXStreet conta circa 60 professionisti tra la sede di Barcellona e diverse regioni globali.
Leggi di più


