
GBP/JPY Price Forecast: To consolidate after testing the 100-day SMA
Di Christian Borjon Valencia
Aggiornato: 4 May 2026


ARTICOLI POPOLARI

The GBP/JPY fell by some 0.23% during Monday’s session as the safe-haven appeal of the Japanese Yen weighed on the pair, which continues to digest price action in the aftermath of Japanese authorities' intervention in the FX markets.
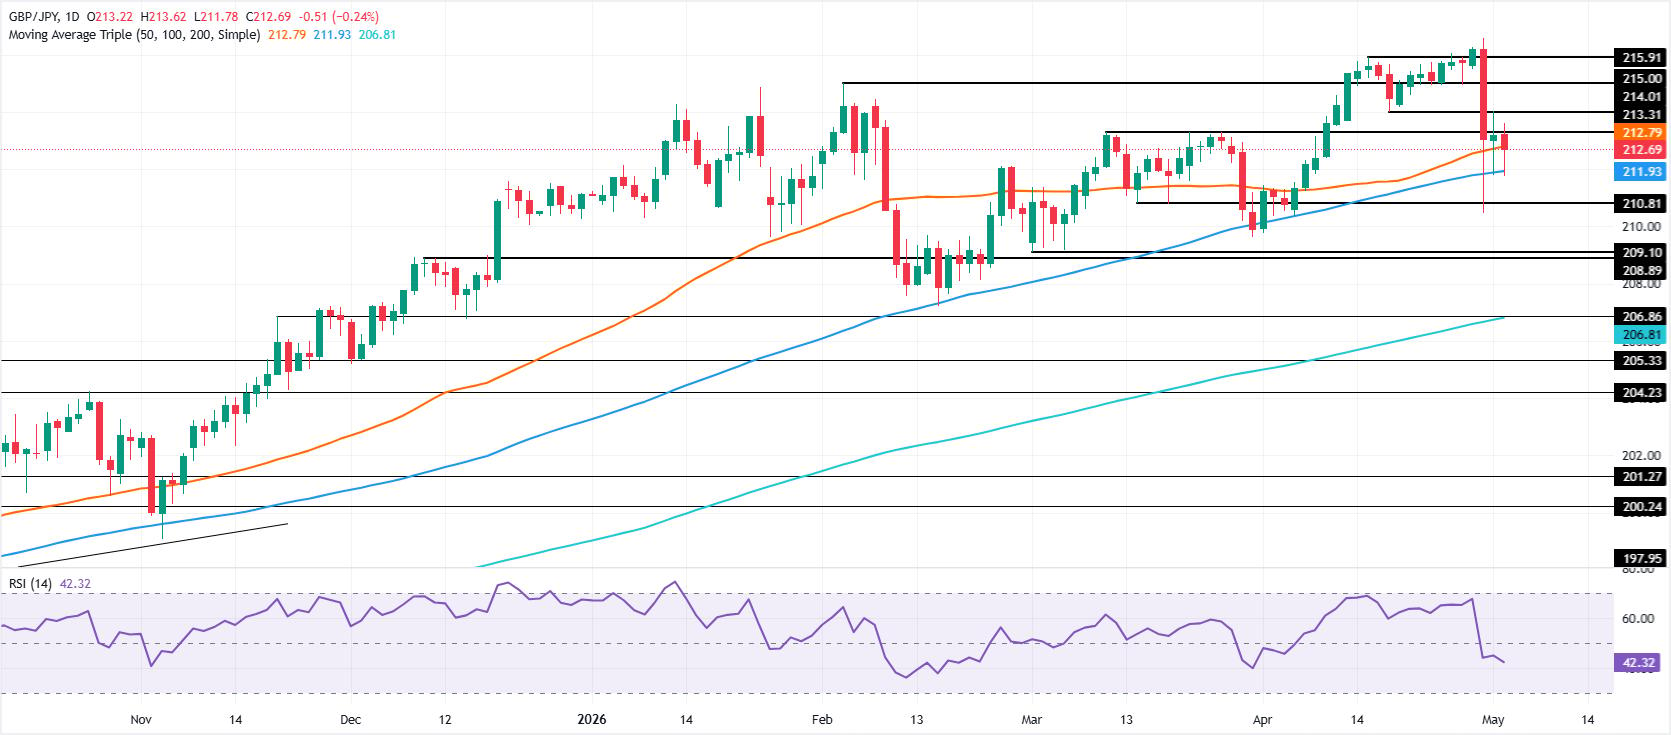
- GBP/JPY trapped between 50- and 100-day SMAs near 212.00.
- Bullish momentum persists as long as price holds above 209.64.
- Break above 213.00 targets 214.01 and 215.00 resistance levels.
The GBP/JPY fell by some 0.23% during Monday’s session as the safe-haven appeal of the Japanese Yen weighed on the pair, which continues to digest price action in the aftermath of Japanese authorities' intervention in the FX markets. At the time of writing, the cross-pair trade is at 212.72, near the 50-day Simple Moving Average (SMA) of 212.79.
GBP/JPY Price Forecast: Technical outlook
The momentum in the cross-pair remains bullish, with buyers stepping in once GBP/JPY tested the 100-day SMA at 211.93 and the 50-day SMA at 212.79. Although price action is capped within the two previously mentioned levels, as long as spot prices remain above the March 31 cycle low of 209.64, buyers could remain hopeful of higher prices.
For a bearish continuation, sellers must clear the 100-day SMA. Once surpassed, the next stop is the March 16 daily low of 210.81, followed by the 209.64 cycle low registered on March 29.
On the flip side, if GBP/JPY clears the 213.00 figure, buyers could re-engage and challenge the April 17 low-turned-resistance at 214.01 ahead of the 215.00 psychological level.
GBP/JPY Price Chart – Daily
Japanese Yen Price This week
The table below shows the percentage change of Japanese Yen (JPY) against listed major currencies this week. Japanese Yen was the strongest against the New Zealand Dollar.
| USD | EUR | GBP | JPY | CAD | AUD | NZD | CHF | |
|---|---|---|---|---|---|---|---|---|
| USD | 0.02% | 0.03% | -0.02% | -0.01% | 0.02% | 0.04% | -0.03% | |
| EUR | -0.02% | 0.02% | -0.02% | -0.00% | -0.01% | 0.04% | 0.00% | |
| GBP | -0.03% | -0.02% | -0.02% | -0.03% | -0.02% | 0.04% | -0.00% | |
| JPY | 0.02% | 0.02% | 0.02% | -0.02% | -0.02% | 0.05% | -0.02% | |
| CAD | 0.01% | 0.00% | 0.03% | 0.02% | 0.00% | 0.07% | 0.03% | |
| AUD | -0.02% | 0.00% | 0.02% | 0.02% | -0.00% | 0.04% | 0.04% | |
| NZD | -0.04% | -0.04% | -0.04% | -0.05% | -0.07% | -0.04% | -0.02% | |
| CHF | 0.03% | -0.01% | 0.00% | 0.02% | -0.03% | -0.04% | 0.02% |
The heat map shows percentage changes of major currencies against each other. The base currency is picked from the left column, while the quote currency is picked from the top row. For example, if you pick the Japanese Yen from the left column and move along the horizontal line to the US Dollar, the percentage change displayed in the box will represent JPY (base)/USD (quote).

Oltre un milione di utenti si affida a FXStreet per dati di mercato in tempo reale, strumenti di charting, approfondimenti di esperti e notizie Forex. Il loro calendario economico completo e i webinar formativi aiutano i trader a rimanere informati e a prendere decisioni ponderate. FXStreet conta circa 60 professionisti tra la sede di Barcellona e diverse regioni globali.
Leggi di più


