

Gold extends recovery on US-Iran deal hopes, but hawkish Fed signals limit upside
- Gold rebounds from a two-month low but remains on track for a third straight monthly decline.
- Markets assess a proposed US-Iran agreement that would reopen the Strait of Hormuz and extend the ceasefire.
- XAU/USD consolidates after its recent rebound, with momentum indicators showing mixed signals after the recent rebound.
Gold (XAU/USD) extends its rebound on Friday as traders assess the prospects of a potential US-Iran deal. At the time of writing, XAU/USD trades around $4,530 after recovering from a two-month low of $4,366 touched on Thursday.

Risk sentiment improved after Axios reported on Thursday that the US and Iran reached a 60-day memorandum of understanding (MOU). The deal would extend the current ceasefire and reopen the Strait of Hormuz. During this period, both sides would continue talks on Iran's nuclear program.
Oil prices turned lower following the latest developments, with West Texas Intermediate (WTI) trading around $87 per barrel and heading for its first monthly decline in five months. Still, crude prices remain well above pre-war levels, keeping inflation concerns in focus.
The proposed agreement still needs final approval from US President Donald Trump. Meanwhile, Iran's Tasnim news agency reported that the deal is not finalized or confirmed.
US Treasury Secretary Scott Bessent said on Thursday that Trump has three conditions for any agreement. Iran must reopen the Strait of Hormuz, hand over its enriched uranium and fully end its nuclear program.
The lingering uncertainty is keeping dips in the US Dollar (USD) shallow. The US Dollar Index (DXY), which tracks the Greenback’s value against a basket of six major currencies, continues to consolidate within a two-week-old range above the 99.00 mark.
As a result, Gold’s upside remains limited, while hawkish signals from the Federal Reserve (Fed) linked to elevated Oil prices act as an additional headwind. The precious metal is on course for a third monthly drop.
The Latest US Personal Consumption Expenditure (PCE) inflation data also reinforced expectations that the Fed could keep interest rates higher for longer as inflation pushes further away from the central bank’s 2% target.
Kansas City Fed President Jeff Schmid said on Friday that policymakers “may need to weigh how to make monetary policy more restrictive” and stressed that the Fed “must signal commitment to lowering inflation.”
Looking ahead, the US economic calendar remains relatively light on Friday, leaving Gold at the mercy of Fed commentary and headlines surrounding US-Iran talks.
Technical Analysis: XAU/USD consolidates after rebound from two-month low
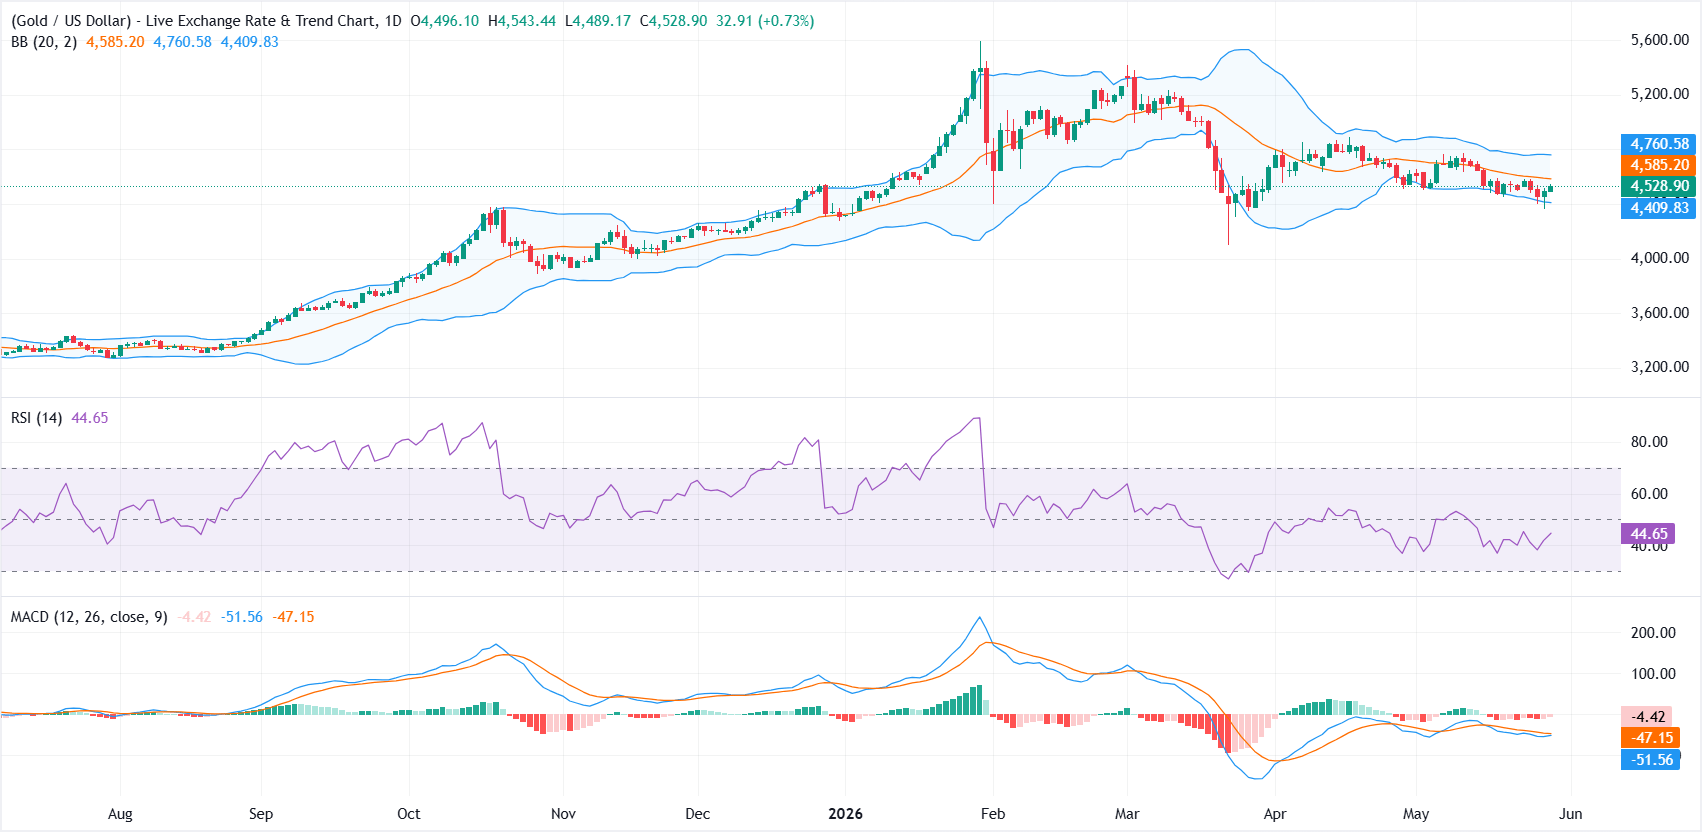
XAU/USD sits between the Bollinger Bands midline at roughly $4,585 and the lower band near $4,410, leaving the near-term tone broadly neutral as Gold consolidates after its recent rebound.
The Bollinger Bands 20-day Simple Moving Average (SMA) suggests the primary volatility mean now acts as overhead resistance, while the lower band underpins the downside. Momentum is mildly soft, with the Relative Strength Index (RSI) at 45, and the Moving Average Convergence Divergence (MACD) still negative but improving, hinting at a market caught in mean-reversion rather than a directional trend.
On the topside, initial resistance is located at the Bollinger midline around $4,585, and a sustained break above this area would open the way toward the upper band near $4,761.
On the downside, the lower Bollinger Band at approximately $4,410 marks the first key support, and a daily close below this floor would expose the recent volatility lows and risk a deeper corrective extension.
(The technical analysis of this story was written with the help of an AI tool.)
Inflation FAQs
Inflation measures the rise in the price of a representative basket of goods and services. Headline inflation is usually expressed as a percentage change on a month-on-month (MoM) and year-on-year (YoY) basis. Core inflation excludes more volatile elements such as food and fuel which can fluctuate because of geopolitical and seasonal factors. Core inflation is the figure economists focus on and is the level targeted by central banks, which are mandated to keep inflation at a manageable level, usually around 2%.
The Consumer Price Index (CPI) measures the change in prices of a basket of goods and services over a period of time. It is usually expressed as a percentage change on a month-on-month (MoM) and year-on-year (YoY) basis. Core CPI is the figure targeted by central banks as it excludes volatile food and fuel inputs. When Core CPI rises above 2% it usually results in higher interest rates and vice versa when it falls below 2%. Since higher interest rates are positive for a currency, higher inflation usually results in a stronger currency. The opposite is true when inflation falls.
Although it may seem counter-intuitive, high inflation in a country pushes up the value of its currency and vice versa for lower inflation. This is because the central bank will normally raise interest rates to combat the higher inflation, which attract more global capital inflows from investors looking for a lucrative place to park their money.
Formerly, Gold was the asset investors turned to in times of high inflation because it preserved its value, and whilst investors will often still buy Gold for its safe-haven properties in times of extreme market turmoil, this is not the case most of the time. This is because when inflation is high, central banks will put up interest rates to combat it. Higher interest rates are negative for Gold because they increase the opportunity-cost of holding Gold vis-a-vis an interest-bearing asset or placing the money in a cash deposit account. On the flipside, lower inflation tends to be positive for Gold as it brings interest rates down, making the bright metal a more viable investment alternative.














