

Pi Network Price Forecast: PI tests key support as bears anticipate further decline
- Pi Network tests $0.1000 on Friday, edging higher after six consecutive days of weakness.
- Eric He, a LBank Risk Control Advisor, expects real on-chain engagement to be a key bullish catalyst for Pi Network.
- The technical outlook is bearish as intense sell-side momentum warns of a steeper correction despite mild intraday recovery.
Pi Network (PI) trades around $0.1000 on Friday, testing a key psychological threshold after six consecutive days of losses. The PI token remains susceptible to further losses as bearish momentum remains firm despite oversold conditions, while experts anticipate that fundamental signals, such as real on-chain engagement, could drive the next meaningful recovery in Pi Network.

Easing market sentiment and on-chain engagement could fuel PI token prices
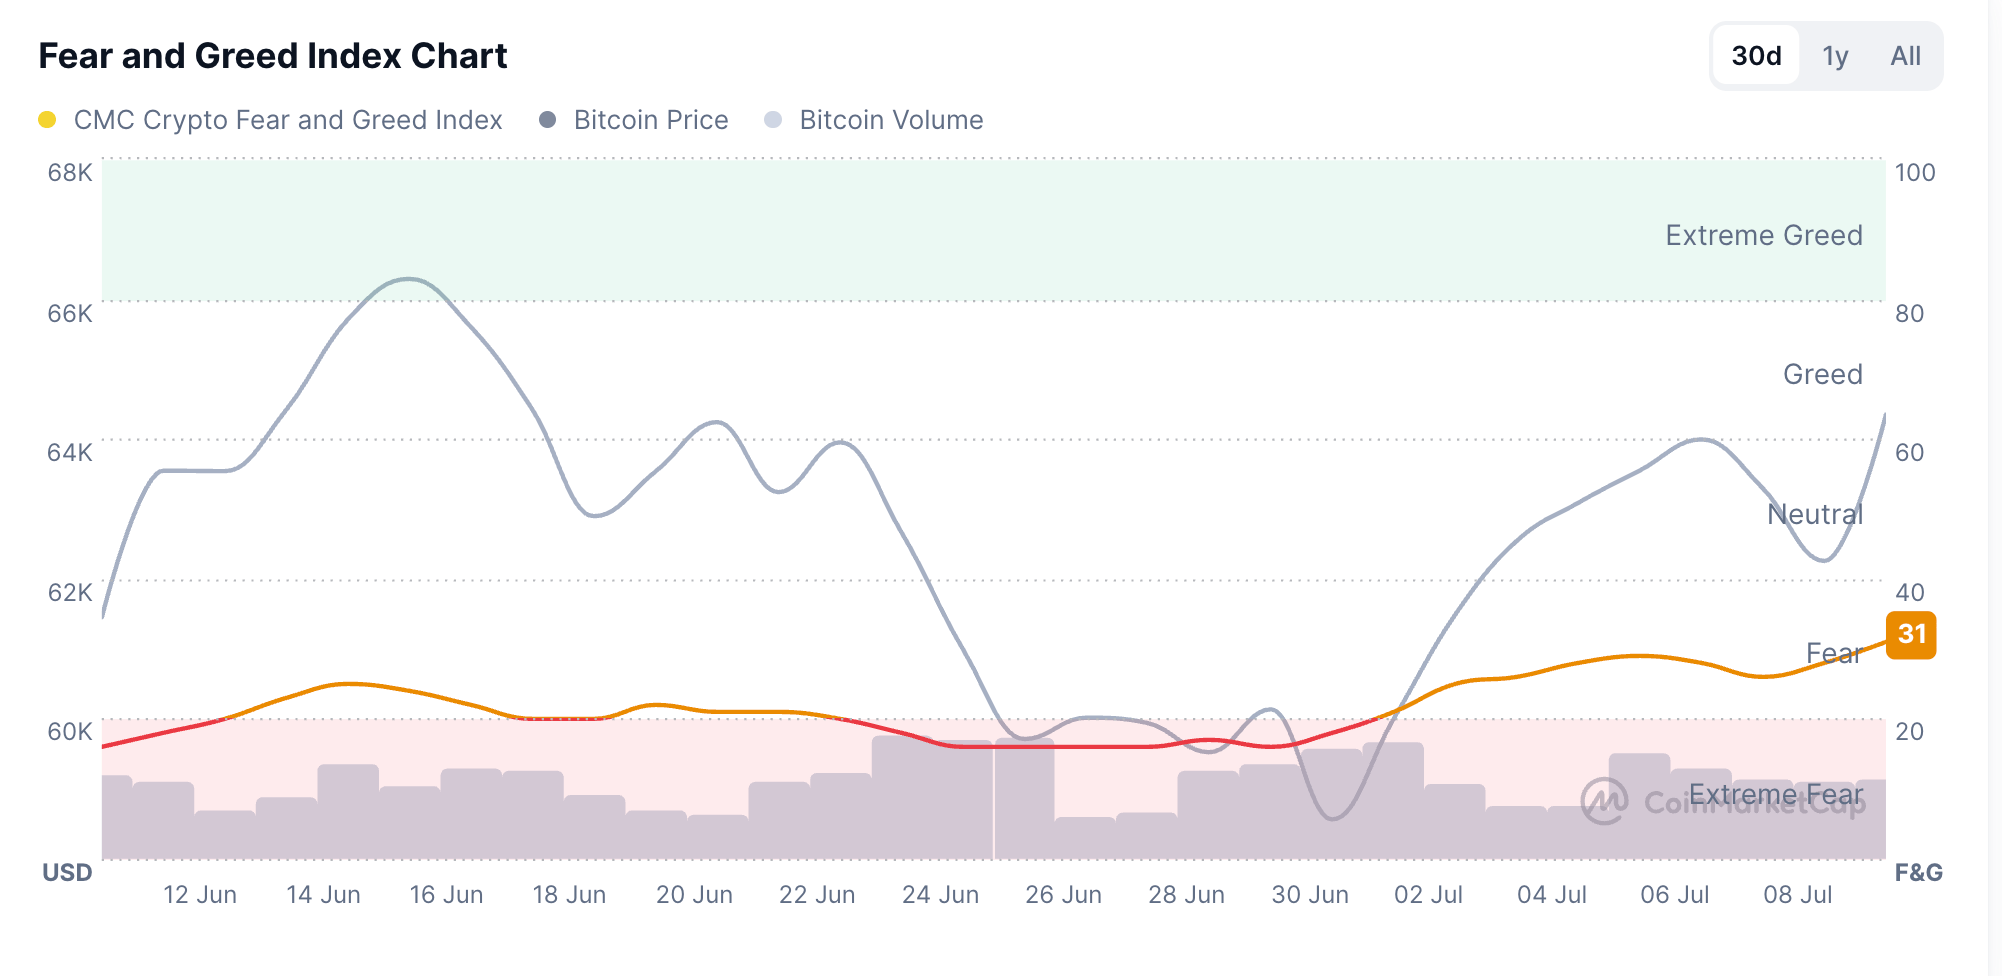
The broader crypto market shows early signs of waning risk-off sentiment amid easing geopolitical tensions between the US and Iran. CoinMarketCap’s Fear and Greed Index at 31 on Friday, up from 26 on Wednesday, reaffirms the mild recovery in investors' risk appetite. Typically, recovery in speculative tokens such as PI aligns with increased risk-on market sentiment.
Eric He, a LBank Risk Control Advisor, said in an exclusive interview with FXStreet that, “Pi Network shows steady technical progress with the v26 upgrade and public smart contracts. Given its vast user base, the key will be successful migration and real on-chain engagement as it advances toward open mainnet.”
Pi Network risks a steeper correction below $0.1000
Pi Network edges higher on Friday, after six straight days of losses, reflecting a long-term bearish bias. PI token price sits well below the 50-day Exponential Moving Average (EMA) at $0.1397 and the 200-day EMA near $0.1712, suggesting that mild recovery moves are likely to remain corrective within a broader downtrend.
That said, the Relative Strength Index (RSI) hovers near 22 in oversold territory, while the Moving Average Convergence Divergence (MACD) descends into negative territory as the bearish profile expands, hinting that downside momentum, though stretched, remains dominant.
Looking down, PI remains below the S1 Pivot level at $0.1010, implying the S2 Pivot level as the next key support level at $0.0867.
On the topside, initial resistance is seen at the S1 Pivot level at $0.1010, followed by the 50-day EMA around $0.1397, which remains a key hurdle that bulls would need to reclaim to ease immediate selling pressure.
(The technical analysis of this story was written with the help of an AI tool. Know more.)














