
Pudgy Penguins Price Forecast: PENGU extends gains as bullish momentum strengthens
Di Manish Chhetri
Aggiornato: 29 Apr 2026


ARTICOLI POPOLARI

Pudgy Penguins (PENGU) extends its gains on Wednesday, trading above $0.0104, surging over 16% so far this week. The announcement of Paxos support for PENGU tokens further strengthens the bullish narrative.
- Pudgy Penguins extends gains on Wednesday, after surging over 16% so far this week.
- PENGU team announced on Tuesday that Paxos now supports the token, paving the way for potential listings on major retail trading platforms.
- On-chain data shows buy-side dominance, and futures Open Interest remains near yearly highs.
Pudgy Penguins (PENGU) extends its gains on Wednesday, trading above $0.0104, surging over 16% so far this week. The announcement of Paxos support for PENGU tokens further strengthens the bullish narrative. Moreover, on-chain data shows buy-side dominance, and Open Interest (OI) remains near yearly highs, hinting at a rally continuation.
PENGU announces partnership with Paxos
PENGU team announced on Tuesday that Paxos, a Crypto Brokerage, now supports the PENGU token.
“With this partnership, PENGU can now be listed on some of the largest retail trading platforms and exchanges used by over 500 million people worldwide,” said Pudgy Penguins on its X post.
However, the price failed to surge sharply on this news on Tuesday, as it was already up by more than 15% on Monday and has been in an uptrend since early April. But this announcement is bullish for the project in the long term, as it adds credibility and accessibility to PENGU and expansion into broader token utility and adoption.
Open interest surges to a yearly high
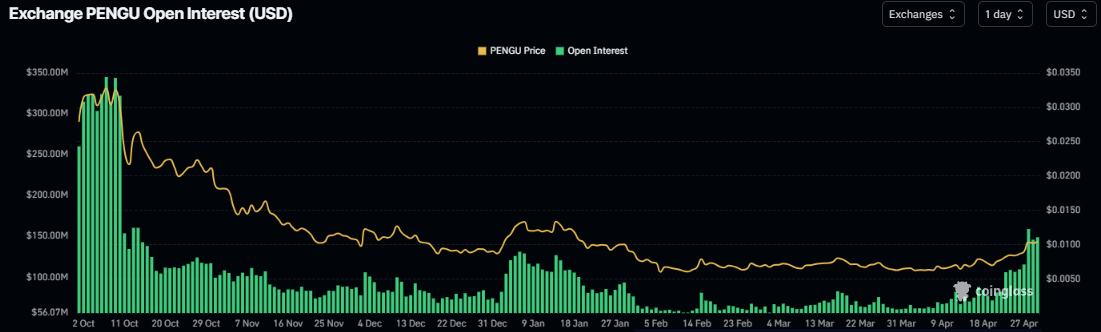
CoinGlass’ data show that PENGU futures Open Interest (OI) at exchanges rose to a yearly high of $158.89 million on Monday, up from $77 million last week, and remains steadily around $149 million on Wednesday. An increasing OI represents new or additional money entering the market and new buying, which could fuel the current PENGU price rally.
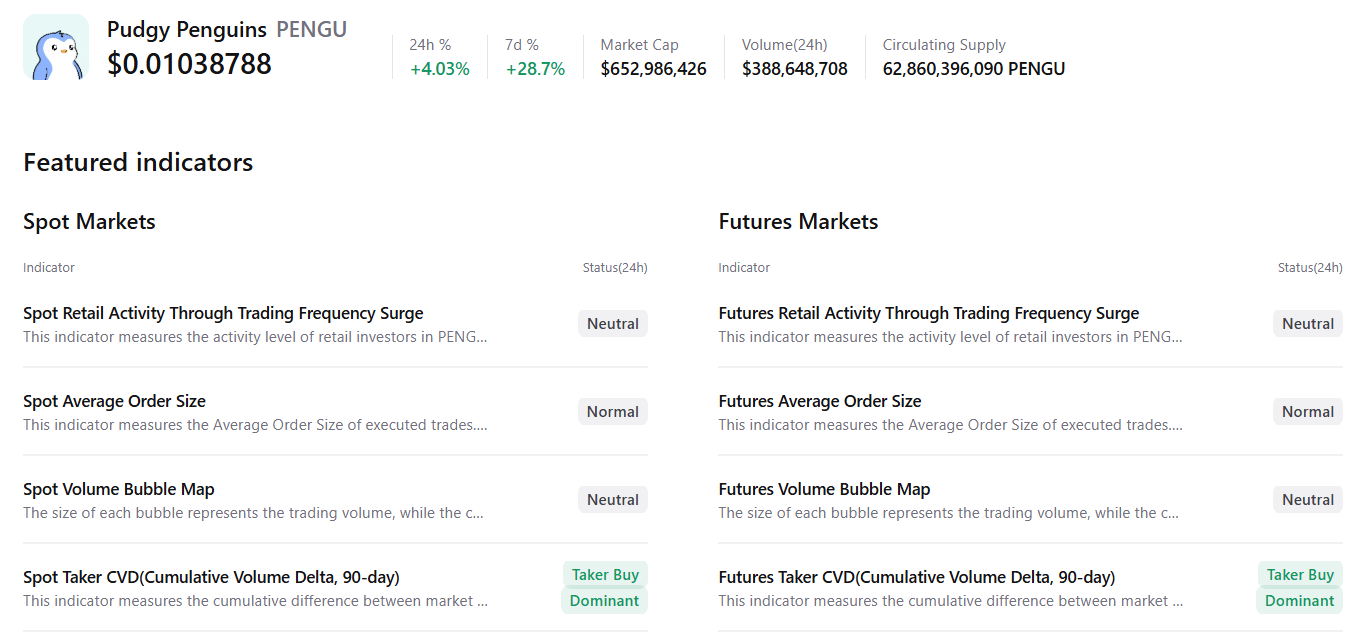
In addition, CryptoQuant’s summary data points to a bullish outlook. Pudgy Penguins’ spot and futures markets show buy-side dominance, with mostly neutral readings on other metrics, signaling improving sentiment among traders and hinting at a potential continuation of the bullish move in the upcoming days.
Pudgy Penguins Price Forecast: PENGU could extend gains if it closes above overhead resistance
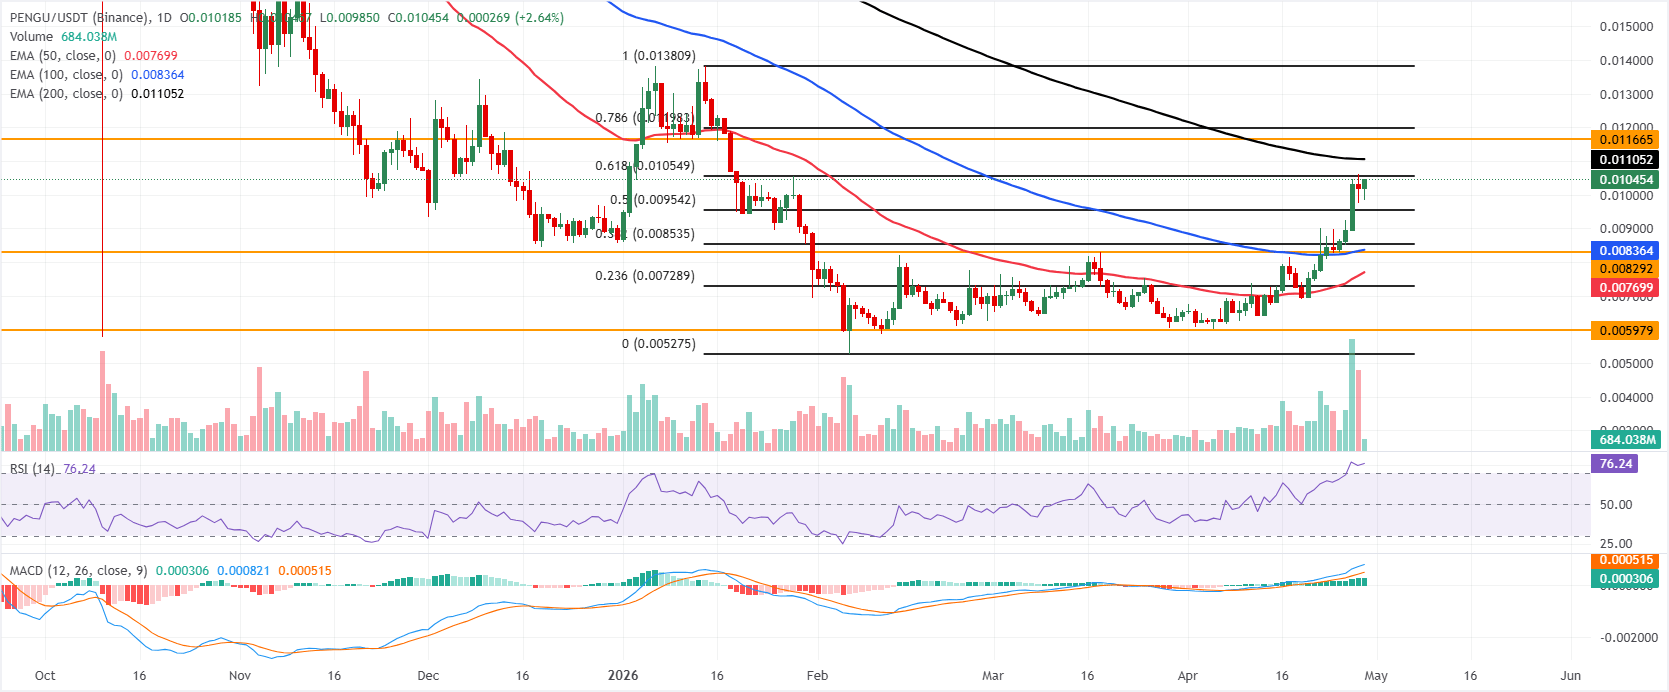
Pudgy Penguins price is trading above $0.0104 on Wednesday after surging over 16% so far this week. PENGU is extending a bullish bias as price holds clearly above the 50-day and 100-day Exponential moving averages (EMAs) at $0.0076 and $0.0083, respectively, while pressing just under the 61.8% Fibonacci retracement, drawn from the January 14 high to the February 6 low, at $0.0105.
The Relative Strength Index (RSI) on the daily chart hovers in overbought territory near 76, and the Moving Average Convergence Divergence (MACD) remains positive, which together suggest strong but stretched upside momentum as PENGU challenges nearby resistance.
On the topside, immediate resistance appears at the 61.8% Fibonacci retracement around $0.0105, followed by the 200-day EMA near $0.0111 and the horizontal barrier at $0.0117, which acts as a more distant cap.
On the downside, initial support is seen at the 50% retracement around $0.0095, ahead of a broader demand zone clustered between the 38.2% Fibonacci retracement at $0.0085, the 100-day EMA near $0.0083 and horizontal support at $0.0082, while deeper pullbacks could look toward the 50-day EMA around $0.0076.
(The technical analysis of this story was written with the help of an AI tool.)

Oltre un milione di utenti si affida a FXStreet per dati di mercato in tempo reale, strumenti di charting, approfondimenti di esperti e notizie Forex. Il loro calendario economico completo e i webinar formativi aiutano i trader a rimanere informati e a prendere decisioni ponderate. FXStreet conta circa 60 professionisti tra la sede di Barcellona e diverse regioni globali.
Leggi di più


